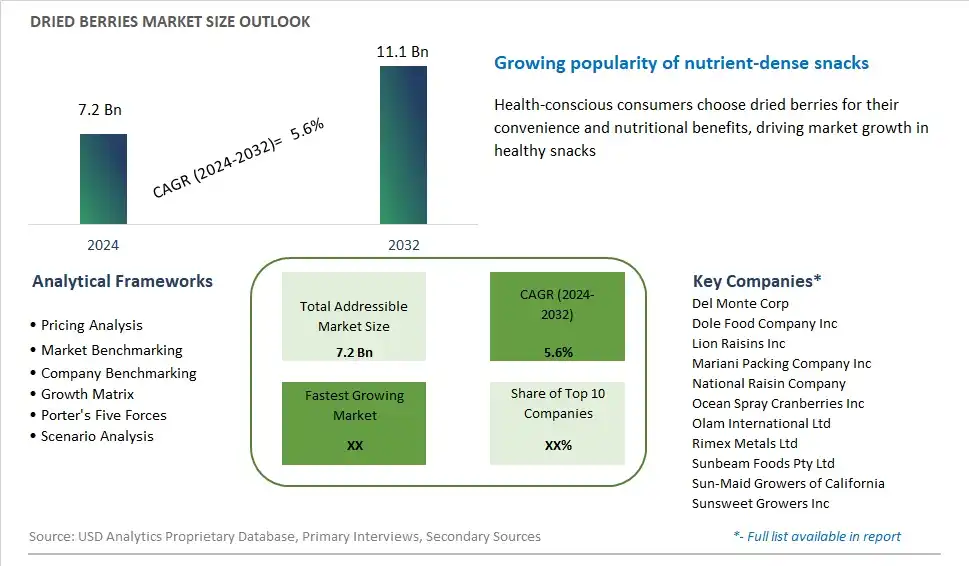
Global Dried Berries Market Size is valued at $7.2 Billion in 2024 and is forecast to register a growth rate (CAGR) of 5.6% to reach $11.1 Billion by 2032.
The global Dried Berries Market Comprehensive Study analyzes and forecasts the market size across 6 regions and 24 countries for diverse segments -By Product (Blueberries, Strawberries, Grapes, Others), By Application (Frozen desserts, Cereals & Snack bars, Bakery & confectionery, Others)
An Introduction to Dried Berries Market
In 2024, the dried berries market is flourishing, driven by their rising popularity as a convenient and healthy snack option. Dried berries, including blueberries, cranberries, strawberries, and goji berries, are celebrated for their high nutrient density, providing antioxidants, vitamins, and fiber. The market benefits from the growing consumer trend towards natural, plant-based, and minimally processed foods. Innovations in drying techniques, such as freeze-drying and air-drying, are improving the quality and shelf life of dried berries, maintaining their nutritional value and flavor. Additionally, the incorporation of dried berries into a wide array of products, from cereals and granolas to baked goods and trail mixes, is expanding their market reach. The emphasis on sustainable and organic farming practices is also boosting consumer confidence and driving market growth.
Dried Berries Competitive Landscape
The market report analyses the leading companies in the industry including Del Monte Corp, Dole Food Company Inc, Lion Raisins Inc, Mariani Packing Company Inc, National Raisin Company, Ocean Spray Cranberries Inc, Olam International Ltd, Rimex Metals Ltd, Sunbeam Foods Pty Ltd, Sun-Maid Growers of California, Sunsweet Growers Inc, and Others.
Dried Berries Market Dynamics
Dried Berries Market Trend: Rising Demand for Healthy and Convenient Snacking Options
One of the most prominent trends in the dried berries market is the rising demand for healthy and convenient snacking options. As consumers increasingly prioritize health and wellness, there is a growing interest in incorporating nutrient-dense foods into their diets. Dried berries, such as cranberries, blueberries, strawberries, and raspberries, offer a convenient and portable snacking solution packed with vitamins, minerals, and antioxidants. This trend is driven by the desire for on-the-go snacks that provide a quick energy boost and satisfy cravings without compromising on nutrition. Dried berries are also versatile ingredients that can be used in various culinary applications, including trail mixes, granola bars, yogurt toppings, and baked goods, further contributing to their popularity among health-conscious consumers seeking wholesome and flavorful snack options.
Market Driver: Increasing Awareness of Health Benefits
The primary driver of the dried berries market is the increasing awareness of the health benefits associated with consuming berries. Berries are known for their high levels of antioxidants, vitamins, and fiber, which are essential for supporting overall health and well-being. Dried berries retain most of their nutritional properties from fresh berries, making them an excellent source of essential nutrients, including vitamin C, vitamin K, and dietary fiber. Moreover, berries have been linked to various health benefits, such as reducing the risk of chronic diseases like heart disease, diabetes, and certain types of cancer. As consumers become more educated about the nutritional value of dried berries and their role in promoting health, there is a growing demand for these wholesome snacks as part of a balanced diet. Manufacturers and retailers can capitalize on this driver by highlighting the health benefits of dried berries through marketing campaigns, product labeling, and educational initiatives to attract health-conscious consumers and drive sales in the market.
Market Opportunity: Expansion into Functional Food and Beverage Applications
A significant opportunity for the dried berries market lies in expansion into functional food and beverage applications. With the growing trend towards functional foods and beverages that offer additional health benefits beyond basic nutrition, dried berries present an opportunity for innovation in product development. Manufacturers can explore incorporating dried berries into a wide range of functional food and beverage products, such as energy bars, smoothie mixes, breakfast cereals, and flavored waters, to enhance their nutritional profiles and appeal to consumers seeking functional benefits. For example, dried berries can be combined with other superfoods, herbs, and botanical extracts to create antioxidant-rich blends that support immune health, improve digestion, or boost energy levels. By leveraging the natural goodness and versatility of dried berries, manufacturers can create value-added products that cater to evolving consumer preferences for nutritious and functional foods, driving growth and differentiation in the market.
Dried Berries Market Share Analysis: Blueberries held the dominant market share in 2024
Within the Dried Berries Market, blueberries emerge as the largest segment, commanding a significant share of the industry. This dominance can be attributed to several key factors, including nutritional value, flavor profile, and consumer demand. Blueberries are renowned for their antioxidant properties, vitamins, and minerals, making them a popular choice among health-conscious consumers seeking nutritious snack options. Further, the sweet and tart flavor of blueberries appeals to a wide range of palates, making them a versatile ingredient in various culinary applications, including baking, snacking, and trail mixes. Additionally, blueberries are widely available and cultivated in many regions globally, ensuring consistent supply and accessibility for consumers. As consumers continue to prioritize health and wellness, the demand for nutritious and flavorful dried blueberries is expected to remain strong, maintaining the segment's dominance in the Dried Berries Market.
Dried Berries Market Share Analysis: Cereals & Snack Bars held the dominant market share in 2024
Among the application segments in the Dried Berries Market, cereals & snack bars stand out as the fastest-growing, experiencing notable expansion in recent years. The robust growth outlook is driven by several factors, including consumer preferences for convenient and nutritious snack options, as well as the increasing demand for natural and flavorful ingredients in packaged foods. Dried berries, such as blueberries, strawberries, and grapes, are prized for their sweet and tangy flavor profiles, as well as their nutritional benefits, including vitamins, antioxidants, and fiber. As a result, food manufacturers are incorporating dried berries into a variety of cereals and snack bars to enhance taste, texture, and nutritional value. Further, the rising popularity of on-the-go snacking and breakfast alternatives has driven demand for portable and convenient products containing dried berries. Additionally, the versatility of dried berries allows for creative formulations and flavor combinations, catering to diverse consumer preferences and dietary needs. As consumer awareness of the health benefits of dried berries continues to grow, coupled with the innovation and expansion of the cereals & snack bars segment, the demand for dried berries in this application is expected to fuel the segment's rapid growth in the Dried Berries Market.
Dried Berries Market Segmentation
By Product
Blueberries
Strawberries
Grapes
Others
By Application
Frozen desserts
Cereals & Snack bars
Bakery & confectionery
Others
Countries Analyzed
North America (US, Canada, Mexico)
Europe (Germany, UK, France, Spain, Italy, Russia, Rest of Europe)
Asia Pacific (China, India, Japan, South Korea, Australia, South East Asia, Rest of Asia)
South America (Brazil, Argentina, Rest of South America)
Middle East and Africa (Saudi Arabia, UAE, Rest of Middle East, South Africa, Egypt, Rest of Africa)
Dried Berries Companies Profiled in the Study
Del Monte Corp
Dole Food Company Inc
Lion Raisins Inc
Mariani Packing Company Inc
National Raisin Company
Ocean Spray Cranberries Inc
Olam International Ltd
Rimex Metals Ltd
Sunbeam Foods Pty Ltd
Sun-Maid Growers of California
Sunsweet Growers Inc
*- List Not Exhaustive
Chapter 1. TABLE OF CONTENTS
Chapter 2. Introduction to Dried Berries Market
2.1. Market Overview
2.2. Key Statistics and Report Highlights
2.3. Scope of the Comprehensive Study
2.3.1. Market Definition
2.3.2 Countries and Regions Covered
2.3.3 Research Objective
2.3.4 Units, Currency, and Conversions
2.3.5 Industry Value Chain
2.4. Key Market Segments
2.5. Key Companies
2.6. Study Period
Chapter 3. Strategic Analysis Review
3.1. Dried Berries Pricing Analysis and Forecast
3.2. Porter’s Five Forces
3.3. Market Ecosystem
3.4. SWOT Analysis
3.5. Regulatory Scenario
3.3. Effects of Inflation, Russia-Ukraine War, moderating economic growth, and other macroeconomic factors
Chapter 4. Competitive Landscape
4.1. Market Share Analysis
4.1.1. Global Dried Berries Market Share by Company, 2023
4.1.2. Product Offerings of Leading Dried Berries Companies
4.2. Market Entropy
4.2.1. New Product Launches in the Industry
4.2.2. Mergers, Acquisitions, Joint ventures, and Partnerships
4.3. Key Strategies and Best Practices
Chapter 5. Global Market Projections: Best, Reference, and Low Case Scenarios
5.1. Growth Analysis- Case Scenario Definitions
5.2. Low Growth Case Scenario Forecasts
5.3. Reference Growth Case Scenario Forecasts
5.4. High Growth Case Scenario Forecasts
Chapter 6. Market Dynamics
6.1. Dried Berries Market Drivers
6.2. Dried Berries Market Challenges
6.6. Dried Berries Market Opportunities
6.4. Dried Berries Market Trends
Chapter 7. Global Dried Berries Market Outlook Trends
7.1. Global Dried Berries Revenue (USD Million) and CAGR (%) by Type (2021-2032)
7.2. Global Dried Berries Revenue (USD Million) and CAGR (%) by Application (2021-2032)
7.3. Global Dried Berries Revenue (USD Million) and CAGR (%) by Product (2021-2032)
By Product
Blueberries
Strawberries
Grapes
Others
By Application
Frozen desserts
Cereals & Snack bars
Bakery & confectionery
Others
Chapter 8. Global Dried Berries Regional Analysis and Outlook
8.1. Global Dried Berries Revenue (USD Million) By Regions (2021- 2032)
8.2. North America Dried Berries Revenue (USD Million) by Country (2021-2032)
8.2.1. United States Dried Berries Regional Analysis and Outlook
8.2.2. Canada Dried Berries Regional Analysis and Outlook
8.2.3. Mexico Dried Berries Regional Analysis and Outlook
8.3. Europe Dried Berries Revenue (USD Million), by Country (2021-2032)
8.3.1. Germany Dried Berries Regional Analysis and Outlook
8.3.2. France Dried Berries Regional Analysis and Outlook
8.3.3. United Kingdom Dried Berries Regional Analysis and Outlook
8.3.4. Spain Dried Berries Regional Analysis and Outlook
8.3.5. Italy Dried Berries Regional Analysis and Outlook
8.3.6. Russia Dried Berries Regional Analysis and Outlook
8.3.7. Rest of Europe Dried Berries Regional Analysis and Outlook
8.4. Asia Pacific Dried Berries Revenue (USD Million) by Country (2021-2032)
8.4.1. China Dried Berries Regional Analysis and Outlook
8.4.2. Japan Dried Berries Regional Analysis and Outlook
8.4.3. India Dried Berries Regional Analysis and Outlook
8.4.4. South Korea Dried Berries Regional Analysis and Outlook
8.4.5. Australia Dried Berries Regional Analysis and Outlook
8.4.6. South East Asia Dried Berries Regional Analysis and Outlook
8.4.7. Rest of Asia Pacific Dried Berries Regional Analysis and Outlook
8.5. South America Dried Berries Revenue (USD Million), by Country (2021-2032)
8.5.1. Brazil Dried Berries Regional Analysis and Outlook
8.5.2. Argentina Dried Berries Regional Analysis and Outlook
8.5.3. Rest of South America Dried Berries Regional Analysis and Outlook
8.6. Middle East and Africa Dried Berries Revenue (USD Million) by Country (2021-2032)
8.6.1. Middle East Dried Berries Regional Analysis and Outlook
8.6.2. Africa Dried Berries Regional Analysis and Outlook
Chapter 9. North America Dried Berries Analysis and Outlook
9.1. North America Dried Berries Revenue (USD Million) by Segments (2021-2032)
9.1.1. North America Dried Berries Revenue (USD Million) by Type (2021-2032)
9.1.2. North America Dried Berries Revenue (USD Million) by Application (2021-2032)
9.1.3. North America Dried Berries Revenue (USD Million) by Product (2021-2032)
By Product
Blueberries
Strawberries
Grapes
Others
By Application
Frozen desserts
Cereals & Snack bars
Bakery & confectionery
Others
Chapter 10. Europe Dried Berries Analysis and Outlook
10.1. Europe Dried Berries Revenue (USD Million), by Segments (USD Million) (2021-2032)
10.1.1. Europe Dried Berries Revenue (USD Million) by Type (2021-2032)
10.1.2. Europe Dried Berries Revenue (USD Million) by Application (2021-2032)
10.1.3. Europe Dried Berries Revenue (USD Million) by Product (2021-2032)
By Product
Blueberries
Strawberries
Grapes
Others
By Application
Frozen desserts
Cereals & Snack bars
Bakery & confectionery
Others
Chapter 11. Asia Pacific Dried Berries Analysis and Outlook
11.1. Asia Pacific Dried Berries Revenue (USD Million), and Revenue (USD Million) by Segments (2021-2032)
11.1.1. Asia Pacific Dried Berries Revenue (USD Million) by Type (2021-2032)
11.1.2. Asia Pacific Dried Berries Revenue (USD Million) by Application (2021-2032)
11.1.3. Asia Pacific Dried Berries Revenue (USD Million) by Product (2021-2032)
By Product
Blueberries
Strawberries
Grapes
Others
By Application
Frozen desserts
Cereals & Snack bars
Bakery & confectionery
Others
Chapter 12. South America Dried Berries Analysis and Outlook
12.1. South America Dried Berries Revenue (USD Million), by Segments (2021-2032)
12.1.1. South America Dried Berries Revenue (USD Million) by Type (2021-2032)
12.1.2. South America Dried Berries Revenue (USD Million) by Application (2021-2032)
12.1.3. South America Dried Berries Revenue (USD Million) by Product (2021-2032)
By Product
Blueberries
Strawberries
Grapes
Others
By Application
Frozen desserts
Cereals & Snack bars
Bakery & confectionery
Others
Chapter 13. Middle East and Africa Dried Berries Analysis and Outlook
13.1. Middle East and Africa Dried Berries Revenue (USD Million), by Segments (2021-2032)
13.1.1. Middle East and Africa Dried Berries Revenue (USD Million) by Type (2021-2032)
13.1.2. Middle East and Africa Dried Berries Revenue (USD Million) by Application (2021-2032)
13.1.3. Middle East and Africa Dried Berries Revenue (USD Million) by Product (2021-2032)
By Product
Blueberries
Strawberries
Grapes
Others
By Application
Frozen desserts
Cereals & Snack bars
Bakery & confectionery
Others
Chapter 14. Dried Berries Company Profiles
14.1 Business Overview
14.2 Product Profiles
14.3 SWOT Profiles
14.5 Recent Developments
14.6 Financial Profile
List of Companies
Del Monte Corp
Dole Food Company Inc
Lion Raisins Inc
Mariani Packing Company Inc
National Raisin Company
Ocean Spray Cranberries Inc
Olam International Ltd
Rimex Metals Ltd
Sunbeam Foods Pty Ltd
Sun-Maid Growers of California
Sunsweet Growers Inc
15. Methodology and Data Sources
15.1 Customization Offerings
15.2 Subscription Services
15.3 Related Reports
15.4 Publisher Expertise
LIST OF TABLES
Table 1 Market Segmentation Analysis
Table 2 Global Dried Berries Market Share of Leading Companies, 2023
Table 3 Product Offerings of Leading Companies
Table 4 Low Growth Scenario Forecasts
Table 5 Reference Case Growth Scenario
Table 6 High Growth Case Scenario
Table 7 Global Dried Berries Revenue (USD Million) And CAGR (%) By Type (2021-2032)
Table 8 Global Dried Berries Revenue (USD Million) And CAGR (%) By Application (2021-2032)
Table 9 Global Dried Berries Revenue (USD Million) And CAGR (%) By Product (2021-2032)
Table 10 Global Dried Berries Market Revenue (USD Million) By Regions (2021-2032)
Table 11 Global Dried Berries Market Share (%) By Regions (2021-2032)
Table 12 North America Dried Berries Revenue (USD Million) By Country (2021-2032)
Table 13 Europe Dried Berries Revenue (USD Million) By Country (2021-2032)
Table 14 Asia Pacific Dried Berries Revenue (USD Million) By Country (2021-2032)
Table 15 South America Dried Berries Revenue (USD Million) By Country (2021-2032)
Table 16 Middle East and Africa Dried Berries Revenue (USD Million) By Region (2021-2032)
Table 17 North America Dried Berries Revenue (USD Million) By Type (2021-2032)
Table 18 North America Dried Berries Revenue (USD Million) By Application (2021-2032)
Table 19 North America Dried Berries Revenue (USD Million) By Product (2021-2032)
Table 20 Europe Dried Berries Revenue (USD Million) By Type (2021-2032)
Table 21 Europe Dried Berries Revenue (USD Million) By Application (2021-2032)
Table 22 Europe Dried Berries Revenue (USD Million) By Product (2021-2032)
Table 23 Asia Pacific Dried Berries Revenue (USD Million) By Type (2021-2032)
Table 24 Asia Pacific Dried Berries Revenue (USD Million) By Application (2021-2032)
Table 25 Asia Pacific Dried Berries Revenue (USD Million) By Product (2021-2032)
Table 26 South America Dried Berries Revenue (USD Million) By Type (2021-2032)
Table 27 South America Dried Berries Revenue (USD Million) By Application (2021-2032)
Table 28 South America Dried Berries Revenue (USD Million) By Product (2021-2032)
Table 29 Middle East and Africa Dried Berries Revenue (USD Million) By Type (2021-2032)
Table 30 Middle East and Africa Dried Berries Revenue (USD Million) By Application (2021-2032)
Table 31 Middle East and Africa Dried Berries Revenue (USD Million) By Product (2021-2032)
LIST OF FIGURES
Figure 1. Market Scope
Figure 2. Pricing Forecasts Per Unit, 2023- 2032
Figure 3. Porter’s Five Forces
Figure 4. Global Dried Berries Market Revenue (USD Million) By Regions (2021-2032)
Figure 5. Global Dried Berries Market Share (%) By Regions (2023)
Figure 6. North America Dried Berries Revenue (USD Million) By Country (2021-2032)
Figure 7. United States Dried Berries Revenue (USD Million) By Country (2021-2032)
Figure 8. Canada Dried Berries Revenue (USD Million) By Country (2021-2032)
Figure 9. Mexico Dried Berries Revenue (USD Million) By Country (2021-2032)
Figure 10. Europe Dried Berries Revenue (USD Million) By Country (2021-2032)
Figure 11. Germany Dried Berries Revenue (USD Million) By Country (2021-2032)
Figure 12. France Dried Berries Revenue (USD Million) By Country (2021-2032)
Figure 13. United Kingdom Dried Berries Revenue (USD Million) By Country (2021-2032)
Figure 14. Spain Dried Berries Revenue (USD Million) By Country (2021-2032)
Figure 15. Italy Dried Berries Revenue (USD Million) By Country (2021-2032)
Figure 16. Russia Dried Berries Revenue (USD Million) By Country (2021-2032)
Figure 17. Rest of Europe Dried Berries Revenue (USD Million) By Country (2021-2032)
Figure 11. Asia Pacific Dried Berries Revenue (USD Million) By Country (2021-2032)
Figure 12. China Dried Berries Revenue (USD Million) By Country (2021-2032)
Figure 13. Japan Dried Berries Revenue (USD Million) By Country (2021-2032)
Figure 14. India Dried Berries Revenue (USD Million) By Country (2021-2032)
Figure 15. South Korea Dried Berries Revenue (USD Million) By Country (2021-2032)
Figure 16. Australia Dried Berries Revenue (USD Million) By Country (2021-2032)
Figure 17. South East Asia Dried Berries Revenue (USD Million) By Country (2021-2032)
Figure 18. South America Dried Berries Revenue (USD Million) By Country (2021-2032)
Figure 19. Brazil Dried Berries Revenue (USD Million) By Country (2021-2032)
Figure 20. Argentina Dried Berries Revenue (USD Million) By Country (2021-2032)
Figure 21. Rest of Asia Pacific Dried Berries Revenue (USD Million) By Country (2021-2032)
Figure 22. Middle East and Africa Dried Berries Revenue (USD Million) By Region (2021-2032)
Figure 23. Saudi Arabia Dried Berries Revenue (USD Million) By Region (2021-2032)
Figure 24. The UAE Dried Berries Revenue (USD Million) By Region (2021-2032)
Figure 25. Rest of Middle East Dried Berries Revenue (USD Million) By Region (2021-2032)
Figure 26. South Africa Dried Berries Revenue (USD Million) By Region (2021-2032)
Figure 27. Africa Dried Berries Revenue (USD Million) By Region (2021-2032)
Figure 28. North America Dried Berries Revenue (USD Million) By Type (2021-2032)
Figure 29. North America Dried Berries Revenue (USD Million) By Application (2021-2032)
Figure 30. North America Dried Berries Revenue (USD Million) By Product (2021-2032)
Figure 31. Europe Dried Berries Revenue (USD Million) By Type (2021-2032)
Figure 32. Europe Dried Berries Revenue (USD Million) By Application (2021-2032)
Figure 33. Europe Dried Berries Revenue (USD Million) By Product (2021-2032)
Figure 34. Asia Pacific Dried Berries Revenue (USD Million) By Type (2021-2032)
Figure 35. Asia Pacific Dried Berries Revenue (USD Million) By Application (2021-2032)
Figure 36. Asia Pacific Dried Berries Revenue (USD Million) By Product (2021-2032)
Figure 37. South America Dried Berries Revenue (USD Million) By Type (2021-2032)
Figure 38. South America Dried Berries Revenue (USD Million) By Application (2021-2032)
Figure 39. South America Dried Berries Revenue (USD Million) By Product (2021-2032)
Figure 40. Middle East and Africa Dried Berries Revenue (USD Million) By Type (2021-2032)
Figure 41. Middle East and Africa Dried Berries Revenue (USD Million) By Application (2021-2032)
Figure 42. Middle East and Africa Dried Berries Revenue (USD Million) By Product (2021-2032)
By Product
Blueberries
Strawberries
Grapes
Others
By Application
Frozen desserts
Cereals & Snack bars
Bakery & confectionery
Others
Countries Analyzed
North America (US, Canada, Mexico)
Europe (Germany, UK, France, Spain, Italy, Russia, Rest of Europe)
Asia Pacific (China, India, Japan, South Korea, Australia, South East Asia, Rest of Asia)
South America (Brazil, Argentina, Rest of South America)
Middle East and Africa (Saudi Arabia, UAE, Rest of Middle East, South Africa, Egypt, Rest of Africa)
