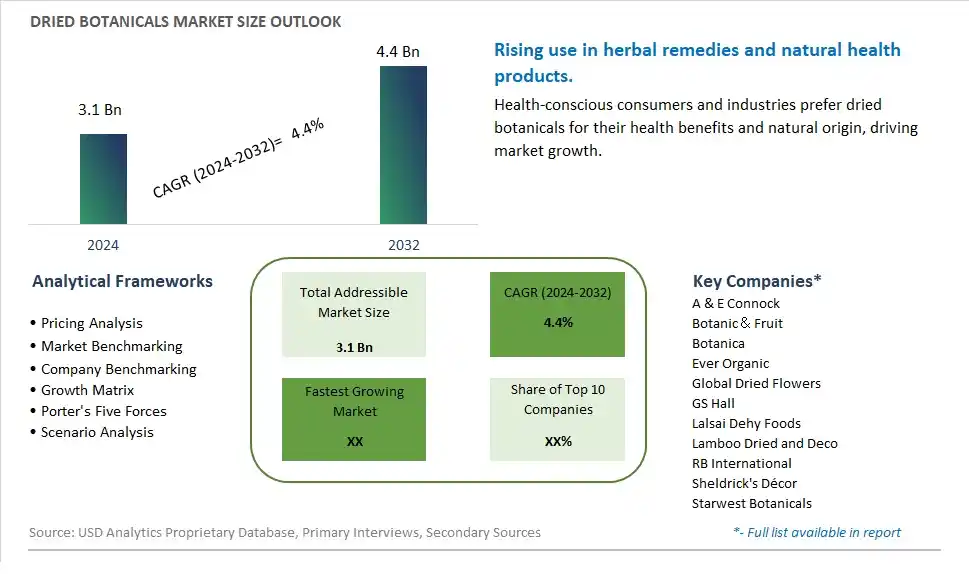
Global Dried Botanicals Market Size is valued at $3.1 Billion in 2024 and is forecast to register a growth rate (CAGR) of 4.4% to reach $4.4 Billion by 2032.
The global Dried Botanicals Market Comprehensive Study analyzes and forecasts the market size across 6 regions and 24 countries for diverse segments -By Type (Flowers, Leaves, Others), By Application (Household, Commercial)
An Introduction to Dried Botanicals Market
In 2024, the Dried Botanicals market is thriving, driven by the increasing use of these natural ingredients in various industries such as food and beverage, cosmetics, and pharmaceuticals. Dried botanicals, including herbs, flowers, and roots, are valued for their flavor, fragrance, and therapeutic properties. The market is benefiting from the rising consumer preference for natural and organic products, as well as the growing trend of herbal supplements and remedies. Innovations in drying techniques and sustainable sourcing practices are further enhancing the quality and availability of dried botanicals.
Dried Botanicals Competitive Landscape
The market report analyses the leading companies in the industry including A & E Connock, Botanic&Fruit, Botanica, Ever Organic, Global Dried Flowers, GS Hall, Lalsai Dehy Foods, Lamboo Dried and Deco, RB International, Sheldrick's Décor, Starwest Botanicals, and Others.
Dried Botanicals Market Dynamics
Dried Botanicals Market Trend: Growing Demand for Natural and Sustainable Ingredients
A prominent trend in the dried botanicals market is the growing demand for natural and sustainable ingredients. Consumers are increasingly seeking botanicals and herbs that are sourced ethically, have minimal processing, and offer therapeutic or functional benefits. This trend is driven by a shift towards holistic wellness, eco-conscious consumer behavior, and a preference for clean-label products. Dried botanicals, such as herbs, flowers, roots, and seeds, are gaining popularity as they are perceived as pure, authentic, and versatile ingredients used in various applications, including culinary, medicinal, cosmetic, and aromatherapy.
Dried Botanicals Market Driver: Rise in Health and Wellness Awareness
A key driver influencing the dried botanicals market is the rise in health and wellness awareness among consumers. There is a growing interest in natural remedies, herbal supplements, and plant-based ingredients that promote health, vitality, and overall well-being. The driver is fueled by concerns about synthetic chemicals, artificial additives, and the desire for products that align with holistic lifestyles. Dried botanicals are valued for their diverse health benefits, including antioxidant properties, immune support, stress relief, digestive health, and skin care benefits, driving their inclusion in dietary supplements, herbal teas, skincare products, and natural remedies.
Dried Botanicals Market Opportunity: Expansion into Functional Foods, Beverages, and Cosmetics
An opportunity in the dried botanicals market lies in expanding into functional foods, beverages, and cosmetics sectors. Manufacturers can capitalize on the trend towards natural and functional ingredients by incorporating dried botanicals into a wide range of products. There is an opportunity to develop herbal teas, infused beverages, botanical extracts for culinary applications, herbal supplements, natural cosmetics, and personal care products that leverage the therapeutic properties and sensory appeal of dried botanicals. Additionally, partnering with chefs, herbalists, nutritionists, and cosmetic formulators can facilitate the development of innovative and effective products that meet consumer demand for natural, sustainable, and health-enhancing botanical ingredients. Collaborating with certified organic growers and implementing sustainable sourcing practices can also enhance the market position of dried botanicals as premium and eco-friendly ingredients in various industries.
Dried Botanicals Market Share Analysis: Leaves segment generated the highest revenue share in the industry
Within the Dried Botanicals Market, Leaves emerge as the largest segment. Leaves encompass a wide variety of botanicals such as herbs, tea leaves, and medicinal plants, offering versatile applications across various industries including food and beverage, pharmaceuticals, cosmetics, and aromatherapy. Leaves are valued for their aromatic properties, flavors, and medicinal benefits, making them essential ingredients in teas, herbal supplements, skincare products, and culinary dishes. The demand for dried leaves is driven by their natural, plant-based origin, perceived health benefits, and increasing consumer preference for natural and organic products. As a result, leaves hold a significant share in the dried botanicals market due to their diverse uses and widespread popularity across different sectors.
Dried Botanicals Market Share Analysis: Commercial is the fastest growing segment over the forecast period to 2032
The Commercial Application segment stands out as the fastest-growing segment in the Dried Botanicals Market, showcasing significant expansion potential up to 2032. This growth is primarily fueled by the increasing demand from various industries such as food and beverage, pharmaceuticals, cosmetics, and aromatherapy. In the food and beverage sector, dried botanicals are used as natural flavor enhancers, herbal ingredients, and functional additives in a wide range of products including teas, beverages, sauces, and seasonings. Additionally, the pharmaceutical industry utilizes dried botanicals for herbal supplements, traditional medicine formulations, and natural remedies due to their therapeutic properties and health benefits. In the cosmetics industry, botanical extracts are incorporated into skincare, haircare, and personal care products for their nourishing, antioxidant, and anti-inflammatory properties. The growing awareness among consumers regarding the benefits of natural and plant-based ingredients further drives the demand for dried botanicals in commercial applications. This trend is expected to continue accelerating the growth of the commercial segment in the dried botanicals market over the forecast period.
Dried Botanicals Market Segmentation
By Type
Flowers
Leaves
Others
By Application
Household
Commercial
Countries Analyzed
North America (US, Canada, Mexico)
Europe (Germany, UK, France, Spain, Italy, Russia, Rest of Europe)
Asia Pacific (China, India, Japan, South Korea, Australia, South East Asia, Rest of Asia)
South America (Brazil, Argentina, Rest of South America)
Middle East and Africa (Saudi Arabia, UAE, Rest of Middle East, South Africa, Egypt, Rest of Africa)
Dried Botanicals Companies Profiled in the Study
A & E Connock
Botanic&Fruit
Botanica
Ever Organic
Global Dried Flowers
GS Hall
Lalsai Dehy Foods
Lamboo Dried and Deco
RB International
Sheldrick's Décor
Starwest Botanicals
*- List Not Exhaustive
Chapter 1. TABLE OF CONTENTS
Chapter 2. Introduction to Dried Botanicals Market
2.1. Market Overview
2.2. Key Statistics and Report Highlights
2.3. Scope of the Comprehensive Study
2.3.1. Market Definition
2.3.2 Countries and Regions Covered
2.3.3 Research Objective
2.3.4 Units, Currency, and Conversions
2.3.5 Industry Value Chain
2.4. Key Market Segments
2.5. Key Companies
2.6. Study Period
Chapter 3. Strategic Analysis Review
3.1. Dried Botanicals Pricing Analysis and Forecast
3.2. Porter’s Five Forces
3.3. Market Ecosystem
3.4. SWOT Analysis
3.5. Regulatory Scenario
3.3. Effects of Inflation, Russia-Ukraine War, moderating economic growth, and other macroeconomic factors
Chapter 4. Competitive Landscape
4.1. Market Share Analysis
4.1.1. Global Dried Botanicals Market Share by Company, 2023
4.1.2. Product Offerings of Leading Dried Botanicals Companies
4.2. Market Entropy
4.2.1. New Product Launches in the Industry
4.2.2. Mergers, Acquisitions, Joint ventures, and Partnerships
4.3. Key Strategies and Best Practices
Chapter 5. Global Market Projections: Best, Reference, and Low Case Scenarios
5.1. Growth Analysis- Case Scenario Definitions
5.2. Low Growth Case Scenario Forecasts
5.3. Reference Growth Case Scenario Forecasts
5.4. High Growth Case Scenario Forecasts
Chapter 6. Market Dynamics
6.1. Dried Botanicals Market Drivers
6.2. Dried Botanicals Market Challenges
6.6. Dried Botanicals Market Opportunities
6.4. Dried Botanicals Market Trends
Chapter 7. Global Dried Botanicals Market Outlook Trends
7.1. Global Dried Botanicals Revenue (USD Million) and CAGR (%) by Type (2021-2032)
7.2. Global Dried Botanicals Revenue (USD Million) and CAGR (%) by Application (2021-2032)
7.3. Global Dried Botanicals Revenue (USD Million) and CAGR (%) by Product (2021-2032)
By Type
Flowers
Leaves
Others
By Application
Household
Commercial
Chapter 8. Global Dried Botanicals Regional Analysis and Outlook
8.1. Global Dried Botanicals Revenue (USD Million) By Regions (2021- 2032)
8.2. North America Dried Botanicals Revenue (USD Million) by Country (2021-2032)
8.2.1. United States Dried Botanicals Regional Analysis and Outlook
8.2.2. Canada Dried Botanicals Regional Analysis and Outlook
8.2.3. Mexico Dried Botanicals Regional Analysis and Outlook
8.3. Europe Dried Botanicals Revenue (USD Million), by Country (2021-2032)
8.3.1. Germany Dried Botanicals Regional Analysis and Outlook
8.3.2. France Dried Botanicals Regional Analysis and Outlook
8.3.3. United Kingdom Dried Botanicals Regional Analysis and Outlook
8.3.4. Spain Dried Botanicals Regional Analysis and Outlook
8.3.5. Italy Dried Botanicals Regional Analysis and Outlook
8.3.6. Russia Dried Botanicals Regional Analysis and Outlook
8.3.7. Rest of Europe Dried Botanicals Regional Analysis and Outlook
8.4. Asia Pacific Dried Botanicals Revenue (USD Million) by Country (2021-2032)
8.4.1. China Dried Botanicals Regional Analysis and Outlook
8.4.2. Japan Dried Botanicals Regional Analysis and Outlook
8.4.3. India Dried Botanicals Regional Analysis and Outlook
8.4.4. South Korea Dried Botanicals Regional Analysis and Outlook
8.4.5. Australia Dried Botanicals Regional Analysis and Outlook
8.4.6. South East Asia Dried Botanicals Regional Analysis and Outlook
8.4.7. Rest of Asia Pacific Dried Botanicals Regional Analysis and Outlook
8.5. South America Dried Botanicals Revenue (USD Million), by Country (2021-2032)
8.5.1. Brazil Dried Botanicals Regional Analysis and Outlook
8.5.2. Argentina Dried Botanicals Regional Analysis and Outlook
8.5.3. Rest of South America Dried Botanicals Regional Analysis and Outlook
8.6. Middle East and Africa Dried Botanicals Revenue (USD Million) by Country (2021-2032)
8.6.1. Middle East Dried Botanicals Regional Analysis and Outlook
8.6.2. Africa Dried Botanicals Regional Analysis and Outlook
Chapter 9. North America Dried Botanicals Analysis and Outlook
9.1. North America Dried Botanicals Revenue (USD Million) by Segments (2021-2032)
9.1.1. North America Dried Botanicals Revenue (USD Million) by Type (2021-2032)
9.1.2. North America Dried Botanicals Revenue (USD Million) by Application (2021-2032)
9.1.3. North America Dried Botanicals Revenue (USD Million) by Product (2021-2032)
By Type
Flowers
Leaves
Others
By Application
Household
Commercial
Chapter 10. Europe Dried Botanicals Analysis and Outlook
10.1. Europe Dried Botanicals Revenue (USD Million), by Segments (USD Million) (2021-2032)
10.1.1. Europe Dried Botanicals Revenue (USD Million) by Type (2021-2032)
10.1.2. Europe Dried Botanicals Revenue (USD Million) by Application (2021-2032)
10.1.3. Europe Dried Botanicals Revenue (USD Million) by Product (2021-2032)
By Type
Flowers
Leaves
Others
By Application
Household
Commercial
Chapter 11. Asia Pacific Dried Botanicals Analysis and Outlook
11.1. Asia Pacific Dried Botanicals Revenue (USD Million), and Revenue (USD Million) by Segments (2021-2032)
11.1.1. Asia Pacific Dried Botanicals Revenue (USD Million) by Type (2021-2032)
11.1.2. Asia Pacific Dried Botanicals Revenue (USD Million) by Application (2021-2032)
11.1.3. Asia Pacific Dried Botanicals Revenue (USD Million) by Product (2021-2032)
By Type
Flowers
Leaves
Others
By Application
Household
Commercial
Chapter 12. South America Dried Botanicals Analysis and Outlook
12.1. South America Dried Botanicals Revenue (USD Million), by Segments (2021-2032)
12.1.1. South America Dried Botanicals Revenue (USD Million) by Type (2021-2032)
12.1.2. South America Dried Botanicals Revenue (USD Million) by Application (2021-2032)
12.1.3. South America Dried Botanicals Revenue (USD Million) by Product (2021-2032)
By Type
Flowers
Leaves
Others
By Application
Household
Commercial
Chapter 13. Middle East and Africa Dried Botanicals Analysis and Outlook
13.1. Middle East and Africa Dried Botanicals Revenue (USD Million), by Segments (2021-2032)
13.1.1. Middle East and Africa Dried Botanicals Revenue (USD Million) by Type (2021-2032)
13.1.2. Middle East and Africa Dried Botanicals Revenue (USD Million) by Application (2021-2032)
13.1.3. Middle East and Africa Dried Botanicals Revenue (USD Million) by Product (2021-2032)
By Type
Flowers
Leaves
Others
By Application
Household
Commercial
Chapter 14. Dried Botanicals Company Profiles
14.1 Business Overview
14.2 Product Profiles
14.3 SWOT Profiles
14.5 Recent Developments
14.6 Financial Profile
List of Companies
A & E Connock
Botanic&Fruit
Botanica
Ever Organic
Global Dried Flowers
GS Hall
Lalsai Dehy Foods
Lamboo Dried and Deco
RB International
Sheldrick's Décor
Starwest Botanicals
15. Methodology and Data Sources
15.1 Customization Offerings
15.2 Subscription Services
15.3 Related Reports
15.4 Publisher Expertise
LIST OF TABLES
Table 1 Market Segmentation Analysis
Table 2 Global Dried Botanicals Market Share of Leading Companies, 2023
Table 3 Product Offerings of Leading Companies
Table 4 Low Growth Scenario Forecasts
Table 5 Reference Case Growth Scenario
Table 6 High Growth Case Scenario
Table 7 Global Dried Botanicals Revenue (USD Million) And CAGR (%) By Type (2021-2032)
Table 8 Global Dried Botanicals Revenue (USD Million) And CAGR (%) By Application (2021-2032)
Table 9 Global Dried Botanicals Revenue (USD Million) And CAGR (%) By Product (2021-2032)
Table 10 Global Dried Botanicals Market Revenue (USD Million) By Regions (2021-2032)
Table 11 Global Dried Botanicals Market Share (%) By Regions (2021-2032)
Table 12 North America Dried Botanicals Revenue (USD Million) By Country (2021-2032)
Table 13 Europe Dried Botanicals Revenue (USD Million) By Country (2021-2032)
Table 14 Asia Pacific Dried Botanicals Revenue (USD Million) By Country (2021-2032)
Table 15 South America Dried Botanicals Revenue (USD Million) By Country (2021-2032)
Table 16 Middle East and Africa Dried Botanicals Revenue (USD Million) By Region (2021-2032)
Table 17 North America Dried Botanicals Revenue (USD Million) By Type (2021-2032)
Table 18 North America Dried Botanicals Revenue (USD Million) By Application (2021-2032)
Table 19 North America Dried Botanicals Revenue (USD Million) By Product (2021-2032)
Table 20 Europe Dried Botanicals Revenue (USD Million) By Type (2021-2032)
Table 21 Europe Dried Botanicals Revenue (USD Million) By Application (2021-2032)
Table 22 Europe Dried Botanicals Revenue (USD Million) By Product (2021-2032)
Table 23 Asia Pacific Dried Botanicals Revenue (USD Million) By Type (2021-2032)
Table 24 Asia Pacific Dried Botanicals Revenue (USD Million) By Application (2021-2032)
Table 25 Asia Pacific Dried Botanicals Revenue (USD Million) By Product (2021-2032)
Table 26 South America Dried Botanicals Revenue (USD Million) By Type (2021-2032)
Table 27 South America Dried Botanicals Revenue (USD Million) By Application (2021-2032)
Table 28 South America Dried Botanicals Revenue (USD Million) By Product (2021-2032)
Table 29 Middle East and Africa Dried Botanicals Revenue (USD Million) By Type (2021-2032)
Table 30 Middle East and Africa Dried Botanicals Revenue (USD Million) By Application (2021-2032)
Table 31 Middle East and Africa Dried Botanicals Revenue (USD Million) By Product (2021-2032)
LIST OF FIGURES
Figure 1. Market Scope
Figure 2. Pricing Forecasts Per Unit, 2023- 2032
Figure 3. Porter’s Five Forces
Figure 4. Global Dried Botanicals Market Revenue (USD Million) By Regions (2021-2032)
Figure 5. Global Dried Botanicals Market Share (%) By Regions (2023)
Figure 6. North America Dried Botanicals Revenue (USD Million) By Country (2021-2032)
Figure 7. United States Dried Botanicals Revenue (USD Million) By Country (2021-2032)
Figure 8. Canada Dried Botanicals Revenue (USD Million) By Country (2021-2032)
Figure 9. Mexico Dried Botanicals Revenue (USD Million) By Country (2021-2032)
Figure 10. Europe Dried Botanicals Revenue (USD Million) By Country (2021-2032)
Figure 11. Germany Dried Botanicals Revenue (USD Million) By Country (2021-2032)
Figure 12. France Dried Botanicals Revenue (USD Million) By Country (2021-2032)
Figure 13. United Kingdom Dried Botanicals Revenue (USD Million) By Country (2021-2032)
Figure 14. Spain Dried Botanicals Revenue (USD Million) By Country (2021-2032)
Figure 15. Italy Dried Botanicals Revenue (USD Million) By Country (2021-2032)
Figure 16. Russia Dried Botanicals Revenue (USD Million) By Country (2021-2032)
Figure 17. Rest of Europe Dried Botanicals Revenue (USD Million) By Country (2021-2032)
Figure 11. Asia Pacific Dried Botanicals Revenue (USD Million) By Country (2021-2032)
Figure 12. China Dried Botanicals Revenue (USD Million) By Country (2021-2032)
Figure 13. Japan Dried Botanicals Revenue (USD Million) By Country (2021-2032)
Figure 14. India Dried Botanicals Revenue (USD Million) By Country (2021-2032)
Figure 15. South Korea Dried Botanicals Revenue (USD Million) By Country (2021-2032)
Figure 16. Australia Dried Botanicals Revenue (USD Million) By Country (2021-2032)
Figure 17. South East Asia Dried Botanicals Revenue (USD Million) By Country (2021-2032)
Figure 18. South America Dried Botanicals Revenue (USD Million) By Country (2021-2032)
Figure 19. Brazil Dried Botanicals Revenue (USD Million) By Country (2021-2032)
Figure 20. Argentina Dried Botanicals Revenue (USD Million) By Country (2021-2032)
Figure 21. Rest of Asia Pacific Dried Botanicals Revenue (USD Million) By Country (2021-2032)
Figure 22. Middle East and Africa Dried Botanicals Revenue (USD Million) By Region (2021-2032)
Figure 23. Saudi Arabia Dried Botanicals Revenue (USD Million) By Region (2021-2032)
Figure 24. The UAE Dried Botanicals Revenue (USD Million) By Region (2021-2032)
Figure 25. Rest of Middle East Dried Botanicals Revenue (USD Million) By Region (2021-2032)
Figure 26. South Africa Dried Botanicals Revenue (USD Million) By Region (2021-2032)
Figure 27. Africa Dried Botanicals Revenue (USD Million) By Region (2021-2032)
Figure 28. North America Dried Botanicals Revenue (USD Million) By Type (2021-2032)
Figure 29. North America Dried Botanicals Revenue (USD Million) By Application (2021-2032)
Figure 30. North America Dried Botanicals Revenue (USD Million) By Product (2021-2032)
Figure 31. Europe Dried Botanicals Revenue (USD Million) By Type (2021-2032)
Figure 32. Europe Dried Botanicals Revenue (USD Million) By Application (2021-2032)
Figure 33. Europe Dried Botanicals Revenue (USD Million) By Product (2021-2032)
Figure 34. Asia Pacific Dried Botanicals Revenue (USD Million) By Type (2021-2032)
Figure 35. Asia Pacific Dried Botanicals Revenue (USD Million) By Application (2021-2032)
Figure 36. Asia Pacific Dried Botanicals Revenue (USD Million) By Product (2021-2032)
Figure 37. South America Dried Botanicals Revenue (USD Million) By Type (2021-2032)
Figure 38. South America Dried Botanicals Revenue (USD Million) By Application (2021-2032)
Figure 39. South America Dried Botanicals Revenue (USD Million) By Product (2021-2032)
Figure 40. Middle East and Africa Dried Botanicals Revenue (USD Million) By Type (2021-2032)
Figure 41. Middle East and Africa Dried Botanicals Revenue (USD Million) By Application (2021-2032)
Figure 42. Middle East and Africa Dried Botanicals Revenue (USD Million) By Product (2021-2032)
By Type
Flowers
Leaves
Others
By Application
Household
Commercial
Countries Analyzed
North America (US, Canada, Mexico)
Europe (Germany, UK, France, Spain, Italy, Russia, Rest of Europe)
Asia Pacific (China, India, Japan, South Korea, Australia, South East Asia, Rest of Asia)
South America (Brazil, Argentina, Rest of South America)
Middle East and Africa (Saudi Arabia, UAE, Rest of Middle East, South Africa, Egypt, Rest of Africa)
