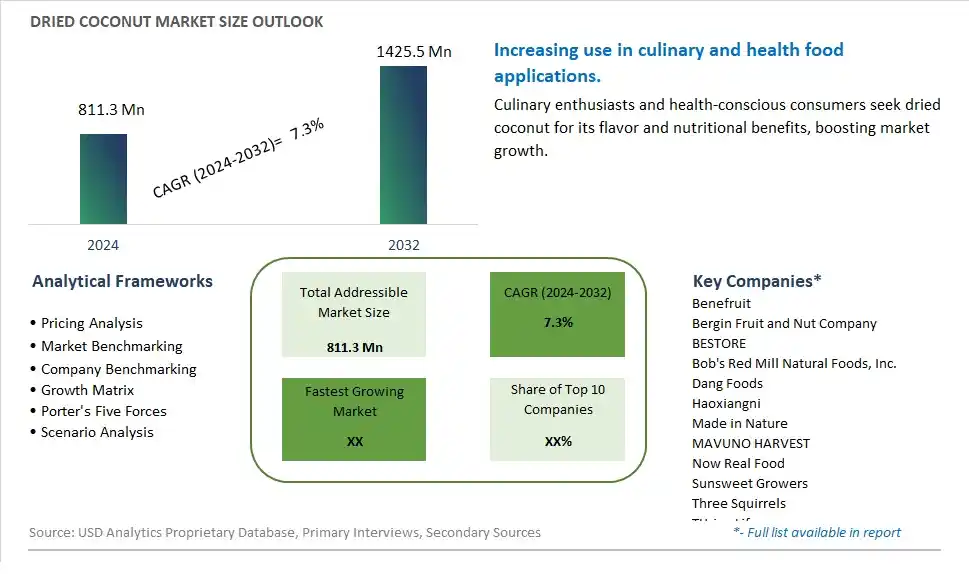
Global Dried Coconut Market Size is valued at $811.3 Million in 2024 and is forecast to register a growth rate (CAGR) of 7.3% to reach $1425.5 Million by 2032.
The global Dried Coconut Market Comprehensive Study analyzes and forecasts the market size across 6 regions and 24 countries for diverse segments -By Type (Unsweetened, Lightly Sweetened, Sweetened), By Application (Direct Consumption, Cakes and Bakery, Candy and Snacks, Others)
An Introduction to Dried Coconut Market
The Dried Coconut market in 2024 is experiencing significant growth, fueled by its wide application in the food and beverage, cosmetics, and pharmaceutical industries. Dried coconut products, including flakes, chips, and shredded coconut, are valued for their nutritional benefits and versatile use in cooking and baking. The market is driven by the rising demand for natural and organic ingredients, as well as the increasing popularity of plant-based diets. Additionally, the growing trend of healthy snacking and the use of coconut in functional foods and beverages are boosting market growth.
Dried Coconut Competitive Landscape
The market report analyses the leading companies in the industry including Benefruit, Bergin Fruit and Nut Company, BESTORE, Bob's Red Mill Natural Foods, Inc., Dang Foods, Haoxiangni, Made in Nature, MAVUNO HARVEST, Now Real Food, Sunsweet Growers, Three Squirrels, THrive Life, WEL-B, Wildly Organic, and Others.
Dried Coconut Market Dynamics
Dried Coconut Market Trend: Increasing Popularity of Coconut-Based Products
A prominent trend in the dried coconut market is the increasing popularity of coconut-based products. Consumers are embracing the diverse uses and health benefits of coconut, leading to a surge in demand for dried coconut in various forms such as flakes, chips, and shredded coconut. This trend is driven by the growing interest in plant-based foods, the perceived health advantages of coconut, and its versatile applications in cooking, baking, snacking, and as a topping or ingredient in various dishes and beverages.
Dried Coconut Market Driver: Rise in Demand for Healthy and Natural Ingredients
A key driver influencing the dried coconut market is the rise in demand for healthy and natural ingredients. Consumers are actively seeking alternatives to processed and artificial ingredients, preferring natural and minimally processed options in their diets. Dried coconut aligns with this driver as it is perceived as a nutritious and wholesome ingredient, rich in healthy fats, fiber, and essential nutrients. The driver is fueled by health-conscious consumer behavior, dietary preferences for clean-label foods, and the desire for products that offer both taste and nutritional value.
Dried Coconut Market Opportunity: Innovation in Coconut-Based Snacks and Desserts
An opportunity in the dried coconut market lies in innovation in coconut-based snacks and desserts. Manufacturers can capitalize on the trend towards coconut as a healthy and flavorful ingredient by developing a variety of coconut-based snack products such as coconut clusters, energy bars, granola mixes, and trail mixes. There is also an opportunity to create innovative coconut dessert options like coconut macaroons, coconut cookies, coconut yogurt, and coconut-based ice creams or sorbets. Additionally, exploring new packaging formats, flavors, and texture variations can enhance the appeal and marketability of dried coconut products, catering to diverse consumer preferences and expanding the market reach of coconut as a popular ingredient in the snacking and dessert categories. Collaborating with chefs, food scientists, and nutrition experts can support the development of innovative and appealing coconut-based snack and dessert offerings that meet the evolving needs and tastes of consumers.
Dried Coconut Market Share Analysis: Unsweetened Dried Coconut segment generated the highest revenue share in the industry
The largest segment in the Dried Coconut Market is Unsweetened Dried Coconut. This segment exhibits a robust growth trajectory driven by several key factors. Firstly, the growing health consciousness among consumers has led to an increased preference for natural and unprocessed food products, including unsweetened dried coconut. Health-conscious individuals often choose unsweetened options to avoid added sugars and artificial sweeteners, making unsweetened dried coconut a popular choice. Further, the versatility of unsweetened dried coconut in culinary applications contributes to its market dominance. It is used in a wide range of dishes, including curries, desserts, baked goods, and snacks, adding a rich coconut flavor and texture. Additionally, the demand for gluten-free, vegan, and paleo-friendly ingredients has further boosted the popularity of unsweetened dried coconut, as it aligns with these dietary preferences. The combination of health benefits, culinary versatility, and alignment with dietary trends positions the Unsweetened Dried Coconut segment as the largest and fastest-growing segment in the Dried Coconut Market.
Dried Coconut Market Share Analysis: Cakes and Bakery is the fastest growing segment over the forecast period to 2032
The fastest-growing segment in the Dried Coconut Market is Dried Coconut in Cakes and Bakery applications. This segment is experiencing rapid growth due to several factors driving consumer preferences and market trends. Firstly, there is a growing demand for healthier baked goods and desserts that incorporate natural and nutritious ingredients, such as dried coconut. Consumers are increasingly seeking out products that offer both indulgence and health benefits, and dried coconut provides a unique flavor and texture to cakes, pastries, and other bakery items. Further, the rising popularity of tropical and exotic flavors in the food industry has boosted the use of dried coconut in cakes and bakery products, as it adds a delightful tropical twist to traditional recipes. Additionally, the versatility of dried coconut allows for innovative product development, including gluten-free, vegan, and paleo-friendly options, catering to a wider consumer base. The combination of health consciousness, flavor trends, and product innovation makes Dried Coconut in Cakes and Bakery the fastest-growing segment in the Dried Coconut Market, poised for significant expansion by 2032.
Dried Coconut Market Segmentation
By Type
Unsweetened
Lightly Sweetened
Sweetened
By Application
Direct Consumption
Cakes and Bakery
Candy and Snacks
Others
Countries Analyzed
North America (US, Canada, Mexico)
Europe (Germany, UK, France, Spain, Italy, Russia, Rest of Europe)
Asia Pacific (China, India, Japan, South Korea, Australia, South East Asia, Rest of Asia)
South America (Brazil, Argentina, Rest of South America)
Middle East and Africa (Saudi Arabia, UAE, Rest of Middle East, South Africa, Egypt, Rest of Africa)
Dried Coconut Companies Profiled in the Study
Benefruit
Bergin Fruit and Nut Company
BESTORE
Bob's Red Mill Natural Foods, Inc.
Dang Foods
Haoxiangni
Made in Nature
MAVUNO HARVEST
Now Real Food
Sunsweet Growers
Three Squirrels
THrive Life
WEL-B
Wildly Organic
*- List Not Exhaustive
Chapter 1. TABLE OF CONTENTS
Chapter 2. Introduction to Dried Coconut Market
2.1. Market Overview
2.2. Key Statistics and Report Highlights
2.3. Scope of the Comprehensive Study
2.3.1. Market Definition
2.3.2 Countries and Regions Covered
2.3.3 Research Objective
2.3.4 Units, Currency, and Conversions
2.3.5 Industry Value Chain
2.4. Key Market Segments
2.5. Key Companies
2.6. Study Period
Chapter 3. Strategic Analysis Review
3.1. Dried Coconut Pricing Analysis and Forecast
3.2. Porter’s Five Forces
3.3. Market Ecosystem
3.4. SWOT Analysis
3.5. Regulatory Scenario
3.3. Effects of Inflation, Russia-Ukraine War, moderating economic growth, and other macroeconomic factors
Chapter 4. Competitive Landscape
4.1. Market Share Analysis
4.1.1. Global Dried Coconut Market Share by Company, 2023
4.1.2. Product Offerings of Leading Dried Coconut Companies
4.2. Market Entropy
4.2.1. New Product Launches in the Industry
4.2.2. Mergers, Acquisitions, Joint ventures, and Partnerships
4.3. Key Strategies and Best Practices
Chapter 5. Global Market Projections: Best, Reference, and Low Case Scenarios
5.1. Growth Analysis- Case Scenario Definitions
5.2. Low Growth Case Scenario Forecasts
5.3. Reference Growth Case Scenario Forecasts
5.4. High Growth Case Scenario Forecasts
Chapter 6. Market Dynamics
6.1. Dried Coconut Market Drivers
6.2. Dried Coconut Market Challenges
6.6. Dried Coconut Market Opportunities
6.4. Dried Coconut Market Trends
Chapter 7. Global Dried Coconut Market Outlook Trends
7.1. Global Dried Coconut Revenue (USD Million) and CAGR (%) by Type (2021-2032)
7.2. Global Dried Coconut Revenue (USD Million) and CAGR (%) by Application (2021-2032)
7.3. Global Dried Coconut Revenue (USD Million) and CAGR (%) by Product (2021-2032)
By Type
Unsweetened
Lightly Sweetened
Sweetened
By Application
Direct Consumption
Cakes and Bakery
Candy and Snacks
Others
Chapter 8. Global Dried Coconut Regional Analysis and Outlook
8.1. Global Dried Coconut Revenue (USD Million) By Regions (2021- 2032)
8.2. North America Dried Coconut Revenue (USD Million) by Country (2021-2032)
8.2.1. United States Dried Coconut Regional Analysis and Outlook
8.2.2. Canada Dried Coconut Regional Analysis and Outlook
8.2.3. Mexico Dried Coconut Regional Analysis and Outlook
8.3. Europe Dried Coconut Revenue (USD Million), by Country (2021-2032)
8.3.1. Germany Dried Coconut Regional Analysis and Outlook
8.3.2. France Dried Coconut Regional Analysis and Outlook
8.3.3. United Kingdom Dried Coconut Regional Analysis and Outlook
8.3.4. Spain Dried Coconut Regional Analysis and Outlook
8.3.5. Italy Dried Coconut Regional Analysis and Outlook
8.3.6. Russia Dried Coconut Regional Analysis and Outlook
8.3.7. Rest of Europe Dried Coconut Regional Analysis and Outlook
8.4. Asia Pacific Dried Coconut Revenue (USD Million) by Country (2021-2032)
8.4.1. China Dried Coconut Regional Analysis and Outlook
8.4.2. Japan Dried Coconut Regional Analysis and Outlook
8.4.3. India Dried Coconut Regional Analysis and Outlook
8.4.4. South Korea Dried Coconut Regional Analysis and Outlook
8.4.5. Australia Dried Coconut Regional Analysis and Outlook
8.4.6. South East Asia Dried Coconut Regional Analysis and Outlook
8.4.7. Rest of Asia Pacific Dried Coconut Regional Analysis and Outlook
8.5. South America Dried Coconut Revenue (USD Million), by Country (2021-2032)
8.5.1. Brazil Dried Coconut Regional Analysis and Outlook
8.5.2. Argentina Dried Coconut Regional Analysis and Outlook
8.5.3. Rest of South America Dried Coconut Regional Analysis and Outlook
8.6. Middle East and Africa Dried Coconut Revenue (USD Million) by Country (2021-2032)
8.6.1. Middle East Dried Coconut Regional Analysis and Outlook
8.6.2. Africa Dried Coconut Regional Analysis and Outlook
Chapter 9. North America Dried Coconut Analysis and Outlook
9.1. North America Dried Coconut Revenue (USD Million) by Segments (2021-2032)
9.1.1. North America Dried Coconut Revenue (USD Million) by Type (2021-2032)
9.1.2. North America Dried Coconut Revenue (USD Million) by Application (2021-2032)
9.1.3. North America Dried Coconut Revenue (USD Million) by Product (2021-2032)
By Type
Unsweetened
Lightly Sweetened
Sweetened
By Application
Direct Consumption
Cakes and Bakery
Candy and Snacks
Others
Chapter 10. Europe Dried Coconut Analysis and Outlook
10.1. Europe Dried Coconut Revenue (USD Million), by Segments (USD Million) (2021-2032)
10.1.1. Europe Dried Coconut Revenue (USD Million) by Type (2021-2032)
10.1.2. Europe Dried Coconut Revenue (USD Million) by Application (2021-2032)
10.1.3. Europe Dried Coconut Revenue (USD Million) by Product (2021-2032)
By Type
Unsweetened
Lightly Sweetened
Sweetened
By Application
Direct Consumption
Cakes and Bakery
Candy and Snacks
Others
Chapter 11. Asia Pacific Dried Coconut Analysis and Outlook
11.1. Asia Pacific Dried Coconut Revenue (USD Million), and Revenue (USD Million) by Segments (2021-2032)
11.1.1. Asia Pacific Dried Coconut Revenue (USD Million) by Type (2021-2032)
11.1.2. Asia Pacific Dried Coconut Revenue (USD Million) by Application (2021-2032)
11.1.3. Asia Pacific Dried Coconut Revenue (USD Million) by Product (2021-2032)
By Type
Unsweetened
Lightly Sweetened
Sweetened
By Application
Direct Consumption
Cakes and Bakery
Candy and Snacks
Others
Chapter 12. South America Dried Coconut Analysis and Outlook
12.1. South America Dried Coconut Revenue (USD Million), by Segments (2021-2032)
12.1.1. South America Dried Coconut Revenue (USD Million) by Type (2021-2032)
12.1.2. South America Dried Coconut Revenue (USD Million) by Application (2021-2032)
12.1.3. South America Dried Coconut Revenue (USD Million) by Product (2021-2032)
By Type
Unsweetened
Lightly Sweetened
Sweetened
By Application
Direct Consumption
Cakes and Bakery
Candy and Snacks
Others
Chapter 13. Middle East and Africa Dried Coconut Analysis and Outlook
13.1. Middle East and Africa Dried Coconut Revenue (USD Million), by Segments (2021-2032)
13.1.1. Middle East and Africa Dried Coconut Revenue (USD Million) by Type (2021-2032)
13.1.2. Middle East and Africa Dried Coconut Revenue (USD Million) by Application (2021-2032)
13.1.3. Middle East and Africa Dried Coconut Revenue (USD Million) by Product (2021-2032)
By Type
Unsweetened
Lightly Sweetened
Sweetened
By Application
Direct Consumption
Cakes and Bakery
Candy and Snacks
Others
Chapter 14. Dried Coconut Company Profiles
14.1 Business Overview
14.2 Product Profiles
14.3 SWOT Profiles
14.5 Recent Developments
14.6 Financial Profile
List of Companies
Benefruit
Bergin Fruit and Nut Company
BESTORE
Bob's Red Mill Natural Foods, Inc.
Dang Foods
Haoxiangni
Made in Nature
MAVUNO HARVEST
Now Real Food
Sunsweet Growers
Three Squirrels
THrive Life
WEL-B
Wildly Organic
15. Methodology and Data Sources
15.1 Customization Offerings
15.2 Subscription Services
15.3 Related Reports
15.4 Publisher Expertise
LIST OF TABLES
Table 1 Market Segmentation Analysis
Table 2 Global Dried Coconut Market Share of Leading Companies, 2023
Table 3 Product Offerings of Leading Companies
Table 4 Low Growth Scenario Forecasts
Table 5 Reference Case Growth Scenario
Table 6 High Growth Case Scenario
Table 7 Global Dried Coconut Revenue (USD Million) And CAGR (%) By Type (2021-2032)
Table 8 Global Dried Coconut Revenue (USD Million) And CAGR (%) By Application (2021-2032)
Table 9 Global Dried Coconut Revenue (USD Million) And CAGR (%) By Product (2021-2032)
Table 10 Global Dried Coconut Market Revenue (USD Million) By Regions (2021-2032)
Table 11 Global Dried Coconut Market Share (%) By Regions (2021-2032)
Table 12 North America Dried Coconut Revenue (USD Million) By Country (2021-2032)
Table 13 Europe Dried Coconut Revenue (USD Million) By Country (2021-2032)
Table 14 Asia Pacific Dried Coconut Revenue (USD Million) By Country (2021-2032)
Table 15 South America Dried Coconut Revenue (USD Million) By Country (2021-2032)
Table 16 Middle East and Africa Dried Coconut Revenue (USD Million) By Region (2021-2032)
Table 17 North America Dried Coconut Revenue (USD Million) By Type (2021-2032)
Table 18 North America Dried Coconut Revenue (USD Million) By Application (2021-2032)
Table 19 North America Dried Coconut Revenue (USD Million) By Product (2021-2032)
Table 20 Europe Dried Coconut Revenue (USD Million) By Type (2021-2032)
Table 21 Europe Dried Coconut Revenue (USD Million) By Application (2021-2032)
Table 22 Europe Dried Coconut Revenue (USD Million) By Product (2021-2032)
Table 23 Asia Pacific Dried Coconut Revenue (USD Million) By Type (2021-2032)
Table 24 Asia Pacific Dried Coconut Revenue (USD Million) By Application (2021-2032)
Table 25 Asia Pacific Dried Coconut Revenue (USD Million) By Product (2021-2032)
Table 26 South America Dried Coconut Revenue (USD Million) By Type (2021-2032)
Table 27 South America Dried Coconut Revenue (USD Million) By Application (2021-2032)
Table 28 South America Dried Coconut Revenue (USD Million) By Product (2021-2032)
Table 29 Middle East and Africa Dried Coconut Revenue (USD Million) By Type (2021-2032)
Table 30 Middle East and Africa Dried Coconut Revenue (USD Million) By Application (2021-2032)
Table 31 Middle East and Africa Dried Coconut Revenue (USD Million) By Product (2021-2032)
LIST OF FIGURES
Figure 1. Market Scope
Figure 2. Pricing Forecasts Per Unit, 2023- 2032
Figure 3. Porter’s Five Forces
Figure 4. Global Dried Coconut Market Revenue (USD Million) By Regions (2021-2032)
Figure 5. Global Dried Coconut Market Share (%) By Regions (2023)
Figure 6. North America Dried Coconut Revenue (USD Million) By Country (2021-2032)
Figure 7. United States Dried Coconut Revenue (USD Million) By Country (2021-2032)
Figure 8. Canada Dried Coconut Revenue (USD Million) By Country (2021-2032)
Figure 9. Mexico Dried Coconut Revenue (USD Million) By Country (2021-2032)
Figure 10. Europe Dried Coconut Revenue (USD Million) By Country (2021-2032)
Figure 11. Germany Dried Coconut Revenue (USD Million) By Country (2021-2032)
Figure 12. France Dried Coconut Revenue (USD Million) By Country (2021-2032)
Figure 13. United Kingdom Dried Coconut Revenue (USD Million) By Country (2021-2032)
Figure 14. Spain Dried Coconut Revenue (USD Million) By Country (2021-2032)
Figure 15. Italy Dried Coconut Revenue (USD Million) By Country (2021-2032)
Figure 16. Russia Dried Coconut Revenue (USD Million) By Country (2021-2032)
Figure 17. Rest of Europe Dried Coconut Revenue (USD Million) By Country (2021-2032)
Figure 11. Asia Pacific Dried Coconut Revenue (USD Million) By Country (2021-2032)
Figure 12. China Dried Coconut Revenue (USD Million) By Country (2021-2032)
Figure 13. Japan Dried Coconut Revenue (USD Million) By Country (2021-2032)
Figure 14. India Dried Coconut Revenue (USD Million) By Country (2021-2032)
Figure 15. South Korea Dried Coconut Revenue (USD Million) By Country (2021-2032)
Figure 16. Australia Dried Coconut Revenue (USD Million) By Country (2021-2032)
Figure 17. South East Asia Dried Coconut Revenue (USD Million) By Country (2021-2032)
Figure 18. South America Dried Coconut Revenue (USD Million) By Country (2021-2032)
Figure 19. Brazil Dried Coconut Revenue (USD Million) By Country (2021-2032)
Figure 20. Argentina Dried Coconut Revenue (USD Million) By Country (2021-2032)
Figure 21. Rest of Asia Pacific Dried Coconut Revenue (USD Million) By Country (2021-2032)
Figure 22. Middle East and Africa Dried Coconut Revenue (USD Million) By Region (2021-2032)
Figure 23. Saudi Arabia Dried Coconut Revenue (USD Million) By Region (2021-2032)
Figure 24. The UAE Dried Coconut Revenue (USD Million) By Region (2021-2032)
Figure 25. Rest of Middle East Dried Coconut Revenue (USD Million) By Region (2021-2032)
Figure 26. South Africa Dried Coconut Revenue (USD Million) By Region (2021-2032)
Figure 27. Africa Dried Coconut Revenue (USD Million) By Region (2021-2032)
Figure 28. North America Dried Coconut Revenue (USD Million) By Type (2021-2032)
Figure 29. North America Dried Coconut Revenue (USD Million) By Application (2021-2032)
Figure 30. North America Dried Coconut Revenue (USD Million) By Product (2021-2032)
Figure 31. Europe Dried Coconut Revenue (USD Million) By Type (2021-2032)
Figure 32. Europe Dried Coconut Revenue (USD Million) By Application (2021-2032)
Figure 33. Europe Dried Coconut Revenue (USD Million) By Product (2021-2032)
Figure 34. Asia Pacific Dried Coconut Revenue (USD Million) By Type (2021-2032)
Figure 35. Asia Pacific Dried Coconut Revenue (USD Million) By Application (2021-2032)
Figure 36. Asia Pacific Dried Coconut Revenue (USD Million) By Product (2021-2032)
Figure 37. South America Dried Coconut Revenue (USD Million) By Type (2021-2032)
Figure 38. South America Dried Coconut Revenue (USD Million) By Application (2021-2032)
Figure 39. South America Dried Coconut Revenue (USD Million) By Product (2021-2032)
Figure 40. Middle East and Africa Dried Coconut Revenue (USD Million) By Type (2021-2032)
Figure 41. Middle East and Africa Dried Coconut Revenue (USD Million) By Application (2021-2032)
Figure 42. Middle East and Africa Dried Coconut Revenue (USD Million) By Product (2021-2032)
By Type
Unsweetened
Lightly Sweetened
Sweetened
By Application
Direct Consumption
Cakes and Bakery
Candy and Snacks
Others
Countries Analyzed
North America (US, Canada, Mexico)
Europe (Germany, UK, France, Spain, Italy, Russia, Rest of Europe)
Asia Pacific (China, India, Japan, South Korea, Australia, South East Asia, Rest of Asia)
South America (Brazil, Argentina, Rest of South America)
Middle East and Africa (Saudi Arabia, UAE, Rest of Middle East, South Africa, Egypt, Rest of Africa)
