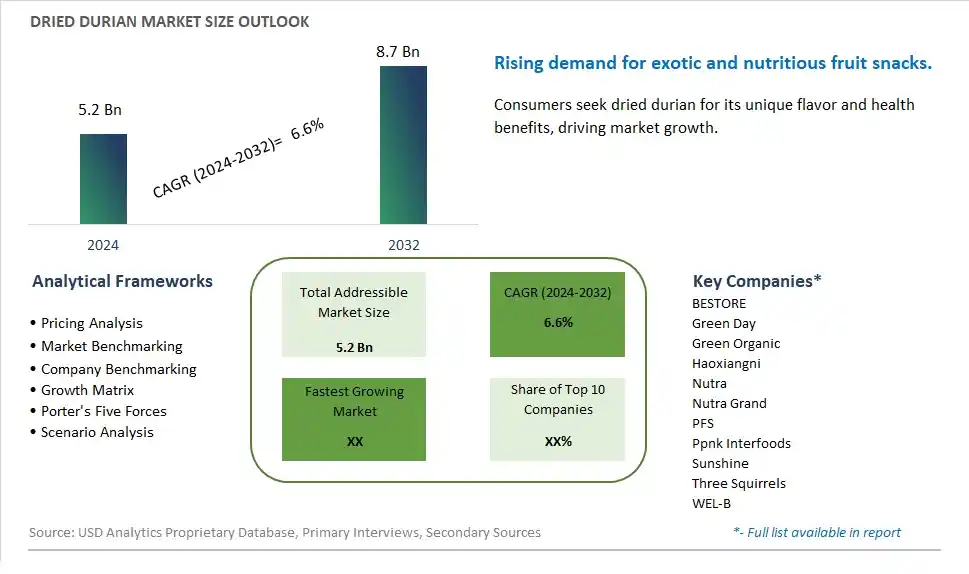
Global Dried Durian Market Size is valued at $5.2 Billion in 2024 and is forecast to register a growth rate (CAGR) of 6.6% to reach $8.7 Billion by 2032.
The global Dried Durian Market Comprehensive Study analyzes and forecasts the market size across 6 regions and 24 countries for diverse segments -By Processing Method (Vacuum Dried, Freeze Dried), By Additive (Zero Added Sugar, Added Sugar), By Application (Direct Consumption, Candy and Snacks, Others)
An Introduction to Dried Durian Market
In 2024, the Dried Durian market is witnessing steady growth, driven by the increasing demand for exotic and unique fruit snacks. Dried durian, known for its distinctive flavor and high nutritional value, is gaining popularity in both domestic and international markets. The market benefits from advancements in drying technologies that enhance the shelf life and quality of the fruit. Additionally, the rising trend of healthy and natural snacks, along with the growing awareness of the health benefits of durian, is contributing to the market's expansion.
Dried Durian Competitive Landscape
The market report analyses the leading companies in the industry including BESTORE, Green Day, Green Organic, Haoxiangni, Nutra, Nutra Grand, PFS, Ppnk Interfoods, Sunshine, Three Squirrels, WEL-B, and Others.
Dried Durian Market Dynamics
Dried Durian Market Trend: Growing Interest in Exotic and Unique Flavors
A prominent trend in the dried durian market is the growing interest in exotic and unique flavors. Durian, known for its distinctive taste and aroma, has gained popularity among consumers seeking adventurous and novel food experiences. The trend is driven by curiosity about international cuisines, the influence of food tourism, and a desire for bold and unconventional flavors in snacks and culinary creations. Dried durian appeals to consumers looking to explore new tastes and indulge in the tropical essence of this exotic fruit.
Dried Durian Market Driver: Demand for Premium and Natural Ingredients
A key driver influencing the dried durian market is the demand for premium and natural ingredients. Consumers are increasingly prioritizing quality and authenticity in their food choices, opting for products made from natural and minimally processed ingredients. Dried durian fits into this driver as it is a natural fruit with unique flavor characteristics and nutritional benefits. The driver is fueled by health-conscious consumer behavior, the preference for clean-label foods, and the perception of durian as a luxurious and indulgent ingredient.
Dried Durian Market Opportunity: Expansion into Specialty Snacks and Gourmet Products
An opportunity in the dried durian market lies in expanding into specialty snacks and gourmet products. Manufacturers can capitalize on the trend towards exotic flavors and premium ingredients by developing innovative durian-based snacks such as durian chips, durian-flavored nuts, or durian-infused chocolates. There is also an opportunity to create gourmet durian products like durian pastries, durian ice creams, or durian desserts that target niche markets and appeal to consumers looking for unique and upscale culinary experiences. Additionally, exploring partnerships with chefs, confectioners, and food artisans can facilitate the creation of high-quality and artisanal durian products that cater to discerning consumers seeking authentic and indulgent food options. Collaborating with influencers and food enthusiasts can also help raise awareness and generate excitement around dried durian as a premium and distinctive ingredient in the gourmet food segment.
Dried Durian Market Share Analysis: Vacuum Dried Durian segment generated the highest revenue share in the industry
The largest segment in the Dried Durian Market is Vacuum Dried Durian. This processing method involves removing moisture from durian fruit using vacuum technology, preserving its flavor, aroma, and nutrients effectively. Vacuum drying is preferred for durian due to its ability to maintain the fruit's natural characteristics while extending its shelf life. Vacuum dried durian retains much of the fresh fruit's taste and texture, making it a popular choice among consumers who enjoy durian's unique flavor profile but prefer a longer storage life and convenience. Additionally, vacuum drying helps reduce the risk of microbial growth and spoilage, ensuring product safety and quality. The demand for Vacuum Dried Durian is driven by its convenience, longer shelf life, and retained nutritional value, making it the largest segment in the Dried Durian Market with steady growth potential.
Dried Durian Market Share Analysis: Zero Added Sugar Dried Durian is the fastest growing segment over the forecast period to 2032
Among the segments in the Dried Durian Market, the fastest growing segment to 2032 is Zero Added Sugar Dried Durian. This trend is fueled by increasing consumer awareness and preference for healthier food options. Zero Added Sugar Dried Durian appeals to health-conscious consumers who are looking to reduce their sugar intake without compromising on taste and flavor. The demand for such products is driven by a growing emphasis on wellness, dietary concerns related to sugar consumption, and an overall shift towards healthier eating habits. Manufacturers are responding to this demand by developing and promoting Zero Added Sugar Dried Durian products, highlighting their natural sweetness and nutritional benefits. As more consumers prioritize health and wellness, the Zero Added Sugar segment is expected to experience rapid growth in the Dried Durian Market, making it a key focus for industry players and a significant driver of market expansion.
Dried Durian Market Share Analysis: Direct Consumption segment generated the highest revenue share in the industry
The largest segment in the Dried Durian Market is Direct Consumption. This segment encompasses consumers who prefer to consume dried durian fruit directly rather than as an ingredient in other products. The popularity of direct consumption is driven by several factors. Firstly, dried durian is revered for its unique flavor profile, combining a sweet and creamy taste with hints of nuttiness and caramel. This distinct flavor appeals to durian enthusiasts who enjoy its rich and indulgent taste as a standalone snack. Further, the convenience of dried durian makes it a convenient on-the-go snack option, providing a flavorful and nutritious choice for consumers with busy lifestyles. Additionally, the perception of dried durian as a natural and wholesome snack contributes to its popularity among health-conscious consumers seeking alternative snacks to processed or sugary options. As a result of these factors, the Direct Consumption segment has emerged as the largest and continues to experience steady growth in the Dried Durian Market.
Dried Durian Market Segmentation
By Processing Method
Vacuum Dried
Freeze Dried
By Additive
Zero Added Sugar
Added Sugar
By Application
Direct Consumption
Candy and Snacks
Others
Countries Analyzed
North America (US, Canada, Mexico)
Europe (Germany, UK, France, Spain, Italy, Russia, Rest of Europe)
Asia Pacific (China, India, Japan, South Korea, Australia, South East Asia, Rest of Asia)
South America (Brazil, Argentina, Rest of South America)
Middle East and Africa (Saudi Arabia, UAE, Rest of Middle East, South Africa, Egypt, Rest of Africa)
Dried Durian Companies Profiled in the Study
BESTORE
Green Day
Green Organic
Haoxiangni
Nutra
Nutra Grand
PFS
Ppnk Interfoods
Sunshine
Three Squirrels
WEL-B
*- List Not Exhaustive
Chapter 1. TABLE OF CONTENTS
Chapter 2. Introduction to Dried Durian Market
2.1. Market Overview
2.2. Key Statistics and Report Highlights
2.3. Scope of the Comprehensive Study
2.3.1. Market Definition
2.3.2 Countries and Regions Covered
2.3.3 Research Objective
2.3.4 Units, Currency, and Conversions
2.3.5 Industry Value Chain
2.4. Key Market Segments
2.5. Key Companies
2.6. Study Period
Chapter 3. Strategic Analysis Review
3.1. Dried Durian Pricing Analysis and Forecast
3.2. Porter’s Five Forces
3.3. Market Ecosystem
3.4. SWOT Analysis
3.5. Regulatory Scenario
3.3. Effects of Inflation, Russia-Ukraine War, moderating economic growth, and other macroeconomic factors
Chapter 4. Competitive Landscape
4.1. Market Share Analysis
4.1.1. Global Dried Durian Market Share by Company, 2023
4.1.2. Product Offerings of Leading Dried Durian Companies
4.2. Market Entropy
4.2.1. New Product Launches in the Industry
4.2.2. Mergers, Acquisitions, Joint ventures, and Partnerships
4.3. Key Strategies and Best Practices
Chapter 5. Global Market Projections: Best, Reference, and Low Case Scenarios
5.1. Growth Analysis- Case Scenario Definitions
5.2. Low Growth Case Scenario Forecasts
5.3. Reference Growth Case Scenario Forecasts
5.4. High Growth Case Scenario Forecasts
Chapter 6. Market Dynamics
6.1. Dried Durian Market Drivers
6.2. Dried Durian Market Challenges
6.6. Dried Durian Market Opportunities
6.4. Dried Durian Market Trends
Chapter 7. Global Dried Durian Market Outlook Trends
7.1. Global Dried Durian Revenue (USD Million) and CAGR (%) by Type (2021-2032)
7.2. Global Dried Durian Revenue (USD Million) and CAGR (%) by Application (2021-2032)
7.3. Global Dried Durian Revenue (USD Million) and CAGR (%) by Product (2021-2032)
By Processing Method
Vacuum Dried
Freeze Dried
By Additive
Zero Added Sugar
Added Sugar
By Application
Direct Consumption
Candy and Snacks
Others
Chapter 8. Global Dried Durian Regional Analysis and Outlook
8.1. Global Dried Durian Revenue (USD Million) By Regions (2021- 2032)
8.2. North America Dried Durian Revenue (USD Million) by Country (2021-2032)
8.2.1. United States Dried Durian Regional Analysis and Outlook
8.2.2. Canada Dried Durian Regional Analysis and Outlook
8.2.3. Mexico Dried Durian Regional Analysis and Outlook
8.3. Europe Dried Durian Revenue (USD Million), by Country (2021-2032)
8.3.1. Germany Dried Durian Regional Analysis and Outlook
8.3.2. France Dried Durian Regional Analysis and Outlook
8.3.3. United Kingdom Dried Durian Regional Analysis and Outlook
8.3.4. Spain Dried Durian Regional Analysis and Outlook
8.3.5. Italy Dried Durian Regional Analysis and Outlook
8.3.6. Russia Dried Durian Regional Analysis and Outlook
8.3.7. Rest of Europe Dried Durian Regional Analysis and Outlook
8.4. Asia Pacific Dried Durian Revenue (USD Million) by Country (2021-2032)
8.4.1. China Dried Durian Regional Analysis and Outlook
8.4.2. Japan Dried Durian Regional Analysis and Outlook
8.4.3. India Dried Durian Regional Analysis and Outlook
8.4.4. South Korea Dried Durian Regional Analysis and Outlook
8.4.5. Australia Dried Durian Regional Analysis and Outlook
8.4.6. South East Asia Dried Durian Regional Analysis and Outlook
8.4.7. Rest of Asia Pacific Dried Durian Regional Analysis and Outlook
8.5. South America Dried Durian Revenue (USD Million), by Country (2021-2032)
8.5.1. Brazil Dried Durian Regional Analysis and Outlook
8.5.2. Argentina Dried Durian Regional Analysis and Outlook
8.5.3. Rest of South America Dried Durian Regional Analysis and Outlook
8.6. Middle East and Africa Dried Durian Revenue (USD Million) by Country (2021-2032)
8.6.1. Middle East Dried Durian Regional Analysis and Outlook
8.6.2. Africa Dried Durian Regional Analysis and Outlook
Chapter 9. North America Dried Durian Analysis and Outlook
9.1. North America Dried Durian Revenue (USD Million) by Segments (2021-2032)
9.1.1. North America Dried Durian Revenue (USD Million) by Type (2021-2032)
9.1.2. North America Dried Durian Revenue (USD Million) by Application (2021-2032)
9.1.3. North America Dried Durian Revenue (USD Million) by Product (2021-2032)
By Processing Method
Vacuum Dried
Freeze Dried
By Additive
Zero Added Sugar
Added Sugar
By Application
Direct Consumption
Candy and Snacks
Others
Chapter 10. Europe Dried Durian Analysis and Outlook
10.1. Europe Dried Durian Revenue (USD Million), by Segments (USD Million) (2021-2032)
10.1.1. Europe Dried Durian Revenue (USD Million) by Type (2021-2032)
10.1.2. Europe Dried Durian Revenue (USD Million) by Application (2021-2032)
10.1.3. Europe Dried Durian Revenue (USD Million) by Product (2021-2032)
By Processing Method
Vacuum Dried
Freeze Dried
By Additive
Zero Added Sugar
Added Sugar
By Application
Direct Consumption
Candy and Snacks
Others
Chapter 11. Asia Pacific Dried Durian Analysis and Outlook
11.1. Asia Pacific Dried Durian Revenue (USD Million), and Revenue (USD Million) by Segments (2021-2032)
11.1.1. Asia Pacific Dried Durian Revenue (USD Million) by Type (2021-2032)
11.1.2. Asia Pacific Dried Durian Revenue (USD Million) by Application (2021-2032)
11.1.3. Asia Pacific Dried Durian Revenue (USD Million) by Product (2021-2032)
By Processing Method
Vacuum Dried
Freeze Dried
By Additive
Zero Added Sugar
Added Sugar
By Application
Direct Consumption
Candy and Snacks
Others
Chapter 12. South America Dried Durian Analysis and Outlook
12.1. South America Dried Durian Revenue (USD Million), by Segments (2021-2032)
12.1.1. South America Dried Durian Revenue (USD Million) by Type (2021-2032)
12.1.2. South America Dried Durian Revenue (USD Million) by Application (2021-2032)
12.1.3. South America Dried Durian Revenue (USD Million) by Product (2021-2032)
By Processing Method
Vacuum Dried
Freeze Dried
By Additive
Zero Added Sugar
Added Sugar
By Application
Direct Consumption
Candy and Snacks
Others
Chapter 13. Middle East and Africa Dried Durian Analysis and Outlook
13.1. Middle East and Africa Dried Durian Revenue (USD Million), by Segments (2021-2032)
13.1.1. Middle East and Africa Dried Durian Revenue (USD Million) by Type (2021-2032)
13.1.2. Middle East and Africa Dried Durian Revenue (USD Million) by Application (2021-2032)
13.1.3. Middle East and Africa Dried Durian Revenue (USD Million) by Product (2021-2032)
By Processing Method
Vacuum Dried
Freeze Dried
By Additive
Zero Added Sugar
Added Sugar
By Application
Direct Consumption
Candy and Snacks
Others
Chapter 14. Dried Durian Company Profiles
14.1 Business Overview
14.2 Product Profiles
14.3 SWOT Profiles
14.5 Recent Developments
14.6 Financial Profile
List of Companies
BESTORE
Green Day
Green Organic
Haoxiangni
Nutra
Nutra Grand
PFS
Ppnk Interfoods
Sunshine
Three Squirrels
WEL-B
15. Methodology and Data Sources
15.1 Customization Offerings
15.2 Subscription Services
15.3 Related Reports
15.4 Publisher Expertise
LIST OF TABLES
Table 1 Market Segmentation Analysis
Table 2 Global Dried Durian Market Share of Leading Companies, 2023
Table 3 Product Offerings of Leading Companies
Table 4 Low Growth Scenario Forecasts
Table 5 Reference Case Growth Scenario
Table 6 High Growth Case Scenario
Table 7 Global Dried Durian Revenue (USD Million) And CAGR (%) By Type (2021-2032)
Table 8 Global Dried Durian Revenue (USD Million) And CAGR (%) By Application (2021-2032)
Table 9 Global Dried Durian Revenue (USD Million) And CAGR (%) By Product (2021-2032)
Table 10 Global Dried Durian Market Revenue (USD Million) By Regions (2021-2032)
Table 11 Global Dried Durian Market Share (%) By Regions (2021-2032)
Table 12 North America Dried Durian Revenue (USD Million) By Country (2021-2032)
Table 13 Europe Dried Durian Revenue (USD Million) By Country (2021-2032)
Table 14 Asia Pacific Dried Durian Revenue (USD Million) By Country (2021-2032)
Table 15 South America Dried Durian Revenue (USD Million) By Country (2021-2032)
Table 16 Middle East and Africa Dried Durian Revenue (USD Million) By Region (2021-2032)
Table 17 North America Dried Durian Revenue (USD Million) By Type (2021-2032)
Table 18 North America Dried Durian Revenue (USD Million) By Application (2021-2032)
Table 19 North America Dried Durian Revenue (USD Million) By Product (2021-2032)
Table 20 Europe Dried Durian Revenue (USD Million) By Type (2021-2032)
Table 21 Europe Dried Durian Revenue (USD Million) By Application (2021-2032)
Table 22 Europe Dried Durian Revenue (USD Million) By Product (2021-2032)
Table 23 Asia Pacific Dried Durian Revenue (USD Million) By Type (2021-2032)
Table 24 Asia Pacific Dried Durian Revenue (USD Million) By Application (2021-2032)
Table 25 Asia Pacific Dried Durian Revenue (USD Million) By Product (2021-2032)
Table 26 South America Dried Durian Revenue (USD Million) By Type (2021-2032)
Table 27 South America Dried Durian Revenue (USD Million) By Application (2021-2032)
Table 28 South America Dried Durian Revenue (USD Million) By Product (2021-2032)
Table 29 Middle East and Africa Dried Durian Revenue (USD Million) By Type (2021-2032)
Table 30 Middle East and Africa Dried Durian Revenue (USD Million) By Application (2021-2032)
Table 31 Middle East and Africa Dried Durian Revenue (USD Million) By Product (2021-2032)
LIST OF FIGURES
Figure 1. Market Scope
Figure 2. Pricing Forecasts Per Unit, 2023- 2032
Figure 3. Porter’s Five Forces
Figure 4. Global Dried Durian Market Revenue (USD Million) By Regions (2021-2032)
Figure 5. Global Dried Durian Market Share (%) By Regions (2023)
Figure 6. North America Dried Durian Revenue (USD Million) By Country (2021-2032)
Figure 7. United States Dried Durian Revenue (USD Million) By Country (2021-2032)
Figure 8. Canada Dried Durian Revenue (USD Million) By Country (2021-2032)
Figure 9. Mexico Dried Durian Revenue (USD Million) By Country (2021-2032)
Figure 10. Europe Dried Durian Revenue (USD Million) By Country (2021-2032)
Figure 11. Germany Dried Durian Revenue (USD Million) By Country (2021-2032)
Figure 12. France Dried Durian Revenue (USD Million) By Country (2021-2032)
Figure 13. United Kingdom Dried Durian Revenue (USD Million) By Country (2021-2032)
Figure 14. Spain Dried Durian Revenue (USD Million) By Country (2021-2032)
Figure 15. Italy Dried Durian Revenue (USD Million) By Country (2021-2032)
Figure 16. Russia Dried Durian Revenue (USD Million) By Country (2021-2032)
Figure 17. Rest of Europe Dried Durian Revenue (USD Million) By Country (2021-2032)
Figure 11. Asia Pacific Dried Durian Revenue (USD Million) By Country (2021-2032)
Figure 12. China Dried Durian Revenue (USD Million) By Country (2021-2032)
Figure 13. Japan Dried Durian Revenue (USD Million) By Country (2021-2032)
Figure 14. India Dried Durian Revenue (USD Million) By Country (2021-2032)
Figure 15. South Korea Dried Durian Revenue (USD Million) By Country (2021-2032)
Figure 16. Australia Dried Durian Revenue (USD Million) By Country (2021-2032)
Figure 17. South East Asia Dried Durian Revenue (USD Million) By Country (2021-2032)
Figure 18. South America Dried Durian Revenue (USD Million) By Country (2021-2032)
Figure 19. Brazil Dried Durian Revenue (USD Million) By Country (2021-2032)
Figure 20. Argentina Dried Durian Revenue (USD Million) By Country (2021-2032)
Figure 21. Rest of Asia Pacific Dried Durian Revenue (USD Million) By Country (2021-2032)
Figure 22. Middle East and Africa Dried Durian Revenue (USD Million) By Region (2021-2032)
Figure 23. Saudi Arabia Dried Durian Revenue (USD Million) By Region (2021-2032)
Figure 24. The UAE Dried Durian Revenue (USD Million) By Region (2021-2032)
Figure 25. Rest of Middle East Dried Durian Revenue (USD Million) By Region (2021-2032)
Figure 26. South Africa Dried Durian Revenue (USD Million) By Region (2021-2032)
Figure 27. Africa Dried Durian Revenue (USD Million) By Region (2021-2032)
Figure 28. North America Dried Durian Revenue (USD Million) By Type (2021-2032)
Figure 29. North America Dried Durian Revenue (USD Million) By Application (2021-2032)
Figure 30. North America Dried Durian Revenue (USD Million) By Product (2021-2032)
Figure 31. Europe Dried Durian Revenue (USD Million) By Type (2021-2032)
Figure 32. Europe Dried Durian Revenue (USD Million) By Application (2021-2032)
Figure 33. Europe Dried Durian Revenue (USD Million) By Product (2021-2032)
Figure 34. Asia Pacific Dried Durian Revenue (USD Million) By Type (2021-2032)
Figure 35. Asia Pacific Dried Durian Revenue (USD Million) By Application (2021-2032)
Figure 36. Asia Pacific Dried Durian Revenue (USD Million) By Product (2021-2032)
Figure 37. South America Dried Durian Revenue (USD Million) By Type (2021-2032)
Figure 38. South America Dried Durian Revenue (USD Million) By Application (2021-2032)
Figure 39. South America Dried Durian Revenue (USD Million) By Product (2021-2032)
Figure 40. Middle East and Africa Dried Durian Revenue (USD Million) By Type (2021-2032)
Figure 41. Middle East and Africa Dried Durian Revenue (USD Million) By Application (2021-2032)
Figure 42. Middle East and Africa Dried Durian Revenue (USD Million) By Product (2021-2032)
By Processing Method
Vacuum Dried
Freeze Dried
By Additive
Zero Added Sugar
Added Sugar
By Application
Direct Consumption
Candy and Snacks
Others
Countries Analyzed
North America (US, Canada, Mexico)
Europe (Germany, UK, France, Spain, Italy, Russia, Rest of Europe)
Asia Pacific (China, India, Japan, South Korea, Australia, South East Asia, Rest of Asia)
South America (Brazil, Argentina, Rest of South America)
Middle East and Africa (Saudi Arabia, UAE, Rest of Middle East, South Africa, Egypt, Rest of Africa)
