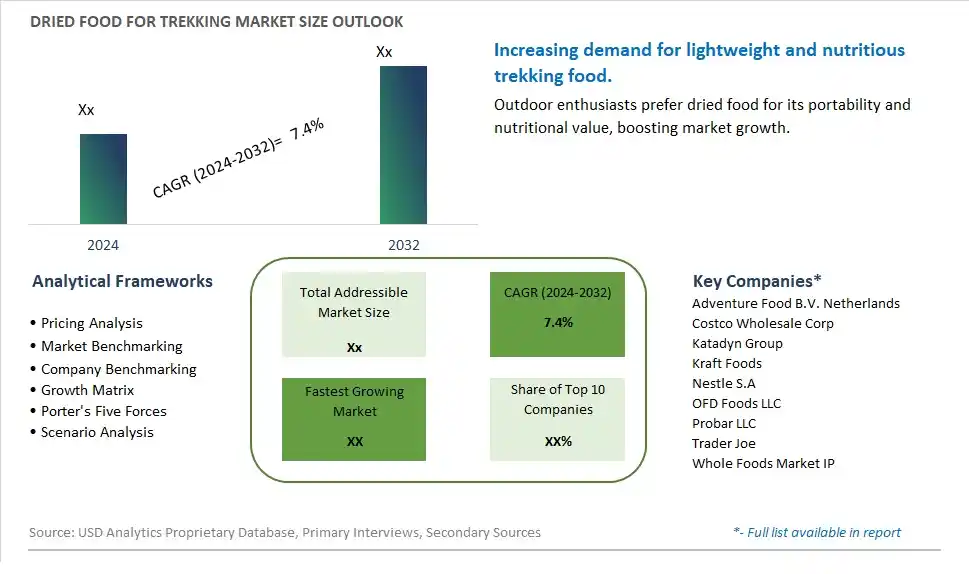
Global Dried Food for Trekking Market Size is valued at $XX Million in 2024 and is forecast to register a growth rate (CAGR) of 7.4% to reach $XX Million by 2032.
The global Dried Food for Trekking Market Comprehensive Study analyzes and forecasts the market size across 6 regions and 24 countries for diverse segments -By Type (Meat, Fish and Poultry, Pasta, Bakery Items, Dry Fruits and Nuts, Soups and Purees, Others), By Application (Online, Offline)
An Introduction to Dried Food for Trekking Market
In 2024, the Dried Food for Trekking market is experiencing robust growth, driven by the increasing popularity of outdoor activities and adventure sports. Dried foods, known for their lightweight, long shelf life, and high nutritional value, are essential for trekkers and outdoor enthusiasts. The market benefits from innovations in food preservation technologies and the rising demand for convenient and easy-to-prepare meal options. Additionally, the growing awareness of health and nutrition among adventure seekers is contributing to the market's expansion.
Dried Food for Trekking Competitive Landscape
The market report analyses the leading companies in the industry including Adventure Food B.V. Netherlands, Costco Wholesale Corp, Katadyn Group, Kraft Foods, Nestle S.A, OFD Foods LLC, Probar LLC, Trader Joe, Whole Foods Market IP, and Others.
Dried Food for Trekking Market Dynamics
Dried Food for Trekking Market Trend: Growing Demand for Lightweight and Nutritious Trekking Foods
A prominent trend in the dried food for trekking market is the growing demand for lightweight and nutritious trekking foods. Outdoor enthusiasts, hikers, and adventurers are increasingly seeking convenient, easy-to-carry, and nutritionally dense food options for their trekking and outdoor activities. Dried foods, such as dried fruits, vegetables, meats, and meals, meet this trend by offering lightweight, compact, and shelf-stable solutions that provide essential nutrients and energy during extended outdoor adventures. The trend is driven by a rise in outdoor recreational activities, health-conscious lifestyles, and the need for portable and sustainable food choices for on-the-go consumption.
Dried Food for Trekking Market Driver: Convenience and Long Shelf Life of Dried Trekking Foods
A key driver influencing the dried food for trekking market is the convenience and long shelf life of dried trekking foods. Consumers value products that are easy to pack, require minimal preparation, and can withstand varying environmental conditions encountered during trekking and outdoor expeditions. Dried foods offer these benefits, as they are lightweight, non-perishable, and do not require refrigeration, making them ideal for outdoor adventures where storage space and food preservation are crucial. The driver is fueled by the increasing popularity of outdoor activities, the need for portable meal solutions, and the practicality of dried foods for sustaining energy and nutrition during trekking trips.
Dried Food for Trekking Market Opportunity: Innovation in Flavor Profiles and Packaging for Trekking Foods
An opportunity in the dried food for trekking market lies in innovation in flavor profiles and packaging for trekking foods. Manufacturers can capitalize on consumer preferences for variety and taste by offering a diverse range of flavors, seasoning blends, and meal options tailored to the preferences and dietary needs of outdoor enthusiasts. There is also an opportunity to innovate with packaging formats that enhance convenience, portion control, and durability, such as resealable pouches, vacuum-sealed packs, and lightweight containers designed for easy transport. Additionally, exploring partnerships with nutritionists, chefs, and outdoor experts can lead to the development of specialized trekking food products that optimize nutritional content, flavor, and convenience, catering to the specific requirements and experiences of trekkers and outdoor adventurers. Collaborating with outdoor gear retailers, adventure tour operators, and sporting goods stores can also facilitate market expansion and visibility for dried food products within the trekking and outdoor recreation sectors.
Dried Food for Trekking Market Share Analysis: Dry Fruits and Nuts segment generated the highest revenue share in the industry
The largest segment in the Dried Food for Trekking Market is Dry Fruits and Nuts. This segment comprises a diverse range of dried fruits such as raisins, apricots, figs, and dates, along with nuts like almonds, walnuts, cashews, and peanuts. Dry fruits and nuts are favored by trekkers and outdoor enthusiasts for several reasons. Firstly, they offer a lightweight and compact source of nutrition, making them ideal for backpacking and trekking trips where space and weight are crucial considerations. Further, they are nutrient-dense, providing essential vitamins, minerals, antioxidants, and healthy fats that help sustain energy levels and support overall health during physical activities. Further, dry fruits and nuts have a long shelf life and do not require refrigeration, making them convenient and suitable for extended outdoor excursions. Their natural sweetness, rich flavor, and satisfying crunch also make them a popular choice for snacking on the go. As more people engage in outdoor activities like trekking, camping, and hiking, the demand for nutritious, portable, and flavorful dried food options, particularly dry fruits and nuts, is expected to grow rapidly in the Dried Food for Trekking Market, solidifying its position as the largest segment.
Dried Food for Trekking Market Share Analysis: Online is the fastest growing segment over the forecast period to 2032
The fastest-growing segment in the Dried Food for Trekking Market is the Online Application. With the increasing digitalization and widespread availability of e-commerce platforms, online purchasing of dried food products for trekking and outdoor activities has witnessed significant growth and is projected to continue expanding rapidly until 2032. This growth can be attributed to several factors. Firstly, online platforms offer a convenient and accessible shopping experience, allowing consumers to browse a wide range of dried food options, compare prices, read reviews, and make purchases from the comfort of their homes or on the go. Further, the Past few yearshas accelerated the shift towards online shopping across various industries, including the outdoor and adventure market, as consumers seek contactless and safer shopping alternatives. Additionally, online retailers often provide discounts, promotions, and subscription services that attract customers and encourage repeat purchases. Furthermore, the ability to access a global market and discover unique or specialty dried food products enhances the appeal of online platforms for trekking enthusiasts looking for diverse and high-quality options. As digital platforms continue to evolve, offering seamless shopping experiences and efficient delivery services, the Online Application segment is poised for robust growth in the Dried Food for Trekking Market, catering to the increasing demand for convenient, varied, and accessible dried food solutions for outdoor adventures.
Dried Food for Trekking Market Segmentation
By Type
Meat
Fish and Poultry
Pasta
Bakery Items
Dry Fruits and Nuts
Soups and Purees
Others
By Application
Online
Offline
Countries Analyzed
North America (US, Canada, Mexico)
Europe (Germany, UK, France, Spain, Italy, Russia, Rest of Europe)
Asia Pacific (China, India, Japan, South Korea, Australia, South East Asia, Rest of Asia)
South America (Brazil, Argentina, Rest of South America)
Middle East and Africa (Saudi Arabia, UAE, Rest of Middle East, South Africa, Egypt, Rest of Africa)
Dried Food for Trekking Companies Profiled in the Study
Adventure Food B.V. Netherlands
Costco Wholesale Corp
Katadyn Group
Kraft Foods
Nestle S.A
OFD Foods LLC
Probar LLC
Trader Joe
Whole Foods Market IP
*- List Not Exhaustive
Chapter 1. TABLE OF CONTENTS
Chapter 2. Introduction to Dried Food for Trekking Market
2.1. Market Overview
2.2. Key Statistics and Report Highlights
2.3. Scope of the Comprehensive Study
2.3.1. Market Definition
2.3.2 Countries and Regions Covered
2.3.3 Research Objective
2.3.4 Units, Currency, and Conversions
2.3.5 Industry Value Chain
2.4. Key Market Segments
2.5. Key Companies
2.6. Study Period
Chapter 3. Strategic Analysis Review
3.1. Dried Food for Trekking Pricing Analysis and Forecast
3.2. Porter’s Five Forces
3.3. Market Ecosystem
3.4. SWOT Analysis
3.5. Regulatory Scenario
3.3. Effects of Inflation, Russia-Ukraine War, moderating economic growth, and other macroeconomic factors
Chapter 4. Competitive Landscape
4.1. Market Share Analysis
4.1.1. Global Dried Food for Trekking Market Share by Company, 2023
4.1.2. Product Offerings of Leading Dried Food for Trekking Companies
4.2. Market Entropy
4.2.1. New Product Launches in the Industry
4.2.2. Mergers, Acquisitions, Joint ventures, and Partnerships
4.3. Key Strategies and Best Practices
Chapter 5. Global Market Projections: Best, Reference, and Low Case Scenarios
5.1. Growth Analysis- Case Scenario Definitions
5.2. Low Growth Case Scenario Forecasts
5.3. Reference Growth Case Scenario Forecasts
5.4. High Growth Case Scenario Forecasts
Chapter 6. Market Dynamics
6.1. Dried Food for Trekking Market Drivers
6.2. Dried Food for Trekking Market Challenges
6.6. Dried Food for Trekking Market Opportunities
6.4. Dried Food for Trekking Market Trends
Chapter 7. Global Dried Food for Trekking Market Outlook Trends
7.1. Global Dried Food for Trekking Revenue (USD Million) and CAGR (%) by Type (2021-2032)
7.2. Global Dried Food for Trekking Revenue (USD Million) and CAGR (%) by Application (2021-2032)
7.3. Global Dried Food for Trekking Revenue (USD Million) and CAGR (%) by Product (2021-2032)
By Type
Meat
Fish and Poultry
Pasta
Bakery Items
Dry Fruits and Nuts
Soups and Purees
Others
By Application
Online
Offline
Chapter 8. Global Dried Food for Trekking Regional Analysis and Outlook
8.1. Global Dried Food for Trekking Revenue (USD Million) By Regions (2021- 2032)
8.2. North America Dried Food for Trekking Revenue (USD Million) by Country (2021-2032)
8.2.1. United States Dried Food for Trekking Regional Analysis and Outlook
8.2.2. Canada Dried Food for Trekking Regional Analysis and Outlook
8.2.3. Mexico Dried Food for Trekking Regional Analysis and Outlook
8.3. Europe Dried Food for Trekking Revenue (USD Million), by Country (2021-2032)
8.3.1. Germany Dried Food for Trekking Regional Analysis and Outlook
8.3.2. France Dried Food for Trekking Regional Analysis and Outlook
8.3.3. United Kingdom Dried Food for Trekking Regional Analysis and Outlook
8.3.4. Spain Dried Food for Trekking Regional Analysis and Outlook
8.3.5. Italy Dried Food for Trekking Regional Analysis and Outlook
8.3.6. Russia Dried Food for Trekking Regional Analysis and Outlook
8.3.7. Rest of Europe Dried Food for Trekking Regional Analysis and Outlook
8.4. Asia Pacific Dried Food for Trekking Revenue (USD Million) by Country (2021-2032)
8.4.1. China Dried Food for Trekking Regional Analysis and Outlook
8.4.2. Japan Dried Food for Trekking Regional Analysis and Outlook
8.4.3. India Dried Food for Trekking Regional Analysis and Outlook
8.4.4. South Korea Dried Food for Trekking Regional Analysis and Outlook
8.4.5. Australia Dried Food for Trekking Regional Analysis and Outlook
8.4.6. South East Asia Dried Food for Trekking Regional Analysis and Outlook
8.4.7. Rest of Asia Pacific Dried Food for Trekking Regional Analysis and Outlook
8.5. South America Dried Food for Trekking Revenue (USD Million), by Country (2021-2032)
8.5.1. Brazil Dried Food for Trekking Regional Analysis and Outlook
8.5.2. Argentina Dried Food for Trekking Regional Analysis and Outlook
8.5.3. Rest of South America Dried Food for Trekking Regional Analysis and Outlook
8.6. Middle East and Africa Dried Food for Trekking Revenue (USD Million) by Country (2021-2032)
8.6.1. Middle East Dried Food for Trekking Regional Analysis and Outlook
8.6.2. Africa Dried Food for Trekking Regional Analysis and Outlook
Chapter 9. North America Dried Food for Trekking Analysis and Outlook
9.1. North America Dried Food for Trekking Revenue (USD Million) by Segments (2021-2032)
9.1.1. North America Dried Food for Trekking Revenue (USD Million) by Type (2021-2032)
9.1.2. North America Dried Food for Trekking Revenue (USD Million) by Application (2021-2032)
9.1.3. North America Dried Food for Trekking Revenue (USD Million) by Product (2021-2032)
By Type
Meat
Fish and Poultry
Pasta
Bakery Items
Dry Fruits and Nuts
Soups and Purees
Others
By Application
Online
Offline
Chapter 10. Europe Dried Food for Trekking Analysis and Outlook
10.1. Europe Dried Food for Trekking Revenue (USD Million), by Segments (USD Million) (2021-2032)
10.1.1. Europe Dried Food for Trekking Revenue (USD Million) by Type (2021-2032)
10.1.2. Europe Dried Food for Trekking Revenue (USD Million) by Application (2021-2032)
10.1.3. Europe Dried Food for Trekking Revenue (USD Million) by Product (2021-2032)
By Type
Meat
Fish and Poultry
Pasta
Bakery Items
Dry Fruits and Nuts
Soups and Purees
Others
By Application
Online
Offline
Chapter 11. Asia Pacific Dried Food for Trekking Analysis and Outlook
11.1. Asia Pacific Dried Food for Trekking Revenue (USD Million), and Revenue (USD Million) by Segments (2021-2032)
11.1.1. Asia Pacific Dried Food for Trekking Revenue (USD Million) by Type (2021-2032)
11.1.2. Asia Pacific Dried Food for Trekking Revenue (USD Million) by Application (2021-2032)
11.1.3. Asia Pacific Dried Food for Trekking Revenue (USD Million) by Product (2021-2032)
By Type
Meat
Fish and Poultry
Pasta
Bakery Items
Dry Fruits and Nuts
Soups and Purees
Others
By Application
Online
Offline
Chapter 12. South America Dried Food for Trekking Analysis and Outlook
12.1. South America Dried Food for Trekking Revenue (USD Million), by Segments (2021-2032)
12.1.1. South America Dried Food for Trekking Revenue (USD Million) by Type (2021-2032)
12.1.2. South America Dried Food for Trekking Revenue (USD Million) by Application (2021-2032)
12.1.3. South America Dried Food for Trekking Revenue (USD Million) by Product (2021-2032)
By Type
Meat
Fish and Poultry
Pasta
Bakery Items
Dry Fruits and Nuts
Soups and Purees
Others
By Application
Online
Offline
Chapter 13. Middle East and Africa Dried Food for Trekking Analysis and Outlook
13.1. Middle East and Africa Dried Food for Trekking Revenue (USD Million), by Segments (2021-2032)
13.1.1. Middle East and Africa Dried Food for Trekking Revenue (USD Million) by Type (2021-2032)
13.1.2. Middle East and Africa Dried Food for Trekking Revenue (USD Million) by Application (2021-2032)
13.1.3. Middle East and Africa Dried Food for Trekking Revenue (USD Million) by Product (2021-2032)
By Type
Meat
Fish and Poultry
Pasta
Bakery Items
Dry Fruits and Nuts
Soups and Purees
Others
By Application
Online
Offline
Chapter 14. Dried Food for Trekking Company Profiles
14.1 Business Overview
14.2 Product Profiles
14.3 SWOT Profiles
14.5 Recent Developments
14.6 Financial Profile
List of Companies
Adventure Food B.V. Netherlands
Costco Wholesale Corp
Katadyn Group
Kraft Foods
Nestle S.A
OFD Foods LLC
Probar LLC
Trader Joe
Whole Foods Market IP
15. Methodology and Data Sources
15.1 Customization Offerings
15.2 Subscription Services
15.3 Related Reports
15.4 Publisher Expertise
LIST OF TABLES
Table 1 Market Segmentation Analysis
Table 2 Global Dried Food for Trekking Market Share of Leading Companies, 2023
Table 3 Product Offerings of Leading Companies
Table 4 Low Growth Scenario Forecasts
Table 5 Reference Case Growth Scenario
Table 6 High Growth Case Scenario
Table 7 Global Dried Food for Trekking Revenue (USD Million) And CAGR (%) By Type (2021-2032)
Table 8 Global Dried Food for Trekking Revenue (USD Million) And CAGR (%) By Application (2021-2032)
Table 9 Global Dried Food for Trekking Revenue (USD Million) And CAGR (%) By Product (2021-2032)
Table 10 Global Dried Food for Trekking Market Revenue (USD Million) By Regions (2021-2032)
Table 11 Global Dried Food for Trekking Market Share (%) By Regions (2021-2032)
Table 12 North America Dried Food for Trekking Revenue (USD Million) By Country (2021-2032)
Table 13 Europe Dried Food for Trekking Revenue (USD Million) By Country (2021-2032)
Table 14 Asia Pacific Dried Food for Trekking Revenue (USD Million) By Country (2021-2032)
Table 15 South America Dried Food for Trekking Revenue (USD Million) By Country (2021-2032)
Table 16 Middle East and Africa Dried Food for Trekking Revenue (USD Million) By Region (2021-2032)
Table 17 North America Dried Food for Trekking Revenue (USD Million) By Type (2021-2032)
Table 18 North America Dried Food for Trekking Revenue (USD Million) By Application (2021-2032)
Table 19 North America Dried Food for Trekking Revenue (USD Million) By Product (2021-2032)
Table 20 Europe Dried Food for Trekking Revenue (USD Million) By Type (2021-2032)
Table 21 Europe Dried Food for Trekking Revenue (USD Million) By Application (2021-2032)
Table 22 Europe Dried Food for Trekking Revenue (USD Million) By Product (2021-2032)
Table 23 Asia Pacific Dried Food for Trekking Revenue (USD Million) By Type (2021-2032)
Table 24 Asia Pacific Dried Food for Trekking Revenue (USD Million) By Application (2021-2032)
Table 25 Asia Pacific Dried Food for Trekking Revenue (USD Million) By Product (2021-2032)
Table 26 South America Dried Food for Trekking Revenue (USD Million) By Type (2021-2032)
Table 27 South America Dried Food for Trekking Revenue (USD Million) By Application (2021-2032)
Table 28 South America Dried Food for Trekking Revenue (USD Million) By Product (2021-2032)
Table 29 Middle East and Africa Dried Food for Trekking Revenue (USD Million) By Type (2021-2032)
Table 30 Middle East and Africa Dried Food for Trekking Revenue (USD Million) By Application (2021-2032)
Table 31 Middle East and Africa Dried Food for Trekking Revenue (USD Million) By Product (2021-2032)
LIST OF FIGURES
Figure 1. Market Scope
Figure 2. Pricing Forecasts Per Unit, 2023- 2032
Figure 3. Porter’s Five Forces
Figure 4. Global Dried Food for Trekking Market Revenue (USD Million) By Regions (2021-2032)
Figure 5. Global Dried Food for Trekking Market Share (%) By Regions (2023)
Figure 6. North America Dried Food for Trekking Revenue (USD Million) By Country (2021-2032)
Figure 7. United States Dried Food for Trekking Revenue (USD Million) By Country (2021-2032)
Figure 8. Canada Dried Food for Trekking Revenue (USD Million) By Country (2021-2032)
Figure 9. Mexico Dried Food for Trekking Revenue (USD Million) By Country (2021-2032)
Figure 10. Europe Dried Food for Trekking Revenue (USD Million) By Country (2021-2032)
Figure 11. Germany Dried Food for Trekking Revenue (USD Million) By Country (2021-2032)
Figure 12. France Dried Food for Trekking Revenue (USD Million) By Country (2021-2032)
Figure 13. United Kingdom Dried Food for Trekking Revenue (USD Million) By Country (2021-2032)
Figure 14. Spain Dried Food for Trekking Revenue (USD Million) By Country (2021-2032)
Figure 15. Italy Dried Food for Trekking Revenue (USD Million) By Country (2021-2032)
Figure 16. Russia Dried Food for Trekking Revenue (USD Million) By Country (2021-2032)
Figure 17. Rest of Europe Dried Food for Trekking Revenue (USD Million) By Country (2021-2032)
Figure 11. Asia Pacific Dried Food for Trekking Revenue (USD Million) By Country (2021-2032)
Figure 12. China Dried Food for Trekking Revenue (USD Million) By Country (2021-2032)
Figure 13. Japan Dried Food for Trekking Revenue (USD Million) By Country (2021-2032)
Figure 14. India Dried Food for Trekking Revenue (USD Million) By Country (2021-2032)
Figure 15. South Korea Dried Food for Trekking Revenue (USD Million) By Country (2021-2032)
Figure 16. Australia Dried Food for Trekking Revenue (USD Million) By Country (2021-2032)
Figure 17. South East Asia Dried Food for Trekking Revenue (USD Million) By Country (2021-2032)
Figure 18. South America Dried Food for Trekking Revenue (USD Million) By Country (2021-2032)
Figure 19. Brazil Dried Food for Trekking Revenue (USD Million) By Country (2021-2032)
Figure 20. Argentina Dried Food for Trekking Revenue (USD Million) By Country (2021-2032)
Figure 21. Rest of Asia Pacific Dried Food for Trekking Revenue (USD Million) By Country (2021-2032)
Figure 22. Middle East and Africa Dried Food for Trekking Revenue (USD Million) By Region (2021-2032)
Figure 23. Saudi Arabia Dried Food for Trekking Revenue (USD Million) By Region (2021-2032)
Figure 24. The UAE Dried Food for Trekking Revenue (USD Million) By Region (2021-2032)
Figure 25. Rest of Middle East Dried Food for Trekking Revenue (USD Million) By Region (2021-2032)
Figure 26. South Africa Dried Food for Trekking Revenue (USD Million) By Region (2021-2032)
Figure 27. Africa Dried Food for Trekking Revenue (USD Million) By Region (2021-2032)
Figure 28. North America Dried Food for Trekking Revenue (USD Million) By Type (2021-2032)
Figure 29. North America Dried Food for Trekking Revenue (USD Million) By Application (2021-2032)
Figure 30. North America Dried Food for Trekking Revenue (USD Million) By Product (2021-2032)
Figure 31. Europe Dried Food for Trekking Revenue (USD Million) By Type (2021-2032)
Figure 32. Europe Dried Food for Trekking Revenue (USD Million) By Application (2021-2032)
Figure 33. Europe Dried Food for Trekking Revenue (USD Million) By Product (2021-2032)
Figure 34. Asia Pacific Dried Food for Trekking Revenue (USD Million) By Type (2021-2032)
Figure 35. Asia Pacific Dried Food for Trekking Revenue (USD Million) By Application (2021-2032)
Figure 36. Asia Pacific Dried Food for Trekking Revenue (USD Million) By Product (2021-2032)
Figure 37. South America Dried Food for Trekking Revenue (USD Million) By Type (2021-2032)
Figure 38. South America Dried Food for Trekking Revenue (USD Million) By Application (2021-2032)
Figure 39. South America Dried Food for Trekking Revenue (USD Million) By Product (2021-2032)
Figure 40. Middle East and Africa Dried Food for Trekking Revenue (USD Million) By Type (2021-2032)
Figure 41. Middle East and Africa Dried Food for Trekking Revenue (USD Million) By Application (2021-2032)
Figure 42. Middle East and Africa Dried Food for Trekking Revenue (USD Million) By Product (2021-2032)
By Type
Meat
Fish and Poultry
Pasta
Bakery Items
Dry Fruits and Nuts
Soups and Purees
Others
By Application
Online
Offline
Countries Analyzed
North America (US, Canada, Mexico)
Europe (Germany, UK, France, Spain, Italy, Russia, Rest of Europe)
Asia Pacific (China, India, Japan, South Korea, Australia, South East Asia, Rest of Asia)
South America (Brazil, Argentina, Rest of South America)
Middle East and Africa (Saudi Arabia, UAE, Rest of Middle East, South Africa, Egypt, Rest of Africa)
