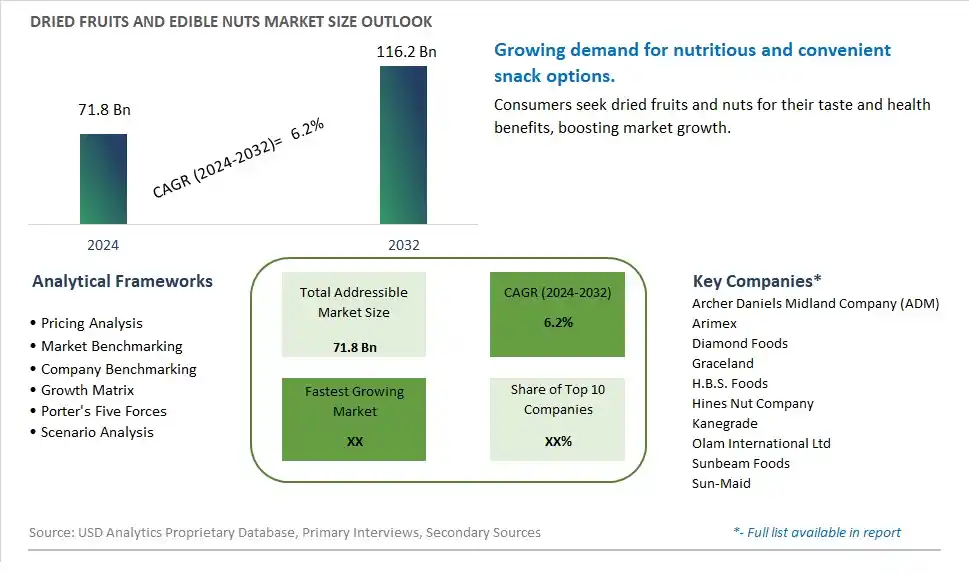
Global Dried Fruits and Edible Nuts Market Size is valued at $71.8 Billion in 2024 and is forecast to register a growth rate (CAGR) of 6.2% to reach $116.2 Billion by 2032.
The global Dried Fruits and Edible Nuts Market Comprehensive Study analyzes and forecasts the market size across 6 regions and 24 countries for diverse segments -By Type (Dried Fruits, Edible Nuts), By Application (Commercial, Household)
An Introduction to Dried Fruits and Edible Nuts Market
In 2024, the Dried Fruits and Edible Nuts market is experiencing significant growth, driven by the rising consumer preference for healthy and nutritious snack options. Dried fruits and nuts are valued for their high nutrient content, convenience, and long shelf life. The market benefits from the growing trend of plant-based diets and the increasing awareness of the health benefits of dried fruits and nuts. Additionally, innovations in packaging and the introduction of new and exotic varieties are contributing to market expansion.
Dried Fruits and Edible Nuts Competitive Landscape
The market report analyses the leading companies in the industry including Archer Daniels Midland Company (ADM), Arimex, Diamond Foods, Graceland, H.B.S. Foods, Hines Nut Company, Kanegrade, Olam International Ltd, Sunbeam Foods, Sun-Maid, and Others.
Dried Fruits and Edible Nuts Market Dynamics
Dried Fruits and Edible Nuts Market Trend: Shift Towards Healthy and Natural Snacking
A prominent trend in the dried fruits and edible nuts market is the shift towards healthy and natural snacking. Consumers are increasingly opting for snacks that offer nutritional benefits, such as vitamins, minerals, fiber, and healthy fats, while being free from artificial additives and preservatives. Dried fruits and edible nuts align with this trend by providing a convenient and nutrient-dense snacking option that supports overall health and wellness. The trend is driven by the growing awareness of the importance of a balanced diet, the desire for clean-label foods, and the preference for on-the-go snacks that offer sustained energy.
Dried Fruits and Edible Nuts Market Driver: Rise in Plant-Based and Protein-Rich Dietary Choices
A key driver influencing the dried fruits and edible nuts market is the rise in plant-based and protein-rich dietary choices. Consumers are embracing plant-based diets for health, sustainability, and ethical reasons, leading to increased consumption of plant-derived foods such as dried fruits and nuts. Additionally, the demand for protein-rich snacks has grown as consumers seek satisfying and satiating options that support muscle maintenance and overall well-being. Dried fruits and edible nuts fulfill this driver by offering natural sources of essential nutrients, including protein, healthy fats, vitamins, and antioxidants. The driver is fueled by the plant-based food movement, the popularity of vegetarian and vegan lifestyles, and the recognition of nuts and dried fruits as nutrient-dense superfoods.
Dried Fruits and Edible Nuts Market Opportunity: Expansion into Health and Wellness Segments
An opportunity in the dried fruits and edible nuts market lies in expanding into health and wellness segments. Manufacturers can capitalize on the growing consumer interest in functional foods and ingredients that offer specific health benefits, such as heart health, digestive wellness, and immune support. By highlighting the nutritional properties and health-promoting attributes of dried fruits and nuts, companies can target health-conscious consumers looking for snacks that contribute to their overall well-being. Additionally, there is an opportunity to innovate with product formulations that cater to dietary preferences and restrictions, such as gluten-free, organic, non-GMO, and allergen-friendly options. Collaborating with health experts, nutritionists, and dieticians can also provide valuable insights for product development and marketing strategies, further enhancing the market position of dried fruits and edible nuts as essential components of a healthy and balanced diet.
Dried Fruits and Edible Nuts Market Share Analysis: Dried Fruits segment generated the highest revenue share in the industry
The largest segment in the Dried Fruits and Edible Nuts Market is Dried Fruits. Dried fruits encompass a wide range of products such as raisins, apricots, figs, dates, and cranberries, among others. These fruits undergo a dehydration process that removes the water content while retaining the nutrients, flavor, and natural sweetness. Dried fruits are popular among consumers for their convenience, extended shelf life, portability, and versatility in various culinary applications. They are used as ingredients in baking, cooking, snack bars, cereals, trail mixes, and desserts, offering a healthy and flavorful addition to a balanced diet. Furthermore, dried fruits are rich in vitamins, minerals, antioxidants, and dietary fiber, making them a preferred choice for health-conscious individuals seeking nutritious snack alternatives.
Dried Fruits and Edible Nuts Market Share Analysis: Commercial Application is the fastest growing segment over the forecast period to 2032
The fastest-growing segment in the Dried Fruits and Edible Nuts Market is the Commercial Application. Commercial usage of dried fruits and edible nuts refers to their incorporation into food products and recipes by businesses, food manufacturers, restaurants, catering services, and other commercial entities. The demand for dried fruits and nuts in the commercial sector is driven by several factors. Firstly, there is a growing trend of health-focused food offerings in the commercial food industry, with consumers increasingly seeking healthier and natural ingredients like dried fruits and nuts. Further, the versatility of these products allows for their inclusion in a wide range of food items, including bakery products, confectioneries, snacks, breakfast cereals, salads, sauces, and beverages, enhancing flavor profiles and nutritional value. Lastly, as consumer preferences evolve towards clean label and transparent ingredient lists, dried fruits and nuts serve as wholesome additions that contribute to the overall appeal and marketability of commercial food products. Therefore, the Commercial Application segment is experiencing rapid growth and is expected to continue expanding significantly by 2032.
Dried Fruits and Edible Nuts Market Segmentation
By Type
Dried Fruits
Edible Nuts
By Application
Commercial
Household
Countries Analyzed
North America (US, Canada, Mexico)
Europe (Germany, UK, France, Spain, Italy, Russia, Rest of Europe)
Asia Pacific (China, India, Japan, South Korea, Australia, South East Asia, Rest of Asia)
South America (Brazil, Argentina, Rest of South America)
Middle East and Africa (Saudi Arabia, UAE, Rest of Middle East, South Africa, Egypt, Rest of Africa)
Dried Fruits and Edible Nuts Companies Profiled in the Study
Archer Daniels Midland Company (ADM)
Arimex
Diamond Foods
Graceland
H.B.S. Foods
Hines Nut Company
Kanegrade
Olam International Ltd
Sunbeam Foods
Sun-Maid
*- List Not Exhaustive
Chapter 1. TABLE OF CONTENTS
Chapter 2. Introduction to Dried Fruits and Edible Nuts Market
2.1. Market Overview
2.2. Key Statistics and Report Highlights
2.3. Scope of the Comprehensive Study
2.3.1. Market Definition
2.3.2 Countries and Regions Covered
2.3.3 Research Objective
2.3.4 Units, Currency, and Conversions
2.3.5 Industry Value Chain
2.4. Key Market Segments
2.5. Key Companies
2.6. Study Period
Chapter 3. Strategic Analysis Review
3.1. Dried Fruits and Edible Nuts Pricing Analysis and Forecast
3.2. Porter’s Five Forces
3.3. Market Ecosystem
3.4. SWOT Analysis
3.5. Regulatory Scenario
3.3. Effects of Inflation, Russia-Ukraine War, moderating economic growth, and other macroeconomic factors
Chapter 4. Competitive Landscape
4.1. Market Share Analysis
4.1.1. Global Dried Fruits and Edible Nuts Market Share by Company, 2023
4.1.2. Product Offerings of Leading Dried Fruits and Edible Nuts Companies
4.2. Market Entropy
4.2.1. New Product Launches in the Industry
4.2.2. Mergers, Acquisitions, Joint ventures, and Partnerships
4.3. Key Strategies and Best Practices
Chapter 5. Global Market Projections: Best, Reference, and Low Case Scenarios
5.1. Growth Analysis- Case Scenario Definitions
5.2. Low Growth Case Scenario Forecasts
5.3. Reference Growth Case Scenario Forecasts
5.4. High Growth Case Scenario Forecasts
Chapter 6. Market Dynamics
6.1. Dried Fruits and Edible Nuts Market Drivers
6.2. Dried Fruits and Edible Nuts Market Challenges
6.6. Dried Fruits and Edible Nuts Market Opportunities
6.4. Dried Fruits and Edible Nuts Market Trends
Chapter 7. Global Dried Fruits and Edible Nuts Market Outlook Trends
7.1. Global Dried Fruits and Edible Nuts Revenue (USD Million) and CAGR (%) by Type (2021-2032)
7.2. Global Dried Fruits and Edible Nuts Revenue (USD Million) and CAGR (%) by Application (2021-2032)
7.3. Global Dried Fruits and Edible Nuts Revenue (USD Million) and CAGR (%) by Product (2021-2032)
By Type
Dried Fruits
Edible Nuts
By Application
Commercial
Household
Chapter 8. Global Dried Fruits and Edible Nuts Regional Analysis and Outlook
8.1. Global Dried Fruits and Edible Nuts Revenue (USD Million) By Regions (2021- 2032)
8.2. North America Dried Fruits and Edible Nuts Revenue (USD Million) by Country (2021-2032)
8.2.1. United States Dried Fruits and Edible Nuts Regional Analysis and Outlook
8.2.2. Canada Dried Fruits and Edible Nuts Regional Analysis and Outlook
8.2.3. Mexico Dried Fruits and Edible Nuts Regional Analysis and Outlook
8.3. Europe Dried Fruits and Edible Nuts Revenue (USD Million), by Country (2021-2032)
8.3.1. Germany Dried Fruits and Edible Nuts Regional Analysis and Outlook
8.3.2. France Dried Fruits and Edible Nuts Regional Analysis and Outlook
8.3.3. United Kingdom Dried Fruits and Edible Nuts Regional Analysis and Outlook
8.3.4. Spain Dried Fruits and Edible Nuts Regional Analysis and Outlook
8.3.5. Italy Dried Fruits and Edible Nuts Regional Analysis and Outlook
8.3.6. Russia Dried Fruits and Edible Nuts Regional Analysis and Outlook
8.3.7. Rest of Europe Dried Fruits and Edible Nuts Regional Analysis and Outlook
8.4. Asia Pacific Dried Fruits and Edible Nuts Revenue (USD Million) by Country (2021-2032)
8.4.1. China Dried Fruits and Edible Nuts Regional Analysis and Outlook
8.4.2. Japan Dried Fruits and Edible Nuts Regional Analysis and Outlook
8.4.3. India Dried Fruits and Edible Nuts Regional Analysis and Outlook
8.4.4. South Korea Dried Fruits and Edible Nuts Regional Analysis and Outlook
8.4.5. Australia Dried Fruits and Edible Nuts Regional Analysis and Outlook
8.4.6. South East Asia Dried Fruits and Edible Nuts Regional Analysis and Outlook
8.4.7. Rest of Asia Pacific Dried Fruits and Edible Nuts Regional Analysis and Outlook
8.5. South America Dried Fruits and Edible Nuts Revenue (USD Million), by Country (2021-2032)
8.5.1. Brazil Dried Fruits and Edible Nuts Regional Analysis and Outlook
8.5.2. Argentina Dried Fruits and Edible Nuts Regional Analysis and Outlook
8.5.3. Rest of South America Dried Fruits and Edible Nuts Regional Analysis and Outlook
8.6. Middle East and Africa Dried Fruits and Edible Nuts Revenue (USD Million) by Country (2021-2032)
8.6.1. Middle East Dried Fruits and Edible Nuts Regional Analysis and Outlook
8.6.2. Africa Dried Fruits and Edible Nuts Regional Analysis and Outlook
Chapter 9. North America Dried Fruits and Edible Nuts Analysis and Outlook
9.1. North America Dried Fruits and Edible Nuts Revenue (USD Million) by Segments (2021-2032)
9.1.1. North America Dried Fruits and Edible Nuts Revenue (USD Million) by Type (2021-2032)
9.1.2. North America Dried Fruits and Edible Nuts Revenue (USD Million) by Application (2021-2032)
9.1.3. North America Dried Fruits and Edible Nuts Revenue (USD Million) by Product (2021-2032)
By Type
Dried Fruits
Edible Nuts
By Application
Commercial
Household
Chapter 10. Europe Dried Fruits and Edible Nuts Analysis and Outlook
10.1. Europe Dried Fruits and Edible Nuts Revenue (USD Million), by Segments (USD Million) (2021-2032)
10.1.1. Europe Dried Fruits and Edible Nuts Revenue (USD Million) by Type (2021-2032)
10.1.2. Europe Dried Fruits and Edible Nuts Revenue (USD Million) by Application (2021-2032)
10.1.3. Europe Dried Fruits and Edible Nuts Revenue (USD Million) by Product (2021-2032)
By Type
Dried Fruits
Edible Nuts
By Application
Commercial
Household
Chapter 11. Asia Pacific Dried Fruits and Edible Nuts Analysis and Outlook
11.1. Asia Pacific Dried Fruits and Edible Nuts Revenue (USD Million), and Revenue (USD Million) by Segments (2021-2032)
11.1.1. Asia Pacific Dried Fruits and Edible Nuts Revenue (USD Million) by Type (2021-2032)
11.1.2. Asia Pacific Dried Fruits and Edible Nuts Revenue (USD Million) by Application (2021-2032)
11.1.3. Asia Pacific Dried Fruits and Edible Nuts Revenue (USD Million) by Product (2021-2032)
By Type
Dried Fruits
Edible Nuts
By Application
Commercial
Household
Chapter 12. South America Dried Fruits and Edible Nuts Analysis and Outlook
12.1. South America Dried Fruits and Edible Nuts Revenue (USD Million), by Segments (2021-2032)
12.1.1. South America Dried Fruits and Edible Nuts Revenue (USD Million) by Type (2021-2032)
12.1.2. South America Dried Fruits and Edible Nuts Revenue (USD Million) by Application (2021-2032)
12.1.3. South America Dried Fruits and Edible Nuts Revenue (USD Million) by Product (2021-2032)
By Type
Dried Fruits
Edible Nuts
By Application
Commercial
Household
Chapter 13. Middle East and Africa Dried Fruits and Edible Nuts Analysis and Outlook
13.1. Middle East and Africa Dried Fruits and Edible Nuts Revenue (USD Million), by Segments (2021-2032)
13.1.1. Middle East and Africa Dried Fruits and Edible Nuts Revenue (USD Million) by Type (2021-2032)
13.1.2. Middle East and Africa Dried Fruits and Edible Nuts Revenue (USD Million) by Application (2021-2032)
13.1.3. Middle East and Africa Dried Fruits and Edible Nuts Revenue (USD Million) by Product (2021-2032)
By Type
Dried Fruits
Edible Nuts
By Application
Commercial
Household
Chapter 14. Dried Fruits and Edible Nuts Company Profiles
14.1 Business Overview
14.2 Product Profiles
14.3 SWOT Profiles
14.5 Recent Developments
14.6 Financial Profile
List of Companies
Archer Daniels Midland Company (ADM)
Arimex
Diamond Foods
Graceland
H.B.S. Foods
Hines Nut Company
Kanegrade
Olam International Ltd
Sunbeam Foods
Sun-Maid
15. Methodology and Data Sources
15.1 Customization Offerings
15.2 Subscription Services
15.3 Related Reports
15.4 Publisher Expertise
LIST OF TABLES
Table 1 Market Segmentation Analysis
Table 2 Global Dried Fruits and Edible Nuts Market Share of Leading Companies, 2023
Table 3 Product Offerings of Leading Companies
Table 4 Low Growth Scenario Forecasts
Table 5 Reference Case Growth Scenario
Table 6 High Growth Case Scenario
Table 7 Global Dried Fruits and Edible Nuts Revenue (USD Million) And CAGR (%) By Type (2021-2032)
Table 8 Global Dried Fruits and Edible Nuts Revenue (USD Million) And CAGR (%) By Application (2021-2032)
Table 9 Global Dried Fruits and Edible Nuts Revenue (USD Million) And CAGR (%) By Product (2021-2032)
Table 10 Global Dried Fruits and Edible Nuts Market Revenue (USD Million) By Regions (2021-2032)
Table 11 Global Dried Fruits and Edible Nuts Market Share (%) By Regions (2021-2032)
Table 12 North America Dried Fruits and Edible Nuts Revenue (USD Million) By Country (2021-2032)
Table 13 Europe Dried Fruits and Edible Nuts Revenue (USD Million) By Country (2021-2032)
Table 14 Asia Pacific Dried Fruits and Edible Nuts Revenue (USD Million) By Country (2021-2032)
Table 15 South America Dried Fruits and Edible Nuts Revenue (USD Million) By Country (2021-2032)
Table 16 Middle East and Africa Dried Fruits and Edible Nuts Revenue (USD Million) By Region (2021-2032)
Table 17 North America Dried Fruits and Edible Nuts Revenue (USD Million) By Type (2021-2032)
Table 18 North America Dried Fruits and Edible Nuts Revenue (USD Million) By Application (2021-2032)
Table 19 North America Dried Fruits and Edible Nuts Revenue (USD Million) By Product (2021-2032)
Table 20 Europe Dried Fruits and Edible Nuts Revenue (USD Million) By Type (2021-2032)
Table 21 Europe Dried Fruits and Edible Nuts Revenue (USD Million) By Application (2021-2032)
Table 22 Europe Dried Fruits and Edible Nuts Revenue (USD Million) By Product (2021-2032)
Table 23 Asia Pacific Dried Fruits and Edible Nuts Revenue (USD Million) By Type (2021-2032)
Table 24 Asia Pacific Dried Fruits and Edible Nuts Revenue (USD Million) By Application (2021-2032)
Table 25 Asia Pacific Dried Fruits and Edible Nuts Revenue (USD Million) By Product (2021-2032)
Table 26 South America Dried Fruits and Edible Nuts Revenue (USD Million) By Type (2021-2032)
Table 27 South America Dried Fruits and Edible Nuts Revenue (USD Million) By Application (2021-2032)
Table 28 South America Dried Fruits and Edible Nuts Revenue (USD Million) By Product (2021-2032)
Table 29 Middle East and Africa Dried Fruits and Edible Nuts Revenue (USD Million) By Type (2021-2032)
Table 30 Middle East and Africa Dried Fruits and Edible Nuts Revenue (USD Million) By Application (2021-2032)
Table 31 Middle East and Africa Dried Fruits and Edible Nuts Revenue (USD Million) By Product (2021-2032)
LIST OF FIGURES
Figure 1. Market Scope
Figure 2. Pricing Forecasts Per Unit, 2023- 2032
Figure 3. Porter’s Five Forces
Figure 4. Global Dried Fruits and Edible Nuts Market Revenue (USD Million) By Regions (2021-2032)
Figure 5. Global Dried Fruits and Edible Nuts Market Share (%) By Regions (2023)
Figure 6. North America Dried Fruits and Edible Nuts Revenue (USD Million) By Country (2021-2032)
Figure 7. United States Dried Fruits and Edible Nuts Revenue (USD Million) By Country (2021-2032)
Figure 8. Canada Dried Fruits and Edible Nuts Revenue (USD Million) By Country (2021-2032)
Figure 9. Mexico Dried Fruits and Edible Nuts Revenue (USD Million) By Country (2021-2032)
Figure 10. Europe Dried Fruits and Edible Nuts Revenue (USD Million) By Country (2021-2032)
Figure 11. Germany Dried Fruits and Edible Nuts Revenue (USD Million) By Country (2021-2032)
Figure 12. France Dried Fruits and Edible Nuts Revenue (USD Million) By Country (2021-2032)
Figure 13. United Kingdom Dried Fruits and Edible Nuts Revenue (USD Million) By Country (2021-2032)
Figure 14. Spain Dried Fruits and Edible Nuts Revenue (USD Million) By Country (2021-2032)
Figure 15. Italy Dried Fruits and Edible Nuts Revenue (USD Million) By Country (2021-2032)
Figure 16. Russia Dried Fruits and Edible Nuts Revenue (USD Million) By Country (2021-2032)
Figure 17. Rest of Europe Dried Fruits and Edible Nuts Revenue (USD Million) By Country (2021-2032)
Figure 11. Asia Pacific Dried Fruits and Edible Nuts Revenue (USD Million) By Country (2021-2032)
Figure 12. China Dried Fruits and Edible Nuts Revenue (USD Million) By Country (2021-2032)
Figure 13. Japan Dried Fruits and Edible Nuts Revenue (USD Million) By Country (2021-2032)
Figure 14. India Dried Fruits and Edible Nuts Revenue (USD Million) By Country (2021-2032)
Figure 15. South Korea Dried Fruits and Edible Nuts Revenue (USD Million) By Country (2021-2032)
Figure 16. Australia Dried Fruits and Edible Nuts Revenue (USD Million) By Country (2021-2032)
Figure 17. South East Asia Dried Fruits and Edible Nuts Revenue (USD Million) By Country (2021-2032)
Figure 18. South America Dried Fruits and Edible Nuts Revenue (USD Million) By Country (2021-2032)
Figure 19. Brazil Dried Fruits and Edible Nuts Revenue (USD Million) By Country (2021-2032)
Figure 20. Argentina Dried Fruits and Edible Nuts Revenue (USD Million) By Country (2021-2032)
Figure 21. Rest of Asia Pacific Dried Fruits and Edible Nuts Revenue (USD Million) By Country (2021-2032)
Figure 22. Middle East and Africa Dried Fruits and Edible Nuts Revenue (USD Million) By Region (2021-2032)
Figure 23. Saudi Arabia Dried Fruits and Edible Nuts Revenue (USD Million) By Region (2021-2032)
Figure 24. The UAE Dried Fruits and Edible Nuts Revenue (USD Million) By Region (2021-2032)
Figure 25. Rest of Middle East Dried Fruits and Edible Nuts Revenue (USD Million) By Region (2021-2032)
Figure 26. South Africa Dried Fruits and Edible Nuts Revenue (USD Million) By Region (2021-2032)
Figure 27. Africa Dried Fruits and Edible Nuts Revenue (USD Million) By Region (2021-2032)
Figure 28. North America Dried Fruits and Edible Nuts Revenue (USD Million) By Type (2021-2032)
Figure 29. North America Dried Fruits and Edible Nuts Revenue (USD Million) By Application (2021-2032)
Figure 30. North America Dried Fruits and Edible Nuts Revenue (USD Million) By Product (2021-2032)
Figure 31. Europe Dried Fruits and Edible Nuts Revenue (USD Million) By Type (2021-2032)
Figure 32. Europe Dried Fruits and Edible Nuts Revenue (USD Million) By Application (2021-2032)
Figure 33. Europe Dried Fruits and Edible Nuts Revenue (USD Million) By Product (2021-2032)
Figure 34. Asia Pacific Dried Fruits and Edible Nuts Revenue (USD Million) By Type (2021-2032)
Figure 35. Asia Pacific Dried Fruits and Edible Nuts Revenue (USD Million) By Application (2021-2032)
Figure 36. Asia Pacific Dried Fruits and Edible Nuts Revenue (USD Million) By Product (2021-2032)
Figure 37. South America Dried Fruits and Edible Nuts Revenue (USD Million) By Type (2021-2032)
Figure 38. South America Dried Fruits and Edible Nuts Revenue (USD Million) By Application (2021-2032)
Figure 39. South America Dried Fruits and Edible Nuts Revenue (USD Million) By Product (2021-2032)
Figure 40. Middle East and Africa Dried Fruits and Edible Nuts Revenue (USD Million) By Type (2021-2032)
Figure 41. Middle East and Africa Dried Fruits and Edible Nuts Revenue (USD Million) By Application (2021-2032)
Figure 42. Middle East and Africa Dried Fruits and Edible Nuts Revenue (USD Million) By Product (2021-2032)
By Type
Dried Fruits
Edible Nuts
By Application
Commercial
Household
Countries Analyzed
North America (US, Canada, Mexico)
Europe (Germany, UK, France, Spain, Italy, Russia, Rest of Europe)
Asia Pacific (China, India, Japan, South Korea, Australia, South East Asia, Rest of Asia)
South America (Brazil, Argentina, Rest of South America)
Middle East and Africa (Saudi Arabia, UAE, Rest of Middle East, South Africa, Egypt, Rest of Africa)
