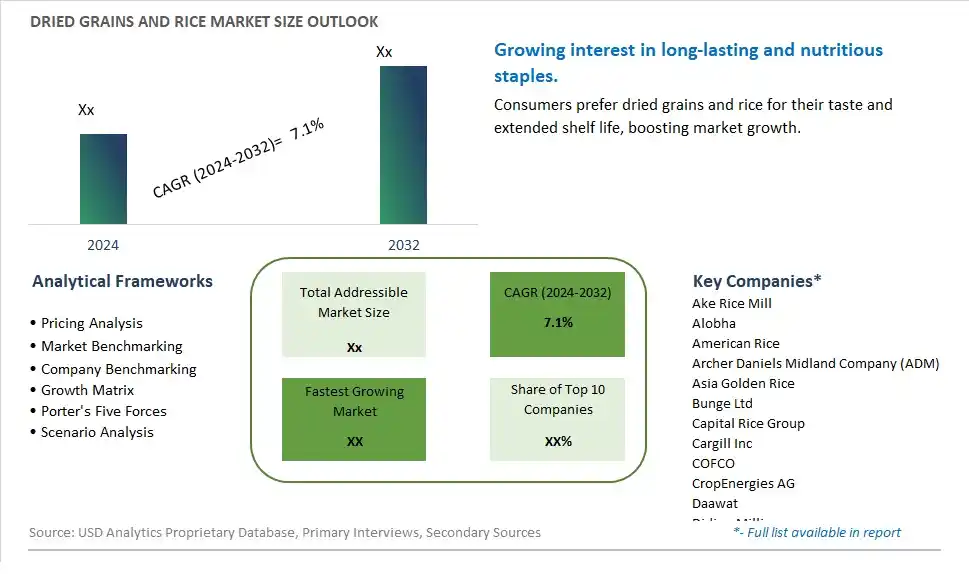
Global Dried Grains and Rice Market Size is valued at $XX Million in 2024 and is forecast to register a growth rate (CAGR) of 7.1% to reach $XX Million by 2032.
The global Dried Grains and Rice Market Comprehensive Study analyzes and forecasts the market size across 6 regions and 24 countries for diverse segments -By Type (Unmilled Rice, Parboiled Rice, Brown Rice, Fully Milled (White) Rice, Dried Beans, Chickpeas, Others), By Application (Household, Retails, Catering, Food Industrial, Others)
An Introduction to Dried Grains and Rice Market
The Dried Grains and Rice market in 2024 is witnessing steady growth, driven by the increasing demand for staple foods with long shelf life and easy storage. Dried grains and rice are essential components of diets worldwide, valued for their nutritional benefits and versatility in cooking. The market benefits from the rising trend of healthy eating and the growing popularity of whole grains and specialty rice varieties. Additionally, innovations in packaging and processing technologies are enhancing the quality and convenience of dried grains and rice products.
Dried Grains and Rice Competitive Landscape
The market report analyses the leading companies in the industry including Ake Rice Mill, Alobha, American Rice, Archer Daniels Midland Company (ADM), Asia Golden Rice, Bunge Ltd, Capital Rice Group, Cargill Inc, COFCO, CropEnergies AG, Daawat, Didion Milling, Flint Hills Resources LLC, Green Plains Inc, GreenField Global Inc, Gulf Rice Milling Inc, Husky Energy Inc, Kohinoor, KRBL Ltd, Lakshmi Group, Lal Qilla, Louis Dreyfus, Pacific Ethanol Inc, Poet LLC, Purina Animal Nutrition LLC, REI Agro Ltd, Thanasan Group, Valero Energy Corp , and Others.
Dried Grains and Rice Market Dynamics
Dried Grains and Rice Market Trend: Shift Towards Healthier and Whole Grain Options
A prominent trend in the dried grains and rice market is the shift towards healthier and whole grain options. Consumers are becoming more health-conscious and seeking products that offer higher nutritional value, such as whole grains and brown rice, over refined grains. This trend is driven by the growing awareness of the health benefits associated with whole grains, including increased fiber content, essential nutrients, and potential for reduced risk of chronic diseases. As a result, there is an increasing demand for dried grains and rice that retain their natural nutritional profile and are minimally processed.
Dried Grains and Rice Market Driver: Focus on Convenience and Long Shelf Life
A key driver influencing the dried grains and rice market is the focus on convenience and long shelf life. Consumers are looking for convenient food options that require minimal preparation and have a longer shelf life, making dried grains and rice an attractive choice. These products offer the benefit of extended storage without compromising on taste or quality, making them ideal for busy lifestyles and pantry stocking. The driver is fueled by the need for easy-to-cook meal solutions, the desire for pantry staples that can be stored for extended periods, and the versatility of dried grains and rice in various recipes and cuisines.
Dried Grains and Rice Market Opportunity: Innovation in Ready-to-Cook and Value-Added Products
An opportunity in the dried grains and rice market lies in innovation in ready-to-cook and value-added products. Manufacturers can capitalize on consumer demand for convenient meal solutions by offering pre-cooked or par-cooked dried grains and rice that require minimal preparation time. Additionally, there is an opportunity to introduce value-added products such as flavored rice blends, seasoned grains, and meal kits that incorporate dried grains and rice as primary ingredients. By focusing on flavor variety, nutritional enhancements, and packaging convenience, companies can attract new consumers and cater to evolving consumer preferences for easy-to-prepare, nutritious, and flavorful meal options. Collaborating with chefs, nutritionists, and food technologists can also facilitate product development and innovation, creating opportunities for market differentiation and growth within the dried grains and rice segment.
Dried Grains and Rice Market Share Analysis: Fully Milled (White) Rice segment generated the highest revenue share in the industry
The largest segment in the Dried Grains and Rice Market is Fully Milled (White) Rice. This type of rice undergoes milling processes that remove both the husk and bran layers, resulting in a polished, white appearance. Fully milled rice is a staple food in many cultures globally and is widely consumed due to its versatility, nutritional value, and extended shelf life. It is commonly used in various cuisines, including Asian, Mediterranean, and Latin American dishes, making it a popular choice among consumers worldwide. Additionally, fully milled rice is often preferred for its softer texture and quicker cooking time compared to other types of rice. Its widespread use in household cooking, restaurants, and food processing industries contributes significantly to its dominance as the largest segment in the Dried Grains and Rice Market.
Dried Grains and Rice Market Share Analysis: Food Industrial is the fastest growing segment over the forecast period to 2032
The Food Industrial segment is anticipated to be the fastest growing in the Dried Grains and Rice Market by 2032. This growth is fueled by several factors such as increasing demand for processed food products, convenience foods, and ready-to-eat meals globally. Food industries use dried grains and rice as key ingredients in a wide range of food products, including breakfast cereals, snacks, instant noodles, bakery items, and baby foods. The shift in consumer preferences towards healthier food options, coupled with advancements in food processing technologies, is driving the growth of the Food Industrial segment. Additionally, the expanding foodservice sector, catering to the rising demand for quick and convenient meals, further contributes to the rapid growth of dried grains and rice in food industrial applications. As food manufacturers continue to innovate and develop new products, the Food Industrial segment is poised to experience significant growth in the coming years.
Dried Grains and Rice Market Segmentation
By Type
Unmilled Rice
Parboiled Rice
Brown Rice
Fully Milled (White) Rice
Dried Beans
Chickpeas
Others
By Application
Household
Retails
Catering
Food Industrial
Others
Countries Analyzed
North America (US, Canada, Mexico)
Europe (Germany, UK, France, Spain, Italy, Russia, Rest of Europe)
Asia Pacific (China, India, Japan, South Korea, Australia, South East Asia, Rest of Asia)
South America (Brazil, Argentina, Rest of South America)
Middle East and Africa (Saudi Arabia, UAE, Rest of Middle East, South Africa, Egypt, Rest of Africa)
Dried Grains and Rice Companies Profiled in the Study
Ake Rice Mill
Alobha
American Rice
Archer Daniels Midland Company (ADM)
Asia Golden Rice
Bunge Ltd
Capital Rice Group
Cargill Inc
COFCO
CropEnergies AG
Daawat
Didion Milling
Flint Hills Resources LLC
Green Plains Inc
GreenField Global Inc
Gulf Rice Milling Inc
Husky Energy Inc
Kohinoor
KRBL Ltd
Lakshmi Group
Lal Qilla
Louis Dreyfus
Pacific Ethanol Inc
Poet LLC
Purina Animal Nutrition LLC
REI Agro Ltd
Thanasan Group
Valero Energy Corp
*- List Not Exhaustive
Chapter 1. TABLE OF CONTENTS
Chapter 2. Introduction to Dried Grains and Rice Market
2.1. Market Overview
2.2. Key Statistics and Report Highlights
2.3. Scope of the Comprehensive Study
2.3.1. Market Definition
2.3.2 Countries and Regions Covered
2.3.3 Research Objective
2.3.4 Units, Currency, and Conversions
2.3.5 Industry Value Chain
2.4. Key Market Segments
2.5. Key Companies
2.6. Study Period
Chapter 3. Strategic Analysis Review
3.1. Dried Grains and Rice Pricing Analysis and Forecast
3.2. Porter’s Five Forces
3.3. Market Ecosystem
3.4. SWOT Analysis
3.5. Regulatory Scenario
3.3. Effects of Inflation, Russia-Ukraine War, moderating economic growth, and other macroeconomic factors
Chapter 4. Competitive Landscape
4.1. Market Share Analysis
4.1.1. Global Dried Grains and Rice Market Share by Company, 2023
4.1.2. Product Offerings of Leading Dried Grains and Rice Companies
4.2. Market Entropy
4.2.1. New Product Launches in the Industry
4.2.2. Mergers, Acquisitions, Joint ventures, and Partnerships
4.3. Key Strategies and Best Practices
Chapter 5. Global Market Projections: Best, Reference, and Low Case Scenarios
5.1. Growth Analysis- Case Scenario Definitions
5.2. Low Growth Case Scenario Forecasts
5.3. Reference Growth Case Scenario Forecasts
5.4. High Growth Case Scenario Forecasts
Chapter 6. Market Dynamics
6.1. Dried Grains and Rice Market Drivers
6.2. Dried Grains and Rice Market Challenges
6.6. Dried Grains and Rice Market Opportunities
6.4. Dried Grains and Rice Market Trends
Chapter 7. Global Dried Grains and Rice Market Outlook Trends
7.1. Global Dried Grains and Rice Revenue (USD Million) and CAGR (%) by Type (2021-2032)
7.2. Global Dried Grains and Rice Revenue (USD Million) and CAGR (%) by Application (2021-2032)
7.3. Global Dried Grains and Rice Revenue (USD Million) and CAGR (%) by Product (2021-2032)
By Type
Unmilled Rice
Parboiled Rice
Brown Rice
Fully Milled (White) Rice
Dried Beans
Chickpeas
Others
By Application
Household
Retails
Catering
Food Industrial
Others
Chapter 8. Global Dried Grains and Rice Regional Analysis and Outlook
8.1. Global Dried Grains and Rice Revenue (USD Million) By Regions (2021- 2032)
8.2. North America Dried Grains and Rice Revenue (USD Million) by Country (2021-2032)
8.2.1. United States Dried Grains and Rice Regional Analysis and Outlook
8.2.2. Canada Dried Grains and Rice Regional Analysis and Outlook
8.2.3. Mexico Dried Grains and Rice Regional Analysis and Outlook
8.3. Europe Dried Grains and Rice Revenue (USD Million), by Country (2021-2032)
8.3.1. Germany Dried Grains and Rice Regional Analysis and Outlook
8.3.2. France Dried Grains and Rice Regional Analysis and Outlook
8.3.3. United Kingdom Dried Grains and Rice Regional Analysis and Outlook
8.3.4. Spain Dried Grains and Rice Regional Analysis and Outlook
8.3.5. Italy Dried Grains and Rice Regional Analysis and Outlook
8.3.6. Russia Dried Grains and Rice Regional Analysis and Outlook
8.3.7. Rest of Europe Dried Grains and Rice Regional Analysis and Outlook
8.4. Asia Pacific Dried Grains and Rice Revenue (USD Million) by Country (2021-2032)
8.4.1. China Dried Grains and Rice Regional Analysis and Outlook
8.4.2. Japan Dried Grains and Rice Regional Analysis and Outlook
8.4.3. India Dried Grains and Rice Regional Analysis and Outlook
8.4.4. South Korea Dried Grains and Rice Regional Analysis and Outlook
8.4.5. Australia Dried Grains and Rice Regional Analysis and Outlook
8.4.6. South East Asia Dried Grains and Rice Regional Analysis and Outlook
8.4.7. Rest of Asia Pacific Dried Grains and Rice Regional Analysis and Outlook
8.5. South America Dried Grains and Rice Revenue (USD Million), by Country (2021-2032)
8.5.1. Brazil Dried Grains and Rice Regional Analysis and Outlook
8.5.2. Argentina Dried Grains and Rice Regional Analysis and Outlook
8.5.3. Rest of South America Dried Grains and Rice Regional Analysis and Outlook
8.6. Middle East and Africa Dried Grains and Rice Revenue (USD Million) by Country (2021-2032)
8.6.1. Middle East Dried Grains and Rice Regional Analysis and Outlook
8.6.2. Africa Dried Grains and Rice Regional Analysis and Outlook
Chapter 9. North America Dried Grains and Rice Analysis and Outlook
9.1. North America Dried Grains and Rice Revenue (USD Million) by Segments (2021-2032)
9.1.1. North America Dried Grains and Rice Revenue (USD Million) by Type (2021-2032)
9.1.2. North America Dried Grains and Rice Revenue (USD Million) by Application (2021-2032)
9.1.3. North America Dried Grains and Rice Revenue (USD Million) by Product (2021-2032)
By Type
Unmilled Rice
Parboiled Rice
Brown Rice
Fully Milled (White) Rice
Dried Beans
Chickpeas
Others
By Application
Household
Retails
Catering
Food Industrial
Others
Chapter 10. Europe Dried Grains and Rice Analysis and Outlook
10.1. Europe Dried Grains and Rice Revenue (USD Million), by Segments (USD Million) (2021-2032)
10.1.1. Europe Dried Grains and Rice Revenue (USD Million) by Type (2021-2032)
10.1.2. Europe Dried Grains and Rice Revenue (USD Million) by Application (2021-2032)
10.1.3. Europe Dried Grains and Rice Revenue (USD Million) by Product (2021-2032)
By Type
Unmilled Rice
Parboiled Rice
Brown Rice
Fully Milled (White) Rice
Dried Beans
Chickpeas
Others
By Application
Household
Retails
Catering
Food Industrial
Others
Chapter 11. Asia Pacific Dried Grains and Rice Analysis and Outlook
11.1. Asia Pacific Dried Grains and Rice Revenue (USD Million), and Revenue (USD Million) by Segments (2021-2032)
11.1.1. Asia Pacific Dried Grains and Rice Revenue (USD Million) by Type (2021-2032)
11.1.2. Asia Pacific Dried Grains and Rice Revenue (USD Million) by Application (2021-2032)
11.1.3. Asia Pacific Dried Grains and Rice Revenue (USD Million) by Product (2021-2032)
By Type
Unmilled Rice
Parboiled Rice
Brown Rice
Fully Milled (White) Rice
Dried Beans
Chickpeas
Others
By Application
Household
Retails
Catering
Food Industrial
Others
Chapter 12. South America Dried Grains and Rice Analysis and Outlook
12.1. South America Dried Grains and Rice Revenue (USD Million), by Segments (2021-2032)
12.1.1. South America Dried Grains and Rice Revenue (USD Million) by Type (2021-2032)
12.1.2. South America Dried Grains and Rice Revenue (USD Million) by Application (2021-2032)
12.1.3. South America Dried Grains and Rice Revenue (USD Million) by Product (2021-2032)
By Type
Unmilled Rice
Parboiled Rice
Brown Rice
Fully Milled (White) Rice
Dried Beans
Chickpeas
Others
By Application
Household
Retails
Catering
Food Industrial
Others
Chapter 13. Middle East and Africa Dried Grains and Rice Analysis and Outlook
13.1. Middle East and Africa Dried Grains and Rice Revenue (USD Million), by Segments (2021-2032)
13.1.1. Middle East and Africa Dried Grains and Rice Revenue (USD Million) by Type (2021-2032)
13.1.2. Middle East and Africa Dried Grains and Rice Revenue (USD Million) by Application (2021-2032)
13.1.3. Middle East and Africa Dried Grains and Rice Revenue (USD Million) by Product (2021-2032)
By Type
Unmilled Rice
Parboiled Rice
Brown Rice
Fully Milled (White) Rice
Dried Beans
Chickpeas
Others
By Application
Household
Retails
Catering
Food Industrial
Others
Chapter 14. Dried Grains and Rice Company Profiles
14.1 Business Overview
14.2 Product Profiles
14.3 SWOT Profiles
14.5 Recent Developments
14.6 Financial Profile
List of Companies
Ake Rice Mill
Alobha
American Rice
Archer Daniels Midland Company (ADM)
Asia Golden Rice
Bunge Ltd
Capital Rice Group
Cargill Inc
COFCO
CropEnergies AG
Daawat
Didion Milling
Flint Hills Resources LLC
Green Plains Inc
GreenField Global Inc
Gulf Rice Milling Inc
Husky Energy Inc
Kohinoor
KRBL Ltd
Lakshmi Group
Lal Qilla
Louis Dreyfus
Pacific Ethanol Inc
Poet LLC
Purina Animal Nutrition LLC
REI Agro Ltd
Thanasan Group
Valero Energy Corp
15. Methodology and Data Sources
15.1 Customization Offerings
15.2 Subscription Services
15.3 Related Reports
15.4 Publisher Expertise
LIST OF TABLES
Table 1 Market Segmentation Analysis
Table 2 Global Dried Grains and Rice Market Share of Leading Companies, 2023
Table 3 Product Offerings of Leading Companies
Table 4 Low Growth Scenario Forecasts
Table 5 Reference Case Growth Scenario
Table 6 High Growth Case Scenario
Table 7 Global Dried Grains and Rice Revenue (USD Million) And CAGR (%) By Type (2021-2032)
Table 8 Global Dried Grains and Rice Revenue (USD Million) And CAGR (%) By Application (2021-2032)
Table 9 Global Dried Grains and Rice Revenue (USD Million) And CAGR (%) By Product (2021-2032)
Table 10 Global Dried Grains and Rice Market Revenue (USD Million) By Regions (2021-2032)
Table 11 Global Dried Grains and Rice Market Share (%) By Regions (2021-2032)
Table 12 North America Dried Grains and Rice Revenue (USD Million) By Country (2021-2032)
Table 13 Europe Dried Grains and Rice Revenue (USD Million) By Country (2021-2032)
Table 14 Asia Pacific Dried Grains and Rice Revenue (USD Million) By Country (2021-2032)
Table 15 South America Dried Grains and Rice Revenue (USD Million) By Country (2021-2032)
Table 16 Middle East and Africa Dried Grains and Rice Revenue (USD Million) By Region (2021-2032)
Table 17 North America Dried Grains and Rice Revenue (USD Million) By Type (2021-2032)
Table 18 North America Dried Grains and Rice Revenue (USD Million) By Application (2021-2032)
Table 19 North America Dried Grains and Rice Revenue (USD Million) By Product (2021-2032)
Table 20 Europe Dried Grains and Rice Revenue (USD Million) By Type (2021-2032)
Table 21 Europe Dried Grains and Rice Revenue (USD Million) By Application (2021-2032)
Table 22 Europe Dried Grains and Rice Revenue (USD Million) By Product (2021-2032)
Table 23 Asia Pacific Dried Grains and Rice Revenue (USD Million) By Type (2021-2032)
Table 24 Asia Pacific Dried Grains and Rice Revenue (USD Million) By Application (2021-2032)
Table 25 Asia Pacific Dried Grains and Rice Revenue (USD Million) By Product (2021-2032)
Table 26 South America Dried Grains and Rice Revenue (USD Million) By Type (2021-2032)
Table 27 South America Dried Grains and Rice Revenue (USD Million) By Application (2021-2032)
Table 28 South America Dried Grains and Rice Revenue (USD Million) By Product (2021-2032)
Table 29 Middle East and Africa Dried Grains and Rice Revenue (USD Million) By Type (2021-2032)
Table 30 Middle East and Africa Dried Grains and Rice Revenue (USD Million) By Application (2021-2032)
Table 31 Middle East and Africa Dried Grains and Rice Revenue (USD Million) By Product (2021-2032)
LIST OF FIGURES
Figure 1. Market Scope
Figure 2. Pricing Forecasts Per Unit, 2023- 2032
Figure 3. Porter’s Five Forces
Figure 4. Global Dried Grains and Rice Market Revenue (USD Million) By Regions (2021-2032)
Figure 5. Global Dried Grains and Rice Market Share (%) By Regions (2023)
Figure 6. North America Dried Grains and Rice Revenue (USD Million) By Country (2021-2032)
Figure 7. United States Dried Grains and Rice Revenue (USD Million) By Country (2021-2032)
Figure 8. Canada Dried Grains and Rice Revenue (USD Million) By Country (2021-2032)
Figure 9. Mexico Dried Grains and Rice Revenue (USD Million) By Country (2021-2032)
Figure 10. Europe Dried Grains and Rice Revenue (USD Million) By Country (2021-2032)
Figure 11. Germany Dried Grains and Rice Revenue (USD Million) By Country (2021-2032)
Figure 12. France Dried Grains and Rice Revenue (USD Million) By Country (2021-2032)
Figure 13. United Kingdom Dried Grains and Rice Revenue (USD Million) By Country (2021-2032)
Figure 14. Spain Dried Grains and Rice Revenue (USD Million) By Country (2021-2032)
Figure 15. Italy Dried Grains and Rice Revenue (USD Million) By Country (2021-2032)
Figure 16. Russia Dried Grains and Rice Revenue (USD Million) By Country (2021-2032)
Figure 17. Rest of Europe Dried Grains and Rice Revenue (USD Million) By Country (2021-2032)
Figure 11. Asia Pacific Dried Grains and Rice Revenue (USD Million) By Country (2021-2032)
Figure 12. China Dried Grains and Rice Revenue (USD Million) By Country (2021-2032)
Figure 13. Japan Dried Grains and Rice Revenue (USD Million) By Country (2021-2032)
Figure 14. India Dried Grains and Rice Revenue (USD Million) By Country (2021-2032)
Figure 15. South Korea Dried Grains and Rice Revenue (USD Million) By Country (2021-2032)
Figure 16. Australia Dried Grains and Rice Revenue (USD Million) By Country (2021-2032)
Figure 17. South East Asia Dried Grains and Rice Revenue (USD Million) By Country (2021-2032)
Figure 18. South America Dried Grains and Rice Revenue (USD Million) By Country (2021-2032)
Figure 19. Brazil Dried Grains and Rice Revenue (USD Million) By Country (2021-2032)
Figure 20. Argentina Dried Grains and Rice Revenue (USD Million) By Country (2021-2032)
Figure 21. Rest of Asia Pacific Dried Grains and Rice Revenue (USD Million) By Country (2021-2032)
Figure 22. Middle East and Africa Dried Grains and Rice Revenue (USD Million) By Region (2021-2032)
Figure 23. Saudi Arabia Dried Grains and Rice Revenue (USD Million) By Region (2021-2032)
Figure 24. The UAE Dried Grains and Rice Revenue (USD Million) By Region (2021-2032)
Figure 25. Rest of Middle East Dried Grains and Rice Revenue (USD Million) By Region (2021-2032)
Figure 26. South Africa Dried Grains and Rice Revenue (USD Million) By Region (2021-2032)
Figure 27. Africa Dried Grains and Rice Revenue (USD Million) By Region (2021-2032)
Figure 28. North America Dried Grains and Rice Revenue (USD Million) By Type (2021-2032)
Figure 29. North America Dried Grains and Rice Revenue (USD Million) By Application (2021-2032)
Figure 30. North America Dried Grains and Rice Revenue (USD Million) By Product (2021-2032)
Figure 31. Europe Dried Grains and Rice Revenue (USD Million) By Type (2021-2032)
Figure 32. Europe Dried Grains and Rice Revenue (USD Million) By Application (2021-2032)
Figure 33. Europe Dried Grains and Rice Revenue (USD Million) By Product (2021-2032)
Figure 34. Asia Pacific Dried Grains and Rice Revenue (USD Million) By Type (2021-2032)
Figure 35. Asia Pacific Dried Grains and Rice Revenue (USD Million) By Application (2021-2032)
Figure 36. Asia Pacific Dried Grains and Rice Revenue (USD Million) By Product (2021-2032)
Figure 37. South America Dried Grains and Rice Revenue (USD Million) By Type (2021-2032)
Figure 38. South America Dried Grains and Rice Revenue (USD Million) By Application (2021-2032)
Figure 39. South America Dried Grains and Rice Revenue (USD Million) By Product (2021-2032)
Figure 40. Middle East and Africa Dried Grains and Rice Revenue (USD Million) By Type (2021-2032)
Figure 41. Middle East and Africa Dried Grains and Rice Revenue (USD Million) By Application (2021-2032)
Figure 42. Middle East and Africa Dried Grains and Rice Revenue (USD Million) By Product (2021-2032)
By Type
Unmilled Rice
Parboiled Rice
Brown Rice
Fully Milled (White) Rice
Dried Beans
Chickpeas
Others
By Application
Household
Retails
Catering
Food Industrial
Others
Countries Analyzed
North America (US, Canada, Mexico)
Europe (Germany, UK, France, Spain, Italy, Russia, Rest of Europe)
Asia Pacific (China, India, Japan, South Korea, Australia, South East Asia, Rest of Asia)
South America (Brazil, Argentina, Rest of South America)
Middle East and Africa (Saudi Arabia, UAE, Rest of Middle East, South Africa, Egypt, Rest of Africa)
