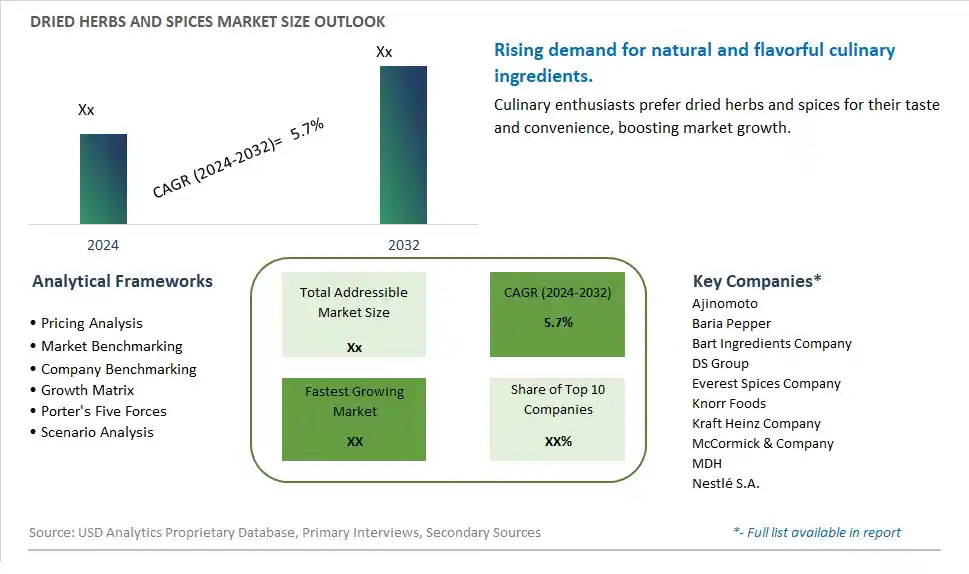
Global Dried Herbs and Spices Market Size is valued at $XX Million in 2024 and is forecast to register a growth rate (CAGR) of 5.7% to reach $XX Million by 2032.
The global Dried Herbs and Spices Market Comprehensive Study analyzes and forecasts the market size across 6 regions and 24 countries for diverse segments -By Type (Natural, Organic), By Application (Food, Medical)
An Introduction to Dried Herbs and Spices Market
The Dried Herbs and Spices market in 2024 is thriving, driven by the increasing demand for natural flavor enhancers in cooking and food preparation. Dried herbs and spices are valued for their concentrated flavor, long shelf life, and health benefits. The market benefits from the rising trend of home cooking and the growing popularity of global cuisines. Additionally, the increasing awareness of the medicinal properties of herbs and spices, along with the demand for organic and sustainably sourced products, is propelling market growth.
Dried Herbs and Spices Competitive Landscape
The market report analyses the leading companies in the industry including Ajinomoto, Baria Pepper, Bart Ingredients Company, DS Group, Everest Spices Company, Knorr Foods, Kraft Heinz Company, McCormick & Company, MDH, Nestlé S.A., and Others.
Dried Herbs and Spices Market Dynamics
Dried Herbs and Spices Market Trend: Growing Preference for Natural and Authentic Flavors
A prominent trend in the dried herbs and spices market is the growing preference for natural and authentic flavors. Consumers are seeking ingredients that enhance the taste and aroma of their dishes while also being free from artificial additives and preservatives. Dried herbs and spices offer a convenient way to add depth and complexity to culinary creations, appealing to home cooks and professional chefs alike. This trend is driven by the increasing interest in global cuisines, culinary experimentation, and the desire for healthier and cleaner ingredient labels.
Dried Herbs and Spices Market Driver: Rise in Home Cooking and Culinary Exploration
A key driver influencing the dried herbs and spices market is the rise in home cooking and culinary exploration. With more people cooking meals at home, there is a greater demand for pantry staples that can elevate the flavors of homemade dishes. Dried herbs and spices provide an easy and accessible way for consumers to experiment with different flavors, cuisines, and cooking techniques, enhancing their culinary skills and creating restaurant-quality meals at home. The driver is fueled by the popularity of cooking shows, food blogs, and social media platforms that inspire culinary creativity and encourage consumers to try new recipes and ingredients.
Dried Herbs and Spices Market Opportunity: Innovation in Organic and Specialty Varieties
An opportunity in the dried herbs and spices market lies in innovation in organic and specialty varieties. Manufacturers can capitalize on the growing preference for organic and sustainably sourced ingredients by offering certified organic dried herbs and spices. Additionally, there is an opportunity to introduce specialty varieties such as rare herbs, unique spice blends, and regional specialties that cater to specific culinary preferences and cultural influences. Collaborating with local farmers, herbalists, and culinary experts can help source high-quality ingredients, develop unique flavor profiles, and create differentiated products that appeal to discerning consumers seeking premium and authentic culinary experiences. Marketing strategies focused on the provenance, quality, and flavor potency of dried herbs and spices can also enhance brand appeal and drive market growth within the segment.
Dried Herbs and Spices Market Share Analysis: Natural Dried Herbs and Spices segment generated the highest revenue share in the industry
In the Dried Herbs and Spices Market, the largest segment is Natural Dried Herbs and Spices. This segment encompasses a wide variety of herbs and spices that are dried using traditional methods without the use of synthetic chemicals or pesticides. Natural dried herbs and spices are valued for their authentic flavors, aromas, and health benefits, making them a staple in culinary practices worldwide. They are widely used in cooking, baking, seasoning, and food preservation, enhancing the taste and nutritional profile of dishes. The growing consumer preference for natural and organic food products, coupled with the rising awareness regarding the health benefits of herbs and spices, drives the demand for natural dried herbs and spices. As a result, this segment experiences substantial growth and dominates the Dried Herbs and Spices Market due to its widespread usage across various food industries and culinary applications.
Dried Herbs and Spices Market Share Analysis: Food Industry is the fastest growing segment over the forecast period to 2032
The fastest-growing segment in the Dried Herbs and Spices Market, particularly within the Food application category, is witnessing significant expansion and demand surge. This surge is primarily driven by several factors. Firstly, there's an increasing consumer inclination towards healthier food choices, where natural herbs and spices play a pivotal role in enhancing flavor profiles without relying on artificial additives or excessive salt. Further, the rising popularity of ethnic cuisines and global flavors has propelled the demand for a diverse range of dried herbs and spices, including exotic varieties like saffron, sumac, and cardamom. In addition, the growing awareness about the health benefits of different herbs and spices, such as anti-inflammatory properties, antioxidant content, and digestive aids, has led to their incorporation into a wide array of food products. These trends, combined with the expanding food industry and the continuous innovation in food formulations, contribute to the rapid growth of dried herbs and spices in the food application segment, making it the fastest-growing segment in the Dried Herbs and Spices Market until 2032.
Dried Herbs and Spices Market Segmentation
By Type
Natural
Organic
By Application
Food
Medical
Countries Analyzed
North America (US, Canada, Mexico)
Europe (Germany, UK, France, Spain, Italy, Russia, Rest of Europe)
Asia Pacific (China, India, Japan, South Korea, Australia, South East Asia, Rest of Asia)
South America (Brazil, Argentina, Rest of South America)
Middle East and Africa (Saudi Arabia, UAE, Rest of Middle East, South Africa, Egypt, Rest of Africa)
Dried Herbs and Spices Companies Profiled in the Study
Ajinomoto
Baria Pepper
Bart Ingredients Company
DS Group
Everest Spices Company
Knorr Foods
Kraft Heinz Company
McCormick & Company
MDH
Nestlé S.A.
*- List Not Exhaustive
Chapter 1. TABLE OF CONTENTS
Chapter 2. Introduction to Dried Herbs and Spices Market
2.1. Market Overview
2.2. Key Statistics and Report Highlights
2.3. Scope of the Comprehensive Study
2.3.1. Market Definition
2.3.2 Countries and Regions Covered
2.3.3 Research Objective
2.3.4 Units, Currency, and Conversions
2.3.5 Industry Value Chain
2.4. Key Market Segments
2.5. Key Companies
2.6. Study Period
Chapter 3. Strategic Analysis Review
3.1. Dried Herbs and Spices Pricing Analysis and Forecast
3.2. Porter’s Five Forces
3.3. Market Ecosystem
3.4. SWOT Analysis
3.5. Regulatory Scenario
3.3. Effects of Inflation, Russia-Ukraine War, moderating economic growth, and other macroeconomic factors
Chapter 4. Competitive Landscape
4.1. Market Share Analysis
4.1.1. Global Dried Herbs and Spices Market Share by Company, 2023
4.1.2. Product Offerings of Leading Dried Herbs and Spices Companies
4.2. Market Entropy
4.2.1. New Product Launches in the Industry
4.2.2. Mergers, Acquisitions, Joint ventures, and Partnerships
4.3. Key Strategies and Best Practices
Chapter 5. Global Market Projections: Best, Reference, and Low Case Scenarios
5.1. Growth Analysis- Case Scenario Definitions
5.2. Low Growth Case Scenario Forecasts
5.3. Reference Growth Case Scenario Forecasts
5.4. High Growth Case Scenario Forecasts
Chapter 6. Market Dynamics
6.1. Dried Herbs and Spices Market Drivers
6.2. Dried Herbs and Spices Market Challenges
6.6. Dried Herbs and Spices Market Opportunities
6.4. Dried Herbs and Spices Market Trends
Chapter 7. Global Dried Herbs and Spices Market Outlook Trends
7.1. Global Dried Herbs and Spices Revenue (USD Million) and CAGR (%) by Type (2021-2032)
7.2. Global Dried Herbs and Spices Revenue (USD Million) and CAGR (%) by Application (2021-2032)
7.3. Global Dried Herbs and Spices Revenue (USD Million) and CAGR (%) by Product (2021-2032)
By Type
Natural
Organic
By Application
Food
Medical
Chapter 8. Global Dried Herbs and Spices Regional Analysis and Outlook
8.1. Global Dried Herbs and Spices Revenue (USD Million) By Regions (2021- 2032)
8.2. North America Dried Herbs and Spices Revenue (USD Million) by Country (2021-2032)
8.2.1. United States Dried Herbs and Spices Regional Analysis and Outlook
8.2.2. Canada Dried Herbs and Spices Regional Analysis and Outlook
8.2.3. Mexico Dried Herbs and Spices Regional Analysis and Outlook
8.3. Europe Dried Herbs and Spices Revenue (USD Million), by Country (2021-2032)
8.3.1. Germany Dried Herbs and Spices Regional Analysis and Outlook
8.3.2. France Dried Herbs and Spices Regional Analysis and Outlook
8.3.3. United Kingdom Dried Herbs and Spices Regional Analysis and Outlook
8.3.4. Spain Dried Herbs and Spices Regional Analysis and Outlook
8.3.5. Italy Dried Herbs and Spices Regional Analysis and Outlook
8.3.6. Russia Dried Herbs and Spices Regional Analysis and Outlook
8.3.7. Rest of Europe Dried Herbs and Spices Regional Analysis and Outlook
8.4. Asia Pacific Dried Herbs and Spices Revenue (USD Million) by Country (2021-2032)
8.4.1. China Dried Herbs and Spices Regional Analysis and Outlook
8.4.2. Japan Dried Herbs and Spices Regional Analysis and Outlook
8.4.3. India Dried Herbs and Spices Regional Analysis and Outlook
8.4.4. South Korea Dried Herbs and Spices Regional Analysis and Outlook
8.4.5. Australia Dried Herbs and Spices Regional Analysis and Outlook
8.4.6. South East Asia Dried Herbs and Spices Regional Analysis and Outlook
8.4.7. Rest of Asia Pacific Dried Herbs and Spices Regional Analysis and Outlook
8.5. South America Dried Herbs and Spices Revenue (USD Million), by Country (2021-2032)
8.5.1. Brazil Dried Herbs and Spices Regional Analysis and Outlook
8.5.2. Argentina Dried Herbs and Spices Regional Analysis and Outlook
8.5.3. Rest of South America Dried Herbs and Spices Regional Analysis and Outlook
8.6. Middle East and Africa Dried Herbs and Spices Revenue (USD Million) by Country (2021-2032)
8.6.1. Middle East Dried Herbs and Spices Regional Analysis and Outlook
8.6.2. Africa Dried Herbs and Spices Regional Analysis and Outlook
Chapter 9. North America Dried Herbs and Spices Analysis and Outlook
9.1. North America Dried Herbs and Spices Revenue (USD Million) by Segments (2021-2032)
9.1.1. North America Dried Herbs and Spices Revenue (USD Million) by Type (2021-2032)
9.1.2. North America Dried Herbs and Spices Revenue (USD Million) by Application (2021-2032)
9.1.3. North America Dried Herbs and Spices Revenue (USD Million) by Product (2021-2032)
By Type
Natural
Organic
By Application
Food
Medical
Chapter 10. Europe Dried Herbs and Spices Analysis and Outlook
10.1. Europe Dried Herbs and Spices Revenue (USD Million), by Segments (USD Million) (2021-2032)
10.1.1. Europe Dried Herbs and Spices Revenue (USD Million) by Type (2021-2032)
10.1.2. Europe Dried Herbs and Spices Revenue (USD Million) by Application (2021-2032)
10.1.3. Europe Dried Herbs and Spices Revenue (USD Million) by Product (2021-2032)
By Type
Natural
Organic
By Application
Food
Medical
Chapter 11. Asia Pacific Dried Herbs and Spices Analysis and Outlook
11.1. Asia Pacific Dried Herbs and Spices Revenue (USD Million), and Revenue (USD Million) by Segments (2021-2032)
11.1.1. Asia Pacific Dried Herbs and Spices Revenue (USD Million) by Type (2021-2032)
11.1.2. Asia Pacific Dried Herbs and Spices Revenue (USD Million) by Application (2021-2032)
11.1.3. Asia Pacific Dried Herbs and Spices Revenue (USD Million) by Product (2021-2032)
By Type
Natural
Organic
By Application
Food
Medical
Chapter 12. South America Dried Herbs and Spices Analysis and Outlook
12.1. South America Dried Herbs and Spices Revenue (USD Million), by Segments (2021-2032)
12.1.1. South America Dried Herbs and Spices Revenue (USD Million) by Type (2021-2032)
12.1.2. South America Dried Herbs and Spices Revenue (USD Million) by Application (2021-2032)
12.1.3. South America Dried Herbs and Spices Revenue (USD Million) by Product (2021-2032)
By Type
Natural
Organic
By Application
Food
Medical
Chapter 13. Middle East and Africa Dried Herbs and Spices Analysis and Outlook
13.1. Middle East and Africa Dried Herbs and Spices Revenue (USD Million), by Segments (2021-2032)
13.1.1. Middle East and Africa Dried Herbs and Spices Revenue (USD Million) by Type (2021-2032)
13.1.2. Middle East and Africa Dried Herbs and Spices Revenue (USD Million) by Application (2021-2032)
13.1.3. Middle East and Africa Dried Herbs and Spices Revenue (USD Million) by Product (2021-2032)
By Type
Natural
Organic
By Application
Food
Medical
Chapter 14. Dried Herbs and Spices Company Profiles
14.1 Business Overview
14.2 Product Profiles
14.3 SWOT Profiles
14.5 Recent Developments
14.6 Financial Profile
List of Companies
Ajinomoto
Baria Pepper
Bart Ingredients Company
DS Group
Everest Spices Company
Knorr Foods
Kraft Heinz Company
McCormick & Company
MDH
Nestlé S.A.
15. Methodology and Data Sources
15.1 Customization Offerings
15.2 Subscription Services
15.3 Related Reports
15.4 Publisher Expertise
LIST OF TABLES
Table 1 Market Segmentation Analysis
Table 2 Global Dried Herbs and Spices Market Share of Leading Companies, 2023
Table 3 Product Offerings of Leading Companies
Table 4 Low Growth Scenario Forecasts
Table 5 Reference Case Growth Scenario
Table 6 High Growth Case Scenario
Table 7 Global Dried Herbs and Spices Revenue (USD Million) And CAGR (%) By Type (2021-2032)
Table 8 Global Dried Herbs and Spices Revenue (USD Million) And CAGR (%) By Application (2021-2032)
Table 9 Global Dried Herbs and Spices Revenue (USD Million) And CAGR (%) By Product (2021-2032)
Table 10 Global Dried Herbs and Spices Market Revenue (USD Million) By Regions (2021-2032)
Table 11 Global Dried Herbs and Spices Market Share (%) By Regions (2021-2032)
Table 12 North America Dried Herbs and Spices Revenue (USD Million) By Country (2021-2032)
Table 13 Europe Dried Herbs and Spices Revenue (USD Million) By Country (2021-2032)
Table 14 Asia Pacific Dried Herbs and Spices Revenue (USD Million) By Country (2021-2032)
Table 15 South America Dried Herbs and Spices Revenue (USD Million) By Country (2021-2032)
Table 16 Middle East and Africa Dried Herbs and Spices Revenue (USD Million) By Region (2021-2032)
Table 17 North America Dried Herbs and Spices Revenue (USD Million) By Type (2021-2032)
Table 18 North America Dried Herbs and Spices Revenue (USD Million) By Application (2021-2032)
Table 19 North America Dried Herbs and Spices Revenue (USD Million) By Product (2021-2032)
Table 20 Europe Dried Herbs and Spices Revenue (USD Million) By Type (2021-2032)
Table 21 Europe Dried Herbs and Spices Revenue (USD Million) By Application (2021-2032)
Table 22 Europe Dried Herbs and Spices Revenue (USD Million) By Product (2021-2032)
Table 23 Asia Pacific Dried Herbs and Spices Revenue (USD Million) By Type (2021-2032)
Table 24 Asia Pacific Dried Herbs and Spices Revenue (USD Million) By Application (2021-2032)
Table 25 Asia Pacific Dried Herbs and Spices Revenue (USD Million) By Product (2021-2032)
Table 26 South America Dried Herbs and Spices Revenue (USD Million) By Type (2021-2032)
Table 27 South America Dried Herbs and Spices Revenue (USD Million) By Application (2021-2032)
Table 28 South America Dried Herbs and Spices Revenue (USD Million) By Product (2021-2032)
Table 29 Middle East and Africa Dried Herbs and Spices Revenue (USD Million) By Type (2021-2032)
Table 30 Middle East and Africa Dried Herbs and Spices Revenue (USD Million) By Application (2021-2032)
Table 31 Middle East and Africa Dried Herbs and Spices Revenue (USD Million) By Product (2021-2032)
LIST OF FIGURES
Figure 1. Market Scope
Figure 2. Pricing Forecasts Per Unit, 2023- 2032
Figure 3. Porter’s Five Forces
Figure 4. Global Dried Herbs and Spices Market Revenue (USD Million) By Regions (2021-2032)
Figure 5. Global Dried Herbs and Spices Market Share (%) By Regions (2023)
Figure 6. North America Dried Herbs and Spices Revenue (USD Million) By Country (2021-2032)
Figure 7. United States Dried Herbs and Spices Revenue (USD Million) By Country (2021-2032)
Figure 8. Canada Dried Herbs and Spices Revenue (USD Million) By Country (2021-2032)
Figure 9. Mexico Dried Herbs and Spices Revenue (USD Million) By Country (2021-2032)
Figure 10. Europe Dried Herbs and Spices Revenue (USD Million) By Country (2021-2032)
Figure 11. Germany Dried Herbs and Spices Revenue (USD Million) By Country (2021-2032)
Figure 12. France Dried Herbs and Spices Revenue (USD Million) By Country (2021-2032)
Figure 13. United Kingdom Dried Herbs and Spices Revenue (USD Million) By Country (2021-2032)
Figure 14. Spain Dried Herbs and Spices Revenue (USD Million) By Country (2021-2032)
Figure 15. Italy Dried Herbs and Spices Revenue (USD Million) By Country (2021-2032)
Figure 16. Russia Dried Herbs and Spices Revenue (USD Million) By Country (2021-2032)
Figure 17. Rest of Europe Dried Herbs and Spices Revenue (USD Million) By Country (2021-2032)
Figure 11. Asia Pacific Dried Herbs and Spices Revenue (USD Million) By Country (2021-2032)
Figure 12. China Dried Herbs and Spices Revenue (USD Million) By Country (2021-2032)
Figure 13. Japan Dried Herbs and Spices Revenue (USD Million) By Country (2021-2032)
Figure 14. India Dried Herbs and Spices Revenue (USD Million) By Country (2021-2032)
Figure 15. South Korea Dried Herbs and Spices Revenue (USD Million) By Country (2021-2032)
Figure 16. Australia Dried Herbs and Spices Revenue (USD Million) By Country (2021-2032)
Figure 17. South East Asia Dried Herbs and Spices Revenue (USD Million) By Country (2021-2032)
Figure 18. South America Dried Herbs and Spices Revenue (USD Million) By Country (2021-2032)
Figure 19. Brazil Dried Herbs and Spices Revenue (USD Million) By Country (2021-2032)
Figure 20. Argentina Dried Herbs and Spices Revenue (USD Million) By Country (2021-2032)
Figure 21. Rest of Asia Pacific Dried Herbs and Spices Revenue (USD Million) By Country (2021-2032)
Figure 22. Middle East and Africa Dried Herbs and Spices Revenue (USD Million) By Region (2021-2032)
Figure 23. Saudi Arabia Dried Herbs and Spices Revenue (USD Million) By Region (2021-2032)
Figure 24. The UAE Dried Herbs and Spices Revenue (USD Million) By Region (2021-2032)
Figure 25. Rest of Middle East Dried Herbs and Spices Revenue (USD Million) By Region (2021-2032)
Figure 26. South Africa Dried Herbs and Spices Revenue (USD Million) By Region (2021-2032)
Figure 27. Africa Dried Herbs and Spices Revenue (USD Million) By Region (2021-2032)
Figure 28. North America Dried Herbs and Spices Revenue (USD Million) By Type (2021-2032)
Figure 29. North America Dried Herbs and Spices Revenue (USD Million) By Application (2021-2032)
Figure 30. North America Dried Herbs and Spices Revenue (USD Million) By Product (2021-2032)
Figure 31. Europe Dried Herbs and Spices Revenue (USD Million) By Type (2021-2032)
Figure 32. Europe Dried Herbs and Spices Revenue (USD Million) By Application (2021-2032)
Figure 33. Europe Dried Herbs and Spices Revenue (USD Million) By Product (2021-2032)
Figure 34. Asia Pacific Dried Herbs and Spices Revenue (USD Million) By Type (2021-2032)
Figure 35. Asia Pacific Dried Herbs and Spices Revenue (USD Million) By Application (2021-2032)
Figure 36. Asia Pacific Dried Herbs and Spices Revenue (USD Million) By Product (2021-2032)
Figure 37. South America Dried Herbs and Spices Revenue (USD Million) By Type (2021-2032)
Figure 38. South America Dried Herbs and Spices Revenue (USD Million) By Application (2021-2032)
Figure 39. South America Dried Herbs and Spices Revenue (USD Million) By Product (2021-2032)
Figure 40. Middle East and Africa Dried Herbs and Spices Revenue (USD Million) By Type (2021-2032)
Figure 41. Middle East and Africa Dried Herbs and Spices Revenue (USD Million) By Application (2021-2032)
Figure 42. Middle East and Africa Dried Herbs and Spices Revenue (USD Million) By Product (2021-2032)
By Type
Natural
Organic
By Application
Food
Medical
Countries Analyzed
North America (US, Canada, Mexico)
Europe (Germany, UK, France, Spain, Italy, Russia, Rest of Europe)
Asia Pacific (China, India, Japan, South Korea, Australia, South East Asia, Rest of Asia)
South America (Brazil, Argentina, Rest of South America)
Middle East and Africa (Saudi Arabia, UAE, Rest of Middle East, South Africa, Egypt, Rest of Africa)
