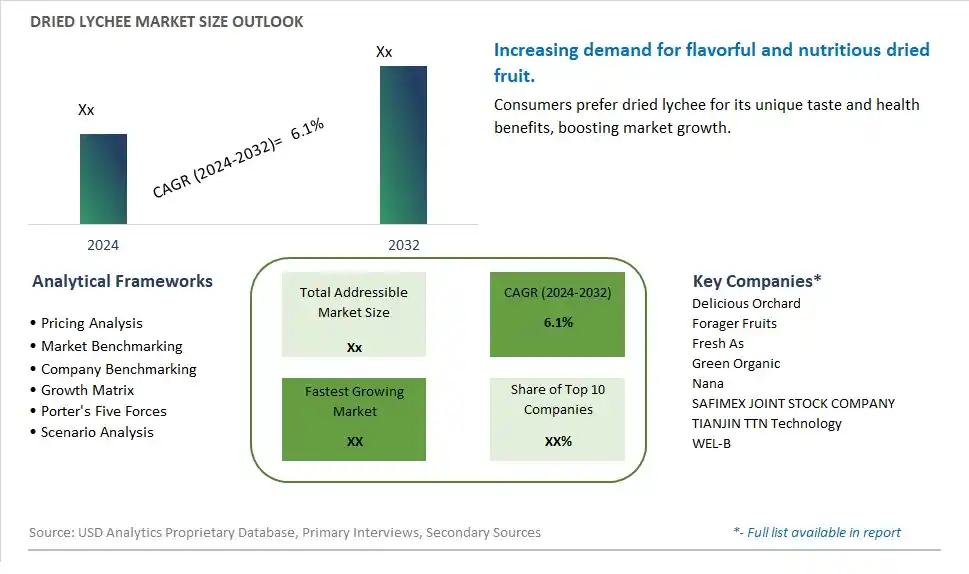
Global Dried Lychee Market Size is valued at $XX Million in 2024 and is forecast to register a growth rate (CAGR) of 6.1% to reach $XX Million by 2032.
The global Dried Lychee Market Comprehensive Study analyzes and forecasts the market size across 6 regions and 24 countries for diverse segments -By Processing Method (Baked Dried, Freeze Dried), By Type (Shelled, Unhulled), By Application (Direct Consumption, Candy and Snacks, Others)
An Introduction to Dried Lychee Market
The Dried Lychee market in 2024 is experiencing steady growth, driven by the increasing demand for unique and exotic fruit snacks. Dried lychee, known for its sweet flavor and rich nutritional profile, is gaining popularity in both domestic and international markets. The market benefits from advancements in drying technologies that enhance the shelf life and quality of the fruit. Additionally, the rising trend of healthy and natural snacks, along with the growing awareness of the health benefits of lychee, is contributing to the market's expansion.
Dried Lychee Competitive Landscape
The market report analyses the leading companies in the industry including Delicious Orchard, Forager Fruits, Fresh As, Green Organic, Nana, SAFIMEX JOINT STOCK COMPANY, TIANJIN TTN Technology, WEL-B, and Others.
Dried Lychee Market Dynamics
Dried Lychee Market Trend: Growing Interest in Exotic and Tropical Flavors
A prominent trend in the dried lychee market is the growing interest in exotic and tropical flavors. Consumers are increasingly seeking unique and adventurous taste experiences, driving the demand for fruits like dried lychee known for their distinct and sweet flavor profile. This trend is fueled by the popularity of global cuisines, multicultural food influences, and the desire for flavorful snacks and ingredients that transport consumers to tropical destinations through taste.
Dried Lychee Market Driver: Health and Wellness Focus Driving Demand for Nutrient-Dense Snacks
A key driver influencing the dried lychee market is the health and wellness focus driving demand for nutrient-dense snacks. Dried lychee is rich in vitamins, minerals, and antioxidants, making it a desirable snack choice for health-conscious consumers seeking natural and wholesome options. The driver is fueled by the increasing awareness of the health benefits of fruits, the emphasis on functional foods, and the preference for snacks that offer nutritional value without compromising on taste.
Dried Lychee Market Opportunity: Innovation in Flavor Combinations and Snack Formats
An opportunity in the dried lychee market lies in innovation in flavor combinations and snack formats. Manufacturers can capitalize on the unique taste of dried lychee by incorporating it into exotic flavor blends or combining it with other dried fruits, nuts, and seeds to create enticing snack mixes. There is also an opportunity to introduce dried lychee in various snack formats such as energy bars, trail mixes, yogurt toppings, and fruit-based desserts, catering to different snacking occasions and preferences. Collaborating with chefs, food scientists, and flavor experts can help develop innovative product formulations, enhance taste profiles, and create differentiated offerings that appeal to a wide range of consumers seeking adventurous and nutritious snack options. Marketing strategies highlighting the tropical flavor, nutritional benefits, and versatility of dried lychee can further enhance its market presence and drive consumer interest.
Dried Lychee Market Share Analysis: Direct Consumption is the fastest growing segment over the forecast period to 2032
The fastest-growing segment in the Dried Lychee Market is its application in Direct Consumption. This growth is fueled by several factors that underscore changing consumer preferences and market dynamics. Firstly, there is an increasing awareness and appreciation for healthy snacking options among consumers globally. Dried lychee, with its natural sweetness, unique flavor, and nutritional benefits, has gained popularity as a wholesome snack choice. It appeals to health-conscious consumers looking for alternatives to processed snacks with added sugars and artificial ingredients. Further, the convenience factor plays a significant role, as dried lychee can be conveniently consumed on-the-go, at work, or during leisure activities. Its long shelf life and portability make it a preferred option for consumers leading busy lifestyles. In addition, the rising demand for exotic and premium fruit-based snacks further drives the growth of dried lychee in the Direct Consumption segment. This trend is particularly pronounced in urban areas and among younger demographics seeking novel and healthy snacking experiences. These factors collectively contribute to the rapid growth of dried lychee in Direct Consumption, making it the fastest-growing segment in the Dried Lychee Market up to 2032.
Dried Lychee Market Segmentation
By Processing Method
Baked Dried
Freeze Dried
By Type
Shelled
Unhulled
By Application
Direct Consumption
Candy and Snacks
Others
Countries Analyzed
North America (US, Canada, Mexico)
Europe (Germany, UK, France, Spain, Italy, Russia, Rest of Europe)
Asia Pacific (China, India, Japan, South Korea, Australia, South East Asia, Rest of Asia)
South America (Brazil, Argentina, Rest of South America)
Middle East and Africa (Saudi Arabia, UAE, Rest of Middle East, South Africa, Egypt, Rest of Africa)
Dried Lychee Companies Profiled in the Study
Delicious Orchard
Forager Fruits
Fresh As
Green Organic
Nana
SAFIMEX JOINT STOCK COMPANY
TIANJIN TTN Technology
WEL-B
*- List Not Exhaustive
Chapter 1. TABLE OF CONTENTS
Chapter 2. Introduction to Dried Lychee Market
2.1. Market Overview
2.2. Key Statistics and Report Highlights
2.3. Scope of the Comprehensive Study
2.3.1. Market Definition
2.3.2 Countries and Regions Covered
2.3.3 Research Objective
2.3.4 Units, Currency, and Conversions
2.3.5 Industry Value Chain
2.4. Key Market Segments
2.5. Key Companies
2.6. Study Period
Chapter 3. Strategic Analysis Review
3.1. Dried Lychee Pricing Analysis and Forecast
3.2. Porter’s Five Forces
3.3. Market Ecosystem
3.4. SWOT Analysis
3.5. Regulatory Scenario
3.3. Effects of Inflation, Russia-Ukraine War, moderating economic growth, and other macroeconomic factors
Chapter 4. Competitive Landscape
4.1. Market Share Analysis
4.1.1. Global Dried Lychee Market Share by Company, 2023
4.1.2. Product Offerings of Leading Dried Lychee Companies
4.2. Market Entropy
4.2.1. New Product Launches in the Industry
4.2.2. Mergers, Acquisitions, Joint ventures, and Partnerships
4.3. Key Strategies and Best Practices
Chapter 5. Global Market Projections: Best, Reference, and Low Case Scenarios
5.1. Growth Analysis- Case Scenario Definitions
5.2. Low Growth Case Scenario Forecasts
5.3. Reference Growth Case Scenario Forecasts
5.4. High Growth Case Scenario Forecasts
Chapter 6. Market Dynamics
6.1. Dried Lychee Market Drivers
6.2. Dried Lychee Market Challenges
6.6. Dried Lychee Market Opportunities
6.4. Dried Lychee Market Trends
Chapter 7. Global Dried Lychee Market Outlook Trends
7.1. Global Dried Lychee Revenue (USD Million) and CAGR (%) by Type (2021-2032)
7.2. Global Dried Lychee Revenue (USD Million) and CAGR (%) by Application (2021-2032)
7.3. Global Dried Lychee Revenue (USD Million) and CAGR (%) by Product (2021-2032)
By Processing Method
Baked Dried
Freeze Dried
By Type
Shelled
Unhulled
By Application
Direct Consumption
Candy and Snacks
Others
Chapter 8. Global Dried Lychee Regional Analysis and Outlook
8.1. Global Dried Lychee Revenue (USD Million) By Regions (2021- 2032)
8.2. North America Dried Lychee Revenue (USD Million) by Country (2021-2032)
8.2.1. United States Dried Lychee Regional Analysis and Outlook
8.2.2. Canada Dried Lychee Regional Analysis and Outlook
8.2.3. Mexico Dried Lychee Regional Analysis and Outlook
8.3. Europe Dried Lychee Revenue (USD Million), by Country (2021-2032)
8.3.1. Germany Dried Lychee Regional Analysis and Outlook
8.3.2. France Dried Lychee Regional Analysis and Outlook
8.3.3. United Kingdom Dried Lychee Regional Analysis and Outlook
8.3.4. Spain Dried Lychee Regional Analysis and Outlook
8.3.5. Italy Dried Lychee Regional Analysis and Outlook
8.3.6. Russia Dried Lychee Regional Analysis and Outlook
8.3.7. Rest of Europe Dried Lychee Regional Analysis and Outlook
8.4. Asia Pacific Dried Lychee Revenue (USD Million) by Country (2021-2032)
8.4.1. China Dried Lychee Regional Analysis and Outlook
8.4.2. Japan Dried Lychee Regional Analysis and Outlook
8.4.3. India Dried Lychee Regional Analysis and Outlook
8.4.4. South Korea Dried Lychee Regional Analysis and Outlook
8.4.5. Australia Dried Lychee Regional Analysis and Outlook
8.4.6. South East Asia Dried Lychee Regional Analysis and Outlook
8.4.7. Rest of Asia Pacific Dried Lychee Regional Analysis and Outlook
8.5. South America Dried Lychee Revenue (USD Million), by Country (2021-2032)
8.5.1. Brazil Dried Lychee Regional Analysis and Outlook
8.5.2. Argentina Dried Lychee Regional Analysis and Outlook
8.5.3. Rest of South America Dried Lychee Regional Analysis and Outlook
8.6. Middle East and Africa Dried Lychee Revenue (USD Million) by Country (2021-2032)
8.6.1. Middle East Dried Lychee Regional Analysis and Outlook
8.6.2. Africa Dried Lychee Regional Analysis and Outlook
Chapter 9. North America Dried Lychee Analysis and Outlook
9.1. North America Dried Lychee Revenue (USD Million) by Segments (2021-2032)
9.1.1. North America Dried Lychee Revenue (USD Million) by Type (2021-2032)
9.1.2. North America Dried Lychee Revenue (USD Million) by Application (2021-2032)
9.1.3. North America Dried Lychee Revenue (USD Million) by Product (2021-2032)
By Processing Method
Baked Dried
Freeze Dried
By Type
Shelled
Unhulled
By Application
Direct Consumption
Candy and Snacks
Others
Chapter 10. Europe Dried Lychee Analysis and Outlook
10.1. Europe Dried Lychee Revenue (USD Million), by Segments (USD Million) (2021-2032)
10.1.1. Europe Dried Lychee Revenue (USD Million) by Type (2021-2032)
10.1.2. Europe Dried Lychee Revenue (USD Million) by Application (2021-2032)
10.1.3. Europe Dried Lychee Revenue (USD Million) by Product (2021-2032)
By Processing Method
Baked Dried
Freeze Dried
By Type
Shelled
Unhulled
By Application
Direct Consumption
Candy and Snacks
Others
Chapter 11. Asia Pacific Dried Lychee Analysis and Outlook
11.1. Asia Pacific Dried Lychee Revenue (USD Million), and Revenue (USD Million) by Segments (2021-2032)
11.1.1. Asia Pacific Dried Lychee Revenue (USD Million) by Type (2021-2032)
11.1.2. Asia Pacific Dried Lychee Revenue (USD Million) by Application (2021-2032)
11.1.3. Asia Pacific Dried Lychee Revenue (USD Million) by Product (2021-2032)
By Processing Method
Baked Dried
Freeze Dried
By Type
Shelled
Unhulled
By Application
Direct Consumption
Candy and Snacks
Others
Chapter 12. South America Dried Lychee Analysis and Outlook
12.1. South America Dried Lychee Revenue (USD Million), by Segments (2021-2032)
12.1.1. South America Dried Lychee Revenue (USD Million) by Type (2021-2032)
12.1.2. South America Dried Lychee Revenue (USD Million) by Application (2021-2032)
12.1.3. South America Dried Lychee Revenue (USD Million) by Product (2021-2032)
By Processing Method
Baked Dried
Freeze Dried
By Type
Shelled
Unhulled
By Application
Direct Consumption
Candy and Snacks
Others
Chapter 13. Middle East and Africa Dried Lychee Analysis and Outlook
13.1. Middle East and Africa Dried Lychee Revenue (USD Million), by Segments (2021-2032)
13.1.1. Middle East and Africa Dried Lychee Revenue (USD Million) by Type (2021-2032)
13.1.2. Middle East and Africa Dried Lychee Revenue (USD Million) by Application (2021-2032)
13.1.3. Middle East and Africa Dried Lychee Revenue (USD Million) by Product (2021-2032)
By Processing Method
Baked Dried
Freeze Dried
By Type
Shelled
Unhulled
By Application
Direct Consumption
Candy and Snacks
Others
Chapter 14. Dried Lychee Company Profiles
14.1 Business Overview
14.2 Product Profiles
14.3 SWOT Profiles
14.5 Recent Developments
14.6 Financial Profile
List of Companies
Delicious Orchard
Forager Fruits
Fresh As
Green Organic
Nana
SAFIMEX JOINT STOCK COMPANY
TIANJIN TTN Technology
WEL-B
15. Methodology and Data Sources
15.1 Customization Offerings
15.2 Subscription Services
15.3 Related Reports
15.4 Publisher Expertise
LIST OF TABLES
Table 1 Market Segmentation Analysis
Table 2 Global Dried Lychee Market Share of Leading Companies, 2023
Table 3 Product Offerings of Leading Companies
Table 4 Low Growth Scenario Forecasts
Table 5 Reference Case Growth Scenario
Table 6 High Growth Case Scenario
Table 7 Global Dried Lychee Revenue (USD Million) And CAGR (%) By Type (2021-2032)
Table 8 Global Dried Lychee Revenue (USD Million) And CAGR (%) By Application (2021-2032)
Table 9 Global Dried Lychee Revenue (USD Million) And CAGR (%) By Product (2021-2032)
Table 10 Global Dried Lychee Market Revenue (USD Million) By Regions (2021-2032)
Table 11 Global Dried Lychee Market Share (%) By Regions (2021-2032)
Table 12 North America Dried Lychee Revenue (USD Million) By Country (2021-2032)
Table 13 Europe Dried Lychee Revenue (USD Million) By Country (2021-2032)
Table 14 Asia Pacific Dried Lychee Revenue (USD Million) By Country (2021-2032)
Table 15 South America Dried Lychee Revenue (USD Million) By Country (2021-2032)
Table 16 Middle East and Africa Dried Lychee Revenue (USD Million) By Region (2021-2032)
Table 17 North America Dried Lychee Revenue (USD Million) By Type (2021-2032)
Table 18 North America Dried Lychee Revenue (USD Million) By Application (2021-2032)
Table 19 North America Dried Lychee Revenue (USD Million) By Product (2021-2032)
Table 20 Europe Dried Lychee Revenue (USD Million) By Type (2021-2032)
Table 21 Europe Dried Lychee Revenue (USD Million) By Application (2021-2032)
Table 22 Europe Dried Lychee Revenue (USD Million) By Product (2021-2032)
Table 23 Asia Pacific Dried Lychee Revenue (USD Million) By Type (2021-2032)
Table 24 Asia Pacific Dried Lychee Revenue (USD Million) By Application (2021-2032)
Table 25 Asia Pacific Dried Lychee Revenue (USD Million) By Product (2021-2032)
Table 26 South America Dried Lychee Revenue (USD Million) By Type (2021-2032)
Table 27 South America Dried Lychee Revenue (USD Million) By Application (2021-2032)
Table 28 South America Dried Lychee Revenue (USD Million) By Product (2021-2032)
Table 29 Middle East and Africa Dried Lychee Revenue (USD Million) By Type (2021-2032)
Table 30 Middle East and Africa Dried Lychee Revenue (USD Million) By Application (2021-2032)
Table 31 Middle East and Africa Dried Lychee Revenue (USD Million) By Product (2021-2032)
LIST OF FIGURES
Figure 1. Market Scope
Figure 2. Pricing Forecasts Per Unit, 2023- 2032
Figure 3. Porter’s Five Forces
Figure 4. Global Dried Lychee Market Revenue (USD Million) By Regions (2021-2032)
Figure 5. Global Dried Lychee Market Share (%) By Regions (2023)
Figure 6. North America Dried Lychee Revenue (USD Million) By Country (2021-2032)
Figure 7. United States Dried Lychee Revenue (USD Million) By Country (2021-2032)
Figure 8. Canada Dried Lychee Revenue (USD Million) By Country (2021-2032)
Figure 9. Mexico Dried Lychee Revenue (USD Million) By Country (2021-2032)
Figure 10. Europe Dried Lychee Revenue (USD Million) By Country (2021-2032)
Figure 11. Germany Dried Lychee Revenue (USD Million) By Country (2021-2032)
Figure 12. France Dried Lychee Revenue (USD Million) By Country (2021-2032)
Figure 13. United Kingdom Dried Lychee Revenue (USD Million) By Country (2021-2032)
Figure 14. Spain Dried Lychee Revenue (USD Million) By Country (2021-2032)
Figure 15. Italy Dried Lychee Revenue (USD Million) By Country (2021-2032)
Figure 16. Russia Dried Lychee Revenue (USD Million) By Country (2021-2032)
Figure 17. Rest of Europe Dried Lychee Revenue (USD Million) By Country (2021-2032)
Figure 11. Asia Pacific Dried Lychee Revenue (USD Million) By Country (2021-2032)
Figure 12. China Dried Lychee Revenue (USD Million) By Country (2021-2032)
Figure 13. Japan Dried Lychee Revenue (USD Million) By Country (2021-2032)
Figure 14. India Dried Lychee Revenue (USD Million) By Country (2021-2032)
Figure 15. South Korea Dried Lychee Revenue (USD Million) By Country (2021-2032)
Figure 16. Australia Dried Lychee Revenue (USD Million) By Country (2021-2032)
Figure 17. South East Asia Dried Lychee Revenue (USD Million) By Country (2021-2032)
Figure 18. South America Dried Lychee Revenue (USD Million) By Country (2021-2032)
Figure 19. Brazil Dried Lychee Revenue (USD Million) By Country (2021-2032)
Figure 20. Argentina Dried Lychee Revenue (USD Million) By Country (2021-2032)
Figure 21. Rest of Asia Pacific Dried Lychee Revenue (USD Million) By Country (2021-2032)
Figure 22. Middle East and Africa Dried Lychee Revenue (USD Million) By Region (2021-2032)
Figure 23. Saudi Arabia Dried Lychee Revenue (USD Million) By Region (2021-2032)
Figure 24. The UAE Dried Lychee Revenue (USD Million) By Region (2021-2032)
Figure 25. Rest of Middle East Dried Lychee Revenue (USD Million) By Region (2021-2032)
Figure 26. South Africa Dried Lychee Revenue (USD Million) By Region (2021-2032)
Figure 27. Africa Dried Lychee Revenue (USD Million) By Region (2021-2032)
Figure 28. North America Dried Lychee Revenue (USD Million) By Type (2021-2032)
Figure 29. North America Dried Lychee Revenue (USD Million) By Application (2021-2032)
Figure 30. North America Dried Lychee Revenue (USD Million) By Product (2021-2032)
Figure 31. Europe Dried Lychee Revenue (USD Million) By Type (2021-2032)
Figure 32. Europe Dried Lychee Revenue (USD Million) By Application (2021-2032)
Figure 33. Europe Dried Lychee Revenue (USD Million) By Product (2021-2032)
Figure 34. Asia Pacific Dried Lychee Revenue (USD Million) By Type (2021-2032)
Figure 35. Asia Pacific Dried Lychee Revenue (USD Million) By Application (2021-2032)
Figure 36. Asia Pacific Dried Lychee Revenue (USD Million) By Product (2021-2032)
Figure 37. South America Dried Lychee Revenue (USD Million) By Type (2021-2032)
Figure 38. South America Dried Lychee Revenue (USD Million) By Application (2021-2032)
Figure 39. South America Dried Lychee Revenue (USD Million) By Product (2021-2032)
Figure 40. Middle East and Africa Dried Lychee Revenue (USD Million) By Type (2021-2032)
Figure 41. Middle East and Africa Dried Lychee Revenue (USD Million) By Application (2021-2032)
Figure 42. Middle East and Africa Dried Lychee Revenue (USD Million) By Product (2021-2032)
By Processing Method
Baked Dried
Freeze Dried
By Type
Shelled
Unhulled
By Application
Direct Consumption
Candy and Snacks
Others
Countries Analyzed
North America (US, Canada, Mexico)
Europe (Germany, UK, France, Spain, Italy, Russia, Rest of Europe)
Asia Pacific (China, India, Japan, South Korea, Australia, South East Asia, Rest of Asia)
South America (Brazil, Argentina, Rest of South America)
Middle East and Africa (Saudi Arabia, UAE, Rest of Middle East, South Africa, Egypt, Rest of Africa)
