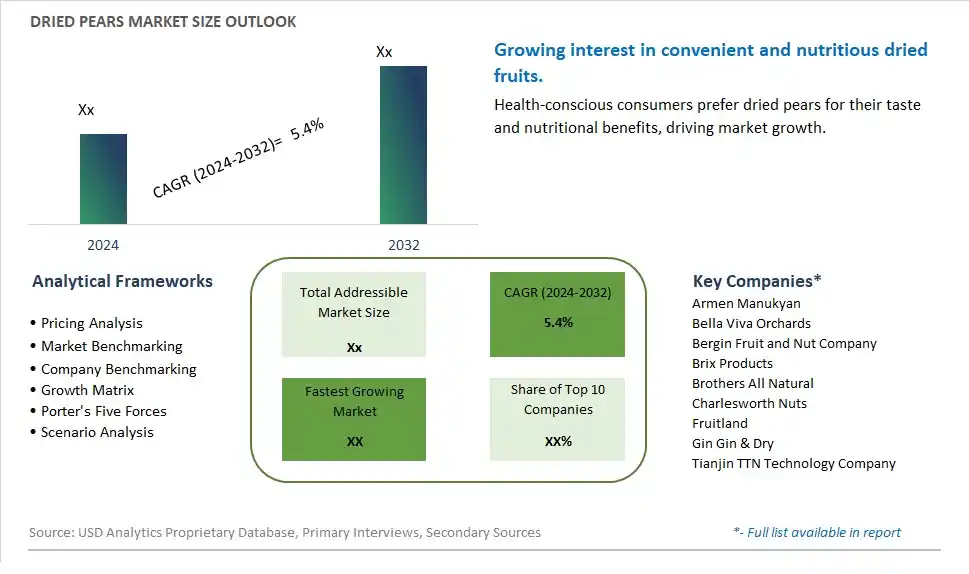
Global Dried Pears Market Size is valued at $XX Million in 2024 and is forecast to register a growth rate (CAGR) of 5.4% to reach $XX Million by 2032.
The global Dried Pears Market Comprehensive Study analyzes and forecasts the market size across 6 regions and 24 countries for diverse segments -By Type (Baked Dried, Freeze Dried), By Application (Direct Consumption, Candy and Snacks, Others)
An Introduction to Dried Pears Market
The Dried Pears market in 2024 is experiencing steady growth, driven by the rising demand for nutritious and natural fruit snacks. Dried pears, known for their sweet flavor and high fiber content, are gaining popularity among health-conscious consumers. The market benefits from advancements in drying technologies that preserve the fruit's nutritional value and taste. Additionally, the increasing trend of healthy snacking and the growing popularity of plant-based diets are contributing to the market's expansion.
Dried Pears Competitive Landscape
The market report analyses the leading companies in the industry including Armen Manukyan, Bella Viva Orchards, Bergin Fruit and Nut Company, Brix Products, Brothers All Natural, Charlesworth Nuts, Fruitland, Gin Gin & Dry, Tianjin TTN Technology Company, and Others.
Dried Pears Market Dynamics
Dried Pears Market Trend: Growing Popularity of Natural and Organic Snacks
The dried pears market is experiencing a notable trend towards natural and organic snacks. Consumers are increasingly prioritizing health and wellness, seeking out snacks that are free from artificial additives, preservatives, and GMOs. Dried pears, which offer a natural source of fiber, vitamins, and antioxidants, align perfectly with this consumer preference. The trend is particularly strong among millennials and Gen Z consumers who are more inclined towards clean eating and sustainability. Organic dried pears, in particular, are gaining traction as they cater to the demand for products grown without synthetic pesticides or fertilizers, thus promoting a healthier lifestyle and environmentally friendly consumption habits.
Dried Pears Market Driver: Increasing Demand for Convenient and Healthy Snacks
The primary driver for the dried pears market is the rising demand for convenient and healthy snacking options. As busy lifestyles become the norm, consumers are looking for snacks that are not only easy to carry and consume on-the-go but also provide nutritional benefits. Dried pears meet these criteria by offering a quick, nutritious, and satisfying snack that can be enjoyed anywhere. The growing awareness of the health benefits associated with consuming fruits, such as improved digestion and reduced risk of chronic diseases, further drives the demand for dried pears. Marketing campaigns emphasizing the health benefits of dried pears and their role in a balanced diet are also instrumental in boosting consumer demand.
Dried Pears Market Opportunity: Product Diversification and Innovation
The dried pears market holds significant opportunities for product diversification and innovation. By introducing new product variants, such as flavored dried pears, organic options, and convenient packaging formats, companies can attract a broader consumer base. There is also potential for developing value-added products, such as dried pear-based snacks combined with nuts or chocolate, which can cater to the premium segment of the market. Additionally, exploring new distribution channels, including online platforms and health food stores, can enhance product visibility and accessibility. Collaborations with culinary experts to create gourmet dried pear snacks and leveraging social media for targeted marketing campaigns can further drive market growth and consumer engagement.
Dried Pears Market Share Analysis: Baked Dried segment generated the highest revenue share in the industry
The largest segment in the Dried Pears Market is categorized as "Baked Dried." Baked dried pears are prepared by dehydrating fresh pears in an oven or dehydrator, resulting in a chewy and flavorful dried fruit with a concentrated sweetness. This segment holds a significant share in the market due to several factors driving its popularity and demand. Firstly, baked dried pears retain a considerable amount of their natural sweetness and flavor, making them a delicious and healthy snack option for consumers seeking natural alternatives. The baking process also enhances the pears' texture, giving them a chewy consistency that adds to their appeal as a snack or ingredient in various recipes. Further, baked dried pears have an extended shelf life compared to fresh pears, allowing for longer storage without compromising taste or quality. This longer shelf life makes them a convenient pantry staple for consumers looking for nutritious and flavorful snacks that can be enjoyed anytime. Additionally, baked dried pears are versatile and can be used in a variety of culinary applications, including snacking, baking, and as an ingredient in salads, cereals, and desserts.
Dried Pears Market Share Analysis: Direct Consumption is the fastest growing segment over the forecast period to 2032
The fastest-growing segment in the Dried Pears Market is its application in "Direct Consumption." This segment is experiencing rapid growth driven by several key factors influencing consumer preferences and market trends. Firstly, there is a growing consumer interest in healthy and natural snack options, leading to an increased demand for dried fruits like pears that offer nutritional benefits and wholesome snacking experiences. Baked dried pears, in particular, are gaining popularity among health-conscious consumers due to their natural sweetness, fiber content, and various vitamins and minerals. They are perceived as a convenient and nutritious snack choice that can be enjoyed on-the-go or as part of a balanced diet. Further, the shift towards healthier eating habits and wellness-focused lifestyles is driving the demand for snacks that provide energy, satiety, and nutritional value without compromising taste. Baked dried pears fulfill these criteria, making them a preferred choice for consumers looking for guilt-free snacking options. As a result, the Direct Consumption application segment for dried pears is witnessing robust growth and is expected to continue expanding as health and wellness trends continue to influence consumer behavior.
Dried Pears Market Segmentation
By Type
Baked Dried
Freeze Dried
By Application
Direct Consumption
Candy and Snacks
Others
Countries Analyzed
North America (US, Canada, Mexico)
Europe (Germany, UK, France, Spain, Italy, Russia, Rest of Europe)
Asia Pacific (China, India, Japan, South Korea, Australia, South East Asia, Rest of Asia)
South America (Brazil, Argentina, Rest of South America)
Middle East and Africa (Saudi Arabia, UAE, Rest of Middle East, South Africa, Egypt, Rest of Africa)
Dried Pears Companies Profiled in the Study
Armen Manukyan
Bella Viva Orchards
Bergin Fruit and Nut Company
Brix Products
Brothers All Natural
Charlesworth Nuts
Fruitland
Gin Gin & Dry
Tianjin TTN Technology Company
*- List Not Exhaustive
Chapter 1. TABLE OF CONTENTS
Chapter 2. Introduction to Dried Pears Market
2.1. Market Overview
2.2. Key Statistics and Report Highlights
2.3. Scope of the Comprehensive Study
2.3.1. Market Definition
2.3.2 Countries and Regions Covered
2.3.3 Research Objective
2.3.4 Units, Currency, and Conversions
2.3.5 Industry Value Chain
2.4. Key Market Segments
2.5. Key Companies
2.6. Study Period
Chapter 3. Strategic Analysis Review
3.1. Dried Pears Pricing Analysis and Forecast
3.2. Porter’s Five Forces
3.3. Market Ecosystem
3.4. SWOT Analysis
3.5. Regulatory Scenario
3.3. Effects of Inflation, Russia-Ukraine War, moderating economic growth, and other macroeconomic factors
Chapter 4. Competitive Landscape
4.1. Market Share Analysis
4.1.1. Global Dried Pears Market Share by Company, 2023
4.1.2. Product Offerings of Leading Dried Pears Companies
4.2. Market Entropy
4.2.1. New Product Launches in the Industry
4.2.2. Mergers, Acquisitions, Joint ventures, and Partnerships
4.3. Key Strategies and Best Practices
Chapter 5. Global Market Projections: Best, Reference, and Low Case Scenarios
5.1. Growth Analysis- Case Scenario Definitions
5.2. Low Growth Case Scenario Forecasts
5.3. Reference Growth Case Scenario Forecasts
5.4. High Growth Case Scenario Forecasts
Chapter 6. Market Dynamics
6.1. Dried Pears Market Drivers
6.2. Dried Pears Market Challenges
6.6. Dried Pears Market Opportunities
6.4. Dried Pears Market Trends
Chapter 7. Global Dried Pears Market Outlook Trends
7.1. Global Dried Pears Revenue (USD Million) and CAGR (%) by Type (2021-2032)
7.2. Global Dried Pears Revenue (USD Million) and CAGR (%) by Application (2021-2032)
7.3. Global Dried Pears Revenue (USD Million) and CAGR (%) by Product (2021-2032)
By Type
Baked Dried
Freeze Dried
By Application
Direct Consumption
Candy and Snacks
Others
Chapter 8. Global Dried Pears Regional Analysis and Outlook
8.1. Global Dried Pears Revenue (USD Million) By Regions (2021- 2032)
8.2. North America Dried Pears Revenue (USD Million) by Country (2021-2032)
8.2.1. United States Dried Pears Regional Analysis and Outlook
8.2.2. Canada Dried Pears Regional Analysis and Outlook
8.2.3. Mexico Dried Pears Regional Analysis and Outlook
8.3. Europe Dried Pears Revenue (USD Million), by Country (2021-2032)
8.3.1. Germany Dried Pears Regional Analysis and Outlook
8.3.2. France Dried Pears Regional Analysis and Outlook
8.3.3. United Kingdom Dried Pears Regional Analysis and Outlook
8.3.4. Spain Dried Pears Regional Analysis and Outlook
8.3.5. Italy Dried Pears Regional Analysis and Outlook
8.3.6. Russia Dried Pears Regional Analysis and Outlook
8.3.7. Rest of Europe Dried Pears Regional Analysis and Outlook
8.4. Asia Pacific Dried Pears Revenue (USD Million) by Country (2021-2032)
8.4.1. China Dried Pears Regional Analysis and Outlook
8.4.2. Japan Dried Pears Regional Analysis and Outlook
8.4.3. India Dried Pears Regional Analysis and Outlook
8.4.4. South Korea Dried Pears Regional Analysis and Outlook
8.4.5. Australia Dried Pears Regional Analysis and Outlook
8.4.6. South East Asia Dried Pears Regional Analysis and Outlook
8.4.7. Rest of Asia Pacific Dried Pears Regional Analysis and Outlook
8.5. South America Dried Pears Revenue (USD Million), by Country (2021-2032)
8.5.1. Brazil Dried Pears Regional Analysis and Outlook
8.5.2. Argentina Dried Pears Regional Analysis and Outlook
8.5.3. Rest of South America Dried Pears Regional Analysis and Outlook
8.6. Middle East and Africa Dried Pears Revenue (USD Million) by Country (2021-2032)
8.6.1. Middle East Dried Pears Regional Analysis and Outlook
8.6.2. Africa Dried Pears Regional Analysis and Outlook
Chapter 9. North America Dried Pears Analysis and Outlook
9.1. North America Dried Pears Revenue (USD Million) by Segments (2021-2032)
9.1.1. North America Dried Pears Revenue (USD Million) by Type (2021-2032)
9.1.2. North America Dried Pears Revenue (USD Million) by Application (2021-2032)
9.1.3. North America Dried Pears Revenue (USD Million) by Product (2021-2032)
By Type
Baked Dried
Freeze Dried
By Application
Direct Consumption
Candy and Snacks
Others
Chapter 10. Europe Dried Pears Analysis and Outlook
10.1. Europe Dried Pears Revenue (USD Million), by Segments (USD Million) (2021-2032)
10.1.1. Europe Dried Pears Revenue (USD Million) by Type (2021-2032)
10.1.2. Europe Dried Pears Revenue (USD Million) by Application (2021-2032)
10.1.3. Europe Dried Pears Revenue (USD Million) by Product (2021-2032)
By Type
Baked Dried
Freeze Dried
By Application
Direct Consumption
Candy and Snacks
Others
Chapter 11. Asia Pacific Dried Pears Analysis and Outlook
11.1. Asia Pacific Dried Pears Revenue (USD Million), and Revenue (USD Million) by Segments (2021-2032)
11.1.1. Asia Pacific Dried Pears Revenue (USD Million) by Type (2021-2032)
11.1.2. Asia Pacific Dried Pears Revenue (USD Million) by Application (2021-2032)
11.1.3. Asia Pacific Dried Pears Revenue (USD Million) by Product (2021-2032)
By Type
Baked Dried
Freeze Dried
By Application
Direct Consumption
Candy and Snacks
Others
Chapter 12. South America Dried Pears Analysis and Outlook
12.1. South America Dried Pears Revenue (USD Million), by Segments (2021-2032)
12.1.1. South America Dried Pears Revenue (USD Million) by Type (2021-2032)
12.1.2. South America Dried Pears Revenue (USD Million) by Application (2021-2032)
12.1.3. South America Dried Pears Revenue (USD Million) by Product (2021-2032)
By Type
Baked Dried
Freeze Dried
By Application
Direct Consumption
Candy and Snacks
Others
Chapter 13. Middle East and Africa Dried Pears Analysis and Outlook
13.1. Middle East and Africa Dried Pears Revenue (USD Million), by Segments (2021-2032)
13.1.1. Middle East and Africa Dried Pears Revenue (USD Million) by Type (2021-2032)
13.1.2. Middle East and Africa Dried Pears Revenue (USD Million) by Application (2021-2032)
13.1.3. Middle East and Africa Dried Pears Revenue (USD Million) by Product (2021-2032)
By Type
Baked Dried
Freeze Dried
By Application
Direct Consumption
Candy and Snacks
Others
Chapter 14. Dried Pears Company Profiles
14.1 Business Overview
14.2 Product Profiles
14.3 SWOT Profiles
14.5 Recent Developments
14.6 Financial Profile
List of Companies
Armen Manukyan
Bella Viva Orchards
Bergin Fruit and Nut Company
Brix Products
Brothers All Natural
Charlesworth Nuts
Fruitland
Gin Gin & Dry
Tianjin TTN Technology Company
15. Methodology and Data Sources
15.1 Customization Offerings
15.2 Subscription Services
15.3 Related Reports
15.4 Publisher Expertise
LIST OF TABLES
Table 1 Market Segmentation Analysis
Table 2 Global Dried Pears Market Share of Leading Companies, 2023
Table 3 Product Offerings of Leading Companies
Table 4 Low Growth Scenario Forecasts
Table 5 Reference Case Growth Scenario
Table 6 High Growth Case Scenario
Table 7 Global Dried Pears Revenue (USD Million) And CAGR (%) By Type (2021-2032)
Table 8 Global Dried Pears Revenue (USD Million) And CAGR (%) By Application (2021-2032)
Table 9 Global Dried Pears Revenue (USD Million) And CAGR (%) By Product (2021-2032)
Table 10 Global Dried Pears Market Revenue (USD Million) By Regions (2021-2032)
Table 11 Global Dried Pears Market Share (%) By Regions (2021-2032)
Table 12 North America Dried Pears Revenue (USD Million) By Country (2021-2032)
Table 13 Europe Dried Pears Revenue (USD Million) By Country (2021-2032)
Table 14 Asia Pacific Dried Pears Revenue (USD Million) By Country (2021-2032)
Table 15 South America Dried Pears Revenue (USD Million) By Country (2021-2032)
Table 16 Middle East and Africa Dried Pears Revenue (USD Million) By Region (2021-2032)
Table 17 North America Dried Pears Revenue (USD Million) By Type (2021-2032)
Table 18 North America Dried Pears Revenue (USD Million) By Application (2021-2032)
Table 19 North America Dried Pears Revenue (USD Million) By Product (2021-2032)
Table 20 Europe Dried Pears Revenue (USD Million) By Type (2021-2032)
Table 21 Europe Dried Pears Revenue (USD Million) By Application (2021-2032)
Table 22 Europe Dried Pears Revenue (USD Million) By Product (2021-2032)
Table 23 Asia Pacific Dried Pears Revenue (USD Million) By Type (2021-2032)
Table 24 Asia Pacific Dried Pears Revenue (USD Million) By Application (2021-2032)
Table 25 Asia Pacific Dried Pears Revenue (USD Million) By Product (2021-2032)
Table 26 South America Dried Pears Revenue (USD Million) By Type (2021-2032)
Table 27 South America Dried Pears Revenue (USD Million) By Application (2021-2032)
Table 28 South America Dried Pears Revenue (USD Million) By Product (2021-2032)
Table 29 Middle East and Africa Dried Pears Revenue (USD Million) By Type (2021-2032)
Table 30 Middle East and Africa Dried Pears Revenue (USD Million) By Application (2021-2032)
Table 31 Middle East and Africa Dried Pears Revenue (USD Million) By Product (2021-2032)
LIST OF FIGURES
Figure 1. Market Scope
Figure 2. Pricing Forecasts Per Unit, 2023- 2032
Figure 3. Porter’s Five Forces
Figure 4. Global Dried Pears Market Revenue (USD Million) By Regions (2021-2032)
Figure 5. Global Dried Pears Market Share (%) By Regions (2023)
Figure 6. North America Dried Pears Revenue (USD Million) By Country (2021-2032)
Figure 7. United States Dried Pears Revenue (USD Million) By Country (2021-2032)
Figure 8. Canada Dried Pears Revenue (USD Million) By Country (2021-2032)
Figure 9. Mexico Dried Pears Revenue (USD Million) By Country (2021-2032)
Figure 10. Europe Dried Pears Revenue (USD Million) By Country (2021-2032)
Figure 11. Germany Dried Pears Revenue (USD Million) By Country (2021-2032)
Figure 12. France Dried Pears Revenue (USD Million) By Country (2021-2032)
Figure 13. United Kingdom Dried Pears Revenue (USD Million) By Country (2021-2032)
Figure 14. Spain Dried Pears Revenue (USD Million) By Country (2021-2032)
Figure 15. Italy Dried Pears Revenue (USD Million) By Country (2021-2032)
Figure 16. Russia Dried Pears Revenue (USD Million) By Country (2021-2032)
Figure 17. Rest of Europe Dried Pears Revenue (USD Million) By Country (2021-2032)
Figure 11. Asia Pacific Dried Pears Revenue (USD Million) By Country (2021-2032)
Figure 12. China Dried Pears Revenue (USD Million) By Country (2021-2032)
Figure 13. Japan Dried Pears Revenue (USD Million) By Country (2021-2032)
Figure 14. India Dried Pears Revenue (USD Million) By Country (2021-2032)
Figure 15. South Korea Dried Pears Revenue (USD Million) By Country (2021-2032)
Figure 16. Australia Dried Pears Revenue (USD Million) By Country (2021-2032)
Figure 17. South East Asia Dried Pears Revenue (USD Million) By Country (2021-2032)
Figure 18. South America Dried Pears Revenue (USD Million) By Country (2021-2032)
Figure 19. Brazil Dried Pears Revenue (USD Million) By Country (2021-2032)
Figure 20. Argentina Dried Pears Revenue (USD Million) By Country (2021-2032)
Figure 21. Rest of Asia Pacific Dried Pears Revenue (USD Million) By Country (2021-2032)
Figure 22. Middle East and Africa Dried Pears Revenue (USD Million) By Region (2021-2032)
Figure 23. Saudi Arabia Dried Pears Revenue (USD Million) By Region (2021-2032)
Figure 24. The UAE Dried Pears Revenue (USD Million) By Region (2021-2032)
Figure 25. Rest of Middle East Dried Pears Revenue (USD Million) By Region (2021-2032)
Figure 26. South Africa Dried Pears Revenue (USD Million) By Region (2021-2032)
Figure 27. Africa Dried Pears Revenue (USD Million) By Region (2021-2032)
Figure 28. North America Dried Pears Revenue (USD Million) By Type (2021-2032)
Figure 29. North America Dried Pears Revenue (USD Million) By Application (2021-2032)
Figure 30. North America Dried Pears Revenue (USD Million) By Product (2021-2032)
Figure 31. Europe Dried Pears Revenue (USD Million) By Type (2021-2032)
Figure 32. Europe Dried Pears Revenue (USD Million) By Application (2021-2032)
Figure 33. Europe Dried Pears Revenue (USD Million) By Product (2021-2032)
Figure 34. Asia Pacific Dried Pears Revenue (USD Million) By Type (2021-2032)
Figure 35. Asia Pacific Dried Pears Revenue (USD Million) By Application (2021-2032)
Figure 36. Asia Pacific Dried Pears Revenue (USD Million) By Product (2021-2032)
Figure 37. South America Dried Pears Revenue (USD Million) By Type (2021-2032)
Figure 38. South America Dried Pears Revenue (USD Million) By Application (2021-2032)
Figure 39. South America Dried Pears Revenue (USD Million) By Product (2021-2032)
Figure 40. Middle East and Africa Dried Pears Revenue (USD Million) By Type (2021-2032)
Figure 41. Middle East and Africa Dried Pears Revenue (USD Million) By Application (2021-2032)
Figure 42. Middle East and Africa Dried Pears Revenue (USD Million) By Product (2021-2032)
By Type
Baked Dried
Freeze Dried
By Application
Direct Consumption
Candy and Snacks
Others
Countries Analyzed
North America (US, Canada, Mexico)
Europe (Germany, UK, France, Spain, Italy, Russia, Rest of Europe)
Asia Pacific (China, India, Japan, South Korea, Australia, South East Asia, Rest of Asia)
South America (Brazil, Argentina, Rest of South America)
Middle East and Africa (Saudi Arabia, UAE, Rest of Middle East, South Africa, Egypt, Rest of Africa)
