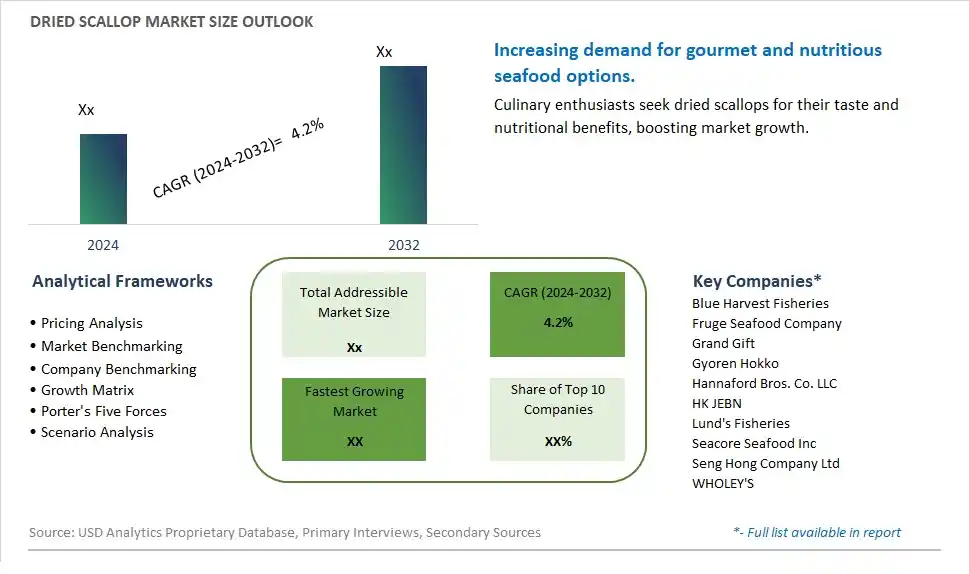
Global Dried Scallop Market Size is valued at $XX Million in 2024 and is forecast to register a growth rate (CAGR) of 4.2% to reach $XX Million by 2032.
The global Dried Scallop Market Comprehensive Study analyzes and forecasts the market size across 6 regions and 24 countries for diverse segments -By Type (Sea Scallops, Bay Scallops), By Distribution Channel (Supermarkets/Hypermarkets, Specialty Stores, Online Retail, Others)
An Introduction to Dried Scallop Market
The Dried Scallop market in 2024 is experiencing steady growth, driven by the increasing demand for premium seafood products. Dried scallops are highly valued for their rich umami flavor and high nutritional content, making them a popular ingredient in various cuisines. The market benefits from the rising trend of gourmet and exotic foods, along with the growing popularity of high-protein, low-fat dietary options. Additionally, advancements in drying and preservation technologies are enhancing the quality and shelf life of dried scallops, contributing to market growth.
Dried Scallop Competitive Landscape
The market report analyses the leading companies in the industry including Blue Harvest Fisheries, Fruge Seafood Company, Grand Gift, Gyoren Hokko, Hannaford Bros. Co. LLC, HK JEBN, Lund's Fisheries, Seacore Seafood Inc, Seng Hong Company Ltd, WHOLEY'S, and Others.
Dried Scallop Market Dynamics
Dried Scallop Market Trend: Growing Popularity of Gourmet and Specialty Foods
The dried scallop market is witnessing a notable trend towards gourmet and specialty foods, driven by an increasing consumer interest in high-quality, premium ingredients. As more people explore diverse culinary experiences and seek to recreate fine dining dishes at home, dried scallops are gaining popularity for their rich umami flavor and versatility in upscale recipes. This trend is particularly strong among food enthusiasts, home chefs, and those looking to elevate their cooking with unique and sophisticated ingredients. The rise of cooking shows, food blogs, and social media influencers showcasing gourmet dishes has further fueled this trend, making dried scallops a sought-after product in the specialty foods segment.
Dried Scallop Market Driver: Increasing Demand for Healthy and Nutrient-Dense Foods
A key driver for the dried scallop market is the growing demand for healthy and nutrient-dense foods. Dried scallops are prized for their high protein content, low fat, and abundance of essential nutrients such as omega-3 fatty acids, vitamins, and minerals. As consumers become more health-conscious and prioritize their dietary choices, the appeal of dried scallops as a nutritious and wholesome food option increases. The health benefits associated with seafood, including improved heart health and cognitive function, further drive consumer preference for dried scallops. Marketing efforts that emphasize these health benefits and the natural, preservative-free nature of dried scallops are effective in boosting demand.
Dried Scallop Market Opportunity: Expansion into Emerging Markets and Online Retail
The dried scallop market presents significant opportunities for expansion into emerging markets and online retail. As disposable incomes rise and culinary tastes evolve in regions such as Asia-Pacific and Latin America, there is a growing appetite for premium seafood products like dried scallops. Companies can capitalize on this by introducing dried scallops to these new markets through targeted marketing campaigns and collaborations with local distributors. Additionally, the increasing trend of online shopping offers a lucrative avenue for reaching a broader consumer base. Developing robust e-commerce platforms and leveraging digital marketing strategies can enhance product accessibility and visibility, driving sales and market growth in both established and emerging markets.
Dried Scallop Market Share Analysis: Sea Scallops segment generated the highest revenue share in the industry
The largest segment in the Dried Scallop Market is the "Sea Scallops" type. Sea scallops are highly valued for their large size, tender texture, and sweet flavor, making them a popular choice among consumers and chefs alike. These scallops are harvested from deep-sea waters and undergo a meticulous drying process to preserve their natural taste and quality. Sea scallops are versatile and used in various culinary applications, including gourmet dishes, seafood soups, stir-fries, and appetizers, contributing significantly to their dominance in the Dried Scallop Market. Their rich flavor profile and appealing texture make them a preferred ingredient in both home kitchens and professional foodservice establishments, driving the demand for sea scallop products in the market.
Dried Scallop Market Share Analysis: Online Retail is the fastest growing segment over the forecast period to 2032
The fastest-growing segment in the Dried Scallop Market is the "Online Retail" distribution channel. With the rapid digitalization of commerce and changing consumer shopping behaviors, online retail platforms have witnessed substantial growth in recent years. This trend has extended to the food and seafood industry, including dried scallop products. Online retail offers consumers convenience, a wide variety of choices, and the ability to shop from the comfort of their homes. Additionally, online platforms provide access to specialty and gourmet food items, including dried scallops, which may not be readily available in local supermarkets or specialty stores. The convenience of doorstep delivery, coupled with the availability of product information and reviews online, has contributed to the surge in online purchases of dried scallops. As more consumers turn to online channels for their seafood and culinary needs, the Online Retail segment is expected to continue its rapid growth trajectory in the Dried Scallop Market.
Dried Scallop Market Segmentation
By Type
Sea Scallops
Bay Scallops
By Distribution Channel
Supermarkets/Hypermarkets
Specialty Stores
Online Retail
Others
Countries Analyzed
North America (US, Canada, Mexico)
Europe (Germany, UK, France, Spain, Italy, Russia, Rest of Europe)
Asia Pacific (China, India, Japan, South Korea, Australia, South East Asia, Rest of Asia)
South America (Brazil, Argentina, Rest of South America)
Middle East and Africa (Saudi Arabia, UAE, Rest of Middle East, South Africa, Egypt, Rest of Africa)
Dried Scallop Companies Profiled in the Study
Blue Harvest Fisheries
Fruge Seafood Company
Grand Gift
Gyoren Hokko
Hannaford Bros. Co. LLC
HK JEBN
Lund's Fisheries
Seacore Seafood Inc
Seng Hong Company Ltd
WHOLEY'S
*- List Not Exhaustive
Chapter 1. TABLE OF CONTENTS
Chapter 2. Introduction to Dried Scallop Market
2.1. Market Overview
2.2. Key Statistics and Report Highlights
2.3. Scope of the Comprehensive Study
2.3.1. Market Definition
2.3.2 Countries and Regions Covered
2.3.3 Research Objective
2.3.4 Units, Currency, and Conversions
2.3.5 Industry Value Chain
2.4. Key Market Segments
2.5. Key Companies
2.6. Study Period
Chapter 3. Strategic Analysis Review
3.1. Dried Scallop Pricing Analysis and Forecast
3.2. Porter’s Five Forces
3.3. Market Ecosystem
3.4. SWOT Analysis
3.5. Regulatory Scenario
3.3. Effects of Inflation, Russia-Ukraine War, moderating economic growth, and other macroeconomic factors
Chapter 4. Competitive Landscape
4.1. Market Share Analysis
4.1.1. Global Dried Scallop Market Share by Company, 2023
4.1.2. Product Offerings of Leading Dried Scallop Companies
4.2. Market Entropy
4.2.1. New Product Launches in the Industry
4.2.2. Mergers, Acquisitions, Joint ventures, and Partnerships
4.3. Key Strategies and Best Practices
Chapter 5. Global Market Projections: Best, Reference, and Low Case Scenarios
5.1. Growth Analysis- Case Scenario Definitions
5.2. Low Growth Case Scenario Forecasts
5.3. Reference Growth Case Scenario Forecasts
5.4. High Growth Case Scenario Forecasts
Chapter 6. Market Dynamics
6.1. Dried Scallop Market Drivers
6.2. Dried Scallop Market Challenges
6.6. Dried Scallop Market Opportunities
6.4. Dried Scallop Market Trends
Chapter 7. Global Dried Scallop Market Outlook Trends
7.1. Global Dried Scallop Revenue (USD Million) and CAGR (%) by Type (2021-2032)
7.2. Global Dried Scallop Revenue (USD Million) and CAGR (%) by Application (2021-2032)
7.3. Global Dried Scallop Revenue (USD Million) and CAGR (%) by Product (2021-2032)
By Type
Sea Scallops
Bay Scallops
By Distribution Channel
Supermarkets/Hypermarkets
Specialty Stores
Online Retail
Others
Chapter 8. Global Dried Scallop Regional Analysis and Outlook
8.1. Global Dried Scallop Revenue (USD Million) By Regions (2021- 2032)
8.2. North America Dried Scallop Revenue (USD Million) by Country (2021-2032)
8.2.1. United States Dried Scallop Regional Analysis and Outlook
8.2.2. Canada Dried Scallop Regional Analysis and Outlook
8.2.3. Mexico Dried Scallop Regional Analysis and Outlook
8.3. Europe Dried Scallop Revenue (USD Million), by Country (2021-2032)
8.3.1. Germany Dried Scallop Regional Analysis and Outlook
8.3.2. France Dried Scallop Regional Analysis and Outlook
8.3.3. United Kingdom Dried Scallop Regional Analysis and Outlook
8.3.4. Spain Dried Scallop Regional Analysis and Outlook
8.3.5. Italy Dried Scallop Regional Analysis and Outlook
8.3.6. Russia Dried Scallop Regional Analysis and Outlook
8.3.7. Rest of Europe Dried Scallop Regional Analysis and Outlook
8.4. Asia Pacific Dried Scallop Revenue (USD Million) by Country (2021-2032)
8.4.1. China Dried Scallop Regional Analysis and Outlook
8.4.2. Japan Dried Scallop Regional Analysis and Outlook
8.4.3. India Dried Scallop Regional Analysis and Outlook
8.4.4. South Korea Dried Scallop Regional Analysis and Outlook
8.4.5. Australia Dried Scallop Regional Analysis and Outlook
8.4.6. South East Asia Dried Scallop Regional Analysis and Outlook
8.4.7. Rest of Asia Pacific Dried Scallop Regional Analysis and Outlook
8.5. South America Dried Scallop Revenue (USD Million), by Country (2021-2032)
8.5.1. Brazil Dried Scallop Regional Analysis and Outlook
8.5.2. Argentina Dried Scallop Regional Analysis and Outlook
8.5.3. Rest of South America Dried Scallop Regional Analysis and Outlook
8.6. Middle East and Africa Dried Scallop Revenue (USD Million) by Country (2021-2032)
8.6.1. Middle East Dried Scallop Regional Analysis and Outlook
8.6.2. Africa Dried Scallop Regional Analysis and Outlook
Chapter 9. North America Dried Scallop Analysis and Outlook
9.1. North America Dried Scallop Revenue (USD Million) by Segments (2021-2032)
9.1.1. North America Dried Scallop Revenue (USD Million) by Type (2021-2032)
9.1.2. North America Dried Scallop Revenue (USD Million) by Application (2021-2032)
9.1.3. North America Dried Scallop Revenue (USD Million) by Product (2021-2032)
By Type
Sea Scallops
Bay Scallops
By Distribution Channel
Supermarkets/Hypermarkets
Specialty Stores
Online Retail
Others
Chapter 10. Europe Dried Scallop Analysis and Outlook
10.1. Europe Dried Scallop Revenue (USD Million), by Segments (USD Million) (2021-2032)
10.1.1. Europe Dried Scallop Revenue (USD Million) by Type (2021-2032)
10.1.2. Europe Dried Scallop Revenue (USD Million) by Application (2021-2032)
10.1.3. Europe Dried Scallop Revenue (USD Million) by Product (2021-2032)
By Type
Sea Scallops
Bay Scallops
By Distribution Channel
Supermarkets/Hypermarkets
Specialty Stores
Online Retail
Others
Chapter 11. Asia Pacific Dried Scallop Analysis and Outlook
11.1. Asia Pacific Dried Scallop Revenue (USD Million), and Revenue (USD Million) by Segments (2021-2032)
11.1.1. Asia Pacific Dried Scallop Revenue (USD Million) by Type (2021-2032)
11.1.2. Asia Pacific Dried Scallop Revenue (USD Million) by Application (2021-2032)
11.1.3. Asia Pacific Dried Scallop Revenue (USD Million) by Product (2021-2032)
By Type
Sea Scallops
Bay Scallops
By Distribution Channel
Supermarkets/Hypermarkets
Specialty Stores
Online Retail
Others
Chapter 12. South America Dried Scallop Analysis and Outlook
12.1. South America Dried Scallop Revenue (USD Million), by Segments (2021-2032)
12.1.1. South America Dried Scallop Revenue (USD Million) by Type (2021-2032)
12.1.2. South America Dried Scallop Revenue (USD Million) by Application (2021-2032)
12.1.3. South America Dried Scallop Revenue (USD Million) by Product (2021-2032)
By Type
Sea Scallops
Bay Scallops
By Distribution Channel
Supermarkets/Hypermarkets
Specialty Stores
Online Retail
Others
Chapter 13. Middle East and Africa Dried Scallop Analysis and Outlook
13.1. Middle East and Africa Dried Scallop Revenue (USD Million), by Segments (2021-2032)
13.1.1. Middle East and Africa Dried Scallop Revenue (USD Million) by Type (2021-2032)
13.1.2. Middle East and Africa Dried Scallop Revenue (USD Million) by Application (2021-2032)
13.1.3. Middle East and Africa Dried Scallop Revenue (USD Million) by Product (2021-2032)
By Type
Sea Scallops
Bay Scallops
By Distribution Channel
Supermarkets/Hypermarkets
Specialty Stores
Online Retail
Others
Chapter 14. Dried Scallop Company Profiles
14.1 Business Overview
14.2 Product Profiles
14.3 SWOT Profiles
14.5 Recent Developments
14.6 Financial Profile
List of Companies
Blue Harvest Fisheries
Fruge Seafood Company
Grand Gift
Gyoren Hokko
Hannaford Bros. Co. LLC
HK JEBN
Lund's Fisheries
Seacore Seafood Inc
Seng Hong Company Ltd
WHOLEY'S
15. Methodology and Data Sources
15.1 Customization Offerings
15.2 Subscription Services
15.3 Related Reports
15.4 Publisher Expertise
LIST OF TABLES
Table 1 Market Segmentation Analysis
Table 2 Global Dried Scallop Market Share of Leading Companies, 2023
Table 3 Product Offerings of Leading Companies
Table 4 Low Growth Scenario Forecasts
Table 5 Reference Case Growth Scenario
Table 6 High Growth Case Scenario
Table 7 Global Dried Scallop Revenue (USD Million) And CAGR (%) By Type (2021-2032)
Table 8 Global Dried Scallop Revenue (USD Million) And CAGR (%) By Application (2021-2032)
Table 9 Global Dried Scallop Revenue (USD Million) And CAGR (%) By Product (2021-2032)
Table 10 Global Dried Scallop Market Revenue (USD Million) By Regions (2021-2032)
Table 11 Global Dried Scallop Market Share (%) By Regions (2021-2032)
Table 12 North America Dried Scallop Revenue (USD Million) By Country (2021-2032)
Table 13 Europe Dried Scallop Revenue (USD Million) By Country (2021-2032)
Table 14 Asia Pacific Dried Scallop Revenue (USD Million) By Country (2021-2032)
Table 15 South America Dried Scallop Revenue (USD Million) By Country (2021-2032)
Table 16 Middle East and Africa Dried Scallop Revenue (USD Million) By Region (2021-2032)
Table 17 North America Dried Scallop Revenue (USD Million) By Type (2021-2032)
Table 18 North America Dried Scallop Revenue (USD Million) By Application (2021-2032)
Table 19 North America Dried Scallop Revenue (USD Million) By Product (2021-2032)
Table 20 Europe Dried Scallop Revenue (USD Million) By Type (2021-2032)
Table 21 Europe Dried Scallop Revenue (USD Million) By Application (2021-2032)
Table 22 Europe Dried Scallop Revenue (USD Million) By Product (2021-2032)
Table 23 Asia Pacific Dried Scallop Revenue (USD Million) By Type (2021-2032)
Table 24 Asia Pacific Dried Scallop Revenue (USD Million) By Application (2021-2032)
Table 25 Asia Pacific Dried Scallop Revenue (USD Million) By Product (2021-2032)
Table 26 South America Dried Scallop Revenue (USD Million) By Type (2021-2032)
Table 27 South America Dried Scallop Revenue (USD Million) By Application (2021-2032)
Table 28 South America Dried Scallop Revenue (USD Million) By Product (2021-2032)
Table 29 Middle East and Africa Dried Scallop Revenue (USD Million) By Type (2021-2032)
Table 30 Middle East and Africa Dried Scallop Revenue (USD Million) By Application (2021-2032)
Table 31 Middle East and Africa Dried Scallop Revenue (USD Million) By Product (2021-2032)
LIST OF FIGURES
Figure 1. Market Scope
Figure 2. Pricing Forecasts Per Unit, 2023- 2032
Figure 3. Porter’s Five Forces
Figure 4. Global Dried Scallop Market Revenue (USD Million) By Regions (2021-2032)
Figure 5. Global Dried Scallop Market Share (%) By Regions (2023)
Figure 6. North America Dried Scallop Revenue (USD Million) By Country (2021-2032)
Figure 7. United States Dried Scallop Revenue (USD Million) By Country (2021-2032)
Figure 8. Canada Dried Scallop Revenue (USD Million) By Country (2021-2032)
Figure 9. Mexico Dried Scallop Revenue (USD Million) By Country (2021-2032)
Figure 10. Europe Dried Scallop Revenue (USD Million) By Country (2021-2032)
Figure 11. Germany Dried Scallop Revenue (USD Million) By Country (2021-2032)
Figure 12. France Dried Scallop Revenue (USD Million) By Country (2021-2032)
Figure 13. United Kingdom Dried Scallop Revenue (USD Million) By Country (2021-2032)
Figure 14. Spain Dried Scallop Revenue (USD Million) By Country (2021-2032)
Figure 15. Italy Dried Scallop Revenue (USD Million) By Country (2021-2032)
Figure 16. Russia Dried Scallop Revenue (USD Million) By Country (2021-2032)
Figure 17. Rest of Europe Dried Scallop Revenue (USD Million) By Country (2021-2032)
Figure 11. Asia Pacific Dried Scallop Revenue (USD Million) By Country (2021-2032)
Figure 12. China Dried Scallop Revenue (USD Million) By Country (2021-2032)
Figure 13. Japan Dried Scallop Revenue (USD Million) By Country (2021-2032)
Figure 14. India Dried Scallop Revenue (USD Million) By Country (2021-2032)
Figure 15. South Korea Dried Scallop Revenue (USD Million) By Country (2021-2032)
Figure 16. Australia Dried Scallop Revenue (USD Million) By Country (2021-2032)
Figure 17. South East Asia Dried Scallop Revenue (USD Million) By Country (2021-2032)
Figure 18. South America Dried Scallop Revenue (USD Million) By Country (2021-2032)
Figure 19. Brazil Dried Scallop Revenue (USD Million) By Country (2021-2032)
Figure 20. Argentina Dried Scallop Revenue (USD Million) By Country (2021-2032)
Figure 21. Rest of Asia Pacific Dried Scallop Revenue (USD Million) By Country (2021-2032)
Figure 22. Middle East and Africa Dried Scallop Revenue (USD Million) By Region (2021-2032)
Figure 23. Saudi Arabia Dried Scallop Revenue (USD Million) By Region (2021-2032)
Figure 24. The UAE Dried Scallop Revenue (USD Million) By Region (2021-2032)
Figure 25. Rest of Middle East Dried Scallop Revenue (USD Million) By Region (2021-2032)
Figure 26. South Africa Dried Scallop Revenue (USD Million) By Region (2021-2032)
Figure 27. Africa Dried Scallop Revenue (USD Million) By Region (2021-2032)
Figure 28. North America Dried Scallop Revenue (USD Million) By Type (2021-2032)
Figure 29. North America Dried Scallop Revenue (USD Million) By Application (2021-2032)
Figure 30. North America Dried Scallop Revenue (USD Million) By Product (2021-2032)
Figure 31. Europe Dried Scallop Revenue (USD Million) By Type (2021-2032)
Figure 32. Europe Dried Scallop Revenue (USD Million) By Application (2021-2032)
Figure 33. Europe Dried Scallop Revenue (USD Million) By Product (2021-2032)
Figure 34. Asia Pacific Dried Scallop Revenue (USD Million) By Type (2021-2032)
Figure 35. Asia Pacific Dried Scallop Revenue (USD Million) By Application (2021-2032)
Figure 36. Asia Pacific Dried Scallop Revenue (USD Million) By Product (2021-2032)
Figure 37. South America Dried Scallop Revenue (USD Million) By Type (2021-2032)
Figure 38. South America Dried Scallop Revenue (USD Million) By Application (2021-2032)
Figure 39. South America Dried Scallop Revenue (USD Million) By Product (2021-2032)
Figure 40. Middle East and Africa Dried Scallop Revenue (USD Million) By Type (2021-2032)
Figure 41. Middle East and Africa Dried Scallop Revenue (USD Million) By Application (2021-2032)
Figure 42. Middle East and Africa Dried Scallop Revenue (USD Million) By Product (2021-2032)
By Type
Sea Scallops
Bay Scallops
By Distribution Channel
Supermarkets/Hypermarkets
Specialty Stores
Online Retail
Others
Countries Analyzed
North America (US, Canada, Mexico)
Europe (Germany, UK, France, Spain, Italy, Russia, Rest of Europe)
Asia Pacific (China, India, Japan, South Korea, Australia, South East Asia, Rest of Asia)
South America (Brazil, Argentina, Rest of South America)
Middle East and Africa (Saudi Arabia, UAE, Rest of Middle East, South Africa, Egypt, Rest of Africa)
