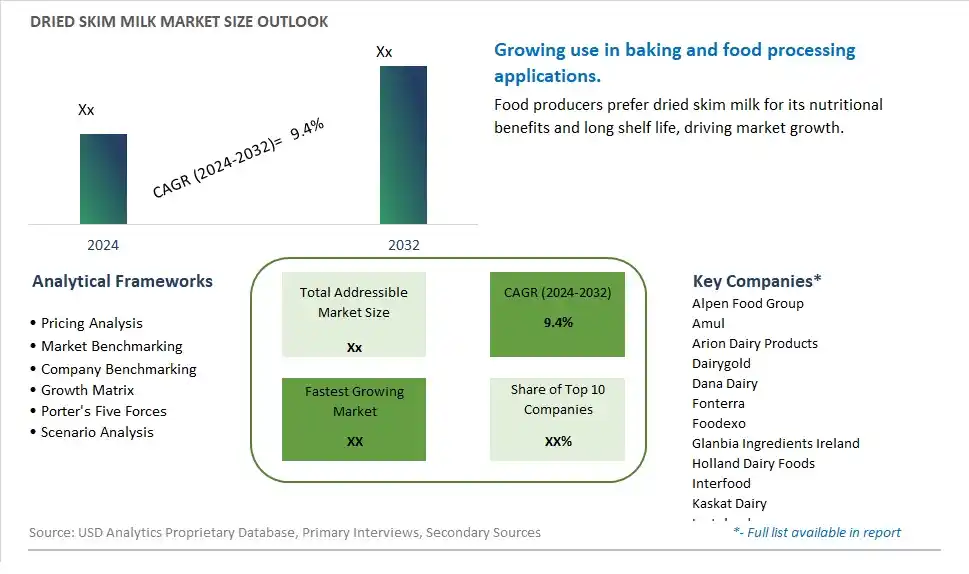
Global Dried Skim Milk Market Size is valued at $XX Million in 2024 and is forecast to register a growth rate (CAGR) of 9.4% to reach $XX Million by 2032.
The global Dried Skim Milk Market Comprehensive Study analyzes and forecasts the market size across 6 regions and 24 countries for diverse segments -By Type (High-Heat, Medium-Heat, Low-Heat), By Application (Infant formula, Desserts, Baked goods, Others)
An Introduction to Dried Skim Milk Market
In 2024, the Dried Skim Milk market is thriving, driven by the increasing demand for versatile and long-lasting dairy products. Dried skim milk is widely used in the food and beverage industry for its nutritional benefits, including high protein and low fat content. The market benefits from the growing trend of health-conscious eating and the rising demand for low-fat and low-calorie food products. Additionally, advancements in drying technologies and the increasing use of dried skim milk in bakery, confectionery, and dairy products are contributing to market expansion.
Dried Skim Milk Competitive Landscape
The market report analyses the leading companies in the industry including Alpen Food Group, Amul, Arion Dairy Products, Dairygold, Dana Dairy, Fonterra, Foodexo, Glanbia Ingredients Ireland , Holland Dairy Foods, Interfood, Kaskat Dairy, Lactoland, Milky Holland, Miraka, Nestlé S.A., Nova Dairy products, NZMP, Revala Ltd, Synlait milk ltd, TATURA, Vreugdenhil, and Others.
Dried Skim Milk Market Dynamics
Dried Skim Milk Market Trend: Increasing Demand for Low-Fat and Nutrient-Rich Products
The dried skim milk market is experiencing a significant trend towards low-fat and nutrient-rich products. As health consciousness continues to rise globally, consumers are increasingly seeking dairy products that offer essential nutrients without the added fat content. Dried skim milk, known for being low in fat while still providing high levels of protein, calcium, and vitamins, fits perfectly within this trend. This demand is particularly strong among health enthusiasts, fitness-conscious individuals, and those managing their weight. The versatility of dried skim milk in various applications, from baking to beverage formulations, further supports its growing popularity.
Dried Skim Milk Market Driver: Rising Health Awareness and Dietary Shifts
A major driver for the dried skim milk market is the rising health awareness and dietary shifts among consumers. The growing prevalence of lifestyle-related diseases such as obesity, diabetes, and cardiovascular issues has led individuals to adopt healthier eating habits, which include reducing fat intake. Dried skim milk serves as an ideal ingredient for health-conscious consumers, offering the benefits of milk without the high-fat content. Additionally, the increasing number of people adopting special diets, such as low-fat and high-protein diets, drives the demand for dried skim milk. Educational initiatives and marketing campaigns highlighting the health benefits of skim milk further boost consumer interest.
Dried Skim Milk Market Opportunity: Growth in Functional Foods and Beverages
The dried skim milk market holds substantial opportunities for growth in the functional foods and beverages sector. Companies can innovate by incorporating dried skim milk into a wide range of health-oriented products, such as protein shakes, meal replacement bars, and fortified beverages. Developing new product formulations that cater to specific health needs, such as lactose-free or enriched with additional vitamins and minerals, can attract a broader consumer base. Expanding distribution channels through online platforms and health food stores can enhance market reach. Collaborations with nutritionists and fitness experts to promote the benefits of dried skim milk in achieving dietary and fitness goals can also drive market expansion and consumer engagement.
Dried Skim Milk Market Share Analysis: High-Heat segment generated the highest revenue share in the industry
The largest segment in the Dried Skim Milk Market is the "High-Heat" type. High-heat skim milk undergoes a specific processing method that involves exposing the milk to high temperatures, which helps in reducing microbial activity and extending its shelf life. This type of dried skim milk is commonly used in various food and beverage applications due to its ability to dissolve easily and contribute to the desired texture and consistency in products. High-heat skim milk is often preferred in the food industry for its functional properties, including its emulsifying and thickening abilities, making it suitable for use in a wide range of products such as dairy-based beverages, yogurt, ice cream, soups, sauces, and bakery items. Its versatility and functional benefits make it a prominent choice among manufacturers, contributing significantly to its dominance as the largest segment in the Dried Skim Milk Market.
Dried Skim Milk Market Share Analysis: Infant Formula is the fastest growing segment over the forecast period to 2032
The fastest-growing segment in the Dried Skim Milk Market is the "Infant Formula" application. Dried skim milk is a crucial ingredient in the production of infant formula due to its nutritional composition, which closely resembles that of human breast milk. It provides essential nutrients such as protein, calcium, vitamins, and minerals necessary for infant growth and development. With the rising global population and increasing awareness about the importance of early childhood nutrition, the demand for high-quality infant formula products is witnessing significant growth. Dried skim milk's role in infant formula production, coupled with its nutritional benefits and suitability for infant consumption, has led to a surge in demand within this application segment. As a result, the Infant Formula application segment is projected to experience rapid growth and emerge as the fastest-growing segment in the Dried Skim Milk Market.
Dried Skim Milk Market Segmentation
By Type
High-Heat
Medium-Heat
Low-Heat
By Application
Infant formula
Desserts
Baked goods
Others
Countries Analyzed
North America (US, Canada, Mexico)
Europe (Germany, UK, France, Spain, Italy, Russia, Rest of Europe)
Asia Pacific (China, India, Japan, South Korea, Australia, South East Asia, Rest of Asia)
South America (Brazil, Argentina, Rest of South America)
Middle East and Africa (Saudi Arabia, UAE, Rest of Middle East, South Africa, Egypt, Rest of Africa)
Dried Skim Milk Companies Profiled in the Study
Alpen Food Group
Amul
Arion Dairy Products
Dairygold
Dana Dairy
Fonterra
Foodexo
Glanbia Ingredients Ireland
Holland Dairy Foods
Interfood
Kaskat Dairy
Lactoland
Milky Holland
Miraka
Nestlé S.A.
Nova Dairy products
NZMP
Revala Ltd
Synlait milk ltd
TATURA
Vreugdenhil
*- List Not Exhaustive
Chapter 1. TABLE OF CONTENTS
Chapter 2. Introduction to Dried Skim Milk Market
2.1. Market Overview
2.2. Key Statistics and Report Highlights
2.3. Scope of the Comprehensive Study
2.3.1. Market Definition
2.3.2 Countries and Regions Covered
2.3.3 Research Objective
2.3.4 Units, Currency, and Conversions
2.3.5 Industry Value Chain
2.4. Key Market Segments
2.5. Key Companies
2.6. Study Period
Chapter 3. Strategic Analysis Review
3.1. Dried Skim Milk Pricing Analysis and Forecast
3.2. Porter’s Five Forces
3.3. Market Ecosystem
3.4. SWOT Analysis
3.5. Regulatory Scenario
3.3. Effects of Inflation, Russia-Ukraine War, moderating economic growth, and other macroeconomic factors
Chapter 4. Competitive Landscape
4.1. Market Share Analysis
4.1.1. Global Dried Skim Milk Market Share by Company, 2023
4.1.2. Product Offerings of Leading Dried Skim Milk Companies
4.2. Market Entropy
4.2.1. New Product Launches in the Industry
4.2.2. Mergers, Acquisitions, Joint ventures, and Partnerships
4.3. Key Strategies and Best Practices
Chapter 5. Global Market Projections: Best, Reference, and Low Case Scenarios
5.1. Growth Analysis- Case Scenario Definitions
5.2. Low Growth Case Scenario Forecasts
5.3. Reference Growth Case Scenario Forecasts
5.4. High Growth Case Scenario Forecasts
Chapter 6. Market Dynamics
6.1. Dried Skim Milk Market Drivers
6.2. Dried Skim Milk Market Challenges
6.6. Dried Skim Milk Market Opportunities
6.4. Dried Skim Milk Market Trends
Chapter 7. Global Dried Skim Milk Market Outlook Trends
7.1. Global Dried Skim Milk Revenue (USD Million) and CAGR (%) by Type (2021-2032)
7.2. Global Dried Skim Milk Revenue (USD Million) and CAGR (%) by Application (2021-2032)
7.3. Global Dried Skim Milk Revenue (USD Million) and CAGR (%) by Product (2021-2032)
By Type
High-Heat
Medium-Heat
Low-Heat
By Application
Infant formula
Desserts
Baked goods
Others
Chapter 8. Global Dried Skim Milk Regional Analysis and Outlook
8.1. Global Dried Skim Milk Revenue (USD Million) By Regions (2021- 2032)
8.2. North America Dried Skim Milk Revenue (USD Million) by Country (2021-2032)
8.2.1. United States Dried Skim Milk Regional Analysis and Outlook
8.2.2. Canada Dried Skim Milk Regional Analysis and Outlook
8.2.3. Mexico Dried Skim Milk Regional Analysis and Outlook
8.3. Europe Dried Skim Milk Revenue (USD Million), by Country (2021-2032)
8.3.1. Germany Dried Skim Milk Regional Analysis and Outlook
8.3.2. France Dried Skim Milk Regional Analysis and Outlook
8.3.3. United Kingdom Dried Skim Milk Regional Analysis and Outlook
8.3.4. Spain Dried Skim Milk Regional Analysis and Outlook
8.3.5. Italy Dried Skim Milk Regional Analysis and Outlook
8.3.6. Russia Dried Skim Milk Regional Analysis and Outlook
8.3.7. Rest of Europe Dried Skim Milk Regional Analysis and Outlook
8.4. Asia Pacific Dried Skim Milk Revenue (USD Million) by Country (2021-2032)
8.4.1. China Dried Skim Milk Regional Analysis and Outlook
8.4.2. Japan Dried Skim Milk Regional Analysis and Outlook
8.4.3. India Dried Skim Milk Regional Analysis and Outlook
8.4.4. South Korea Dried Skim Milk Regional Analysis and Outlook
8.4.5. Australia Dried Skim Milk Regional Analysis and Outlook
8.4.6. South East Asia Dried Skim Milk Regional Analysis and Outlook
8.4.7. Rest of Asia Pacific Dried Skim Milk Regional Analysis and Outlook
8.5. South America Dried Skim Milk Revenue (USD Million), by Country (2021-2032)
8.5.1. Brazil Dried Skim Milk Regional Analysis and Outlook
8.5.2. Argentina Dried Skim Milk Regional Analysis and Outlook
8.5.3. Rest of South America Dried Skim Milk Regional Analysis and Outlook
8.6. Middle East and Africa Dried Skim Milk Revenue (USD Million) by Country (2021-2032)
8.6.1. Middle East Dried Skim Milk Regional Analysis and Outlook
8.6.2. Africa Dried Skim Milk Regional Analysis and Outlook
Chapter 9. North America Dried Skim Milk Analysis and Outlook
9.1. North America Dried Skim Milk Revenue (USD Million) by Segments (2021-2032)
9.1.1. North America Dried Skim Milk Revenue (USD Million) by Type (2021-2032)
9.1.2. North America Dried Skim Milk Revenue (USD Million) by Application (2021-2032)
9.1.3. North America Dried Skim Milk Revenue (USD Million) by Product (2021-2032)
By Type
High-Heat
Medium-Heat
Low-Heat
By Application
Infant formula
Desserts
Baked goods
Others
Chapter 10. Europe Dried Skim Milk Analysis and Outlook
10.1. Europe Dried Skim Milk Revenue (USD Million), by Segments (USD Million) (2021-2032)
10.1.1. Europe Dried Skim Milk Revenue (USD Million) by Type (2021-2032)
10.1.2. Europe Dried Skim Milk Revenue (USD Million) by Application (2021-2032)
10.1.3. Europe Dried Skim Milk Revenue (USD Million) by Product (2021-2032)
By Type
High-Heat
Medium-Heat
Low-Heat
By Application
Infant formula
Desserts
Baked goods
Others
Chapter 11. Asia Pacific Dried Skim Milk Analysis and Outlook
11.1. Asia Pacific Dried Skim Milk Revenue (USD Million), and Revenue (USD Million) by Segments (2021-2032)
11.1.1. Asia Pacific Dried Skim Milk Revenue (USD Million) by Type (2021-2032)
11.1.2. Asia Pacific Dried Skim Milk Revenue (USD Million) by Application (2021-2032)
11.1.3. Asia Pacific Dried Skim Milk Revenue (USD Million) by Product (2021-2032)
By Type
High-Heat
Medium-Heat
Low-Heat
By Application
Infant formula
Desserts
Baked goods
Others
Chapter 12. South America Dried Skim Milk Analysis and Outlook
12.1. South America Dried Skim Milk Revenue (USD Million), by Segments (2021-2032)
12.1.1. South America Dried Skim Milk Revenue (USD Million) by Type (2021-2032)
12.1.2. South America Dried Skim Milk Revenue (USD Million) by Application (2021-2032)
12.1.3. South America Dried Skim Milk Revenue (USD Million) by Product (2021-2032)
By Type
High-Heat
Medium-Heat
Low-Heat
By Application
Infant formula
Desserts
Baked goods
Others
Chapter 13. Middle East and Africa Dried Skim Milk Analysis and Outlook
13.1. Middle East and Africa Dried Skim Milk Revenue (USD Million), by Segments (2021-2032)
13.1.1. Middle East and Africa Dried Skim Milk Revenue (USD Million) by Type (2021-2032)
13.1.2. Middle East and Africa Dried Skim Milk Revenue (USD Million) by Application (2021-2032)
13.1.3. Middle East and Africa Dried Skim Milk Revenue (USD Million) by Product (2021-2032)
By Type
High-Heat
Medium-Heat
Low-Heat
By Application
Infant formula
Desserts
Baked goods
Others
Chapter 14. Dried Skim Milk Company Profiles
14.1 Business Overview
14.2 Product Profiles
14.3 SWOT Profiles
14.5 Recent Developments
14.6 Financial Profile
List of Companies
Alpen Food Group
Amul
Arion Dairy Products
Dairygold
Dana Dairy
Fonterra
Foodexo
Glanbia Ingredients Ireland
Holland Dairy Foods
Interfood
Kaskat Dairy
Lactoland
Milky Holland
Miraka
Nestlé S.A.
Nova Dairy products
NZMP
Revala Ltd
Synlait milk ltd
TATURA
Vreugdenhil
15. Methodology and Data Sources
15.1 Customization Offerings
15.2 Subscription Services
15.3 Related Reports
15.4 Publisher Expertise
LIST OF TABLES
Table 1 Market Segmentation Analysis
Table 2 Global Dried Skim Milk Market Share of Leading Companies, 2023
Table 3 Product Offerings of Leading Companies
Table 4 Low Growth Scenario Forecasts
Table 5 Reference Case Growth Scenario
Table 6 High Growth Case Scenario
Table 7 Global Dried Skim Milk Revenue (USD Million) And CAGR (%) By Type (2021-2032)
Table 8 Global Dried Skim Milk Revenue (USD Million) And CAGR (%) By Application (2021-2032)
Table 9 Global Dried Skim Milk Revenue (USD Million) And CAGR (%) By Product (2021-2032)
Table 10 Global Dried Skim Milk Market Revenue (USD Million) By Regions (2021-2032)
Table 11 Global Dried Skim Milk Market Share (%) By Regions (2021-2032)
Table 12 North America Dried Skim Milk Revenue (USD Million) By Country (2021-2032)
Table 13 Europe Dried Skim Milk Revenue (USD Million) By Country (2021-2032)
Table 14 Asia Pacific Dried Skim Milk Revenue (USD Million) By Country (2021-2032)
Table 15 South America Dried Skim Milk Revenue (USD Million) By Country (2021-2032)
Table 16 Middle East and Africa Dried Skim Milk Revenue (USD Million) By Region (2021-2032)
Table 17 North America Dried Skim Milk Revenue (USD Million) By Type (2021-2032)
Table 18 North America Dried Skim Milk Revenue (USD Million) By Application (2021-2032)
Table 19 North America Dried Skim Milk Revenue (USD Million) By Product (2021-2032)
Table 20 Europe Dried Skim Milk Revenue (USD Million) By Type (2021-2032)
Table 21 Europe Dried Skim Milk Revenue (USD Million) By Application (2021-2032)
Table 22 Europe Dried Skim Milk Revenue (USD Million) By Product (2021-2032)
Table 23 Asia Pacific Dried Skim Milk Revenue (USD Million) By Type (2021-2032)
Table 24 Asia Pacific Dried Skim Milk Revenue (USD Million) By Application (2021-2032)
Table 25 Asia Pacific Dried Skim Milk Revenue (USD Million) By Product (2021-2032)
Table 26 South America Dried Skim Milk Revenue (USD Million) By Type (2021-2032)
Table 27 South America Dried Skim Milk Revenue (USD Million) By Application (2021-2032)
Table 28 South America Dried Skim Milk Revenue (USD Million) By Product (2021-2032)
Table 29 Middle East and Africa Dried Skim Milk Revenue (USD Million) By Type (2021-2032)
Table 30 Middle East and Africa Dried Skim Milk Revenue (USD Million) By Application (2021-2032)
Table 31 Middle East and Africa Dried Skim Milk Revenue (USD Million) By Product (2021-2032)
LIST OF FIGURES
Figure 1. Market Scope
Figure 2. Pricing Forecasts Per Unit, 2023- 2032
Figure 3. Porter’s Five Forces
Figure 4. Global Dried Skim Milk Market Revenue (USD Million) By Regions (2021-2032)
Figure 5. Global Dried Skim Milk Market Share (%) By Regions (2023)
Figure 6. North America Dried Skim Milk Revenue (USD Million) By Country (2021-2032)
Figure 7. United States Dried Skim Milk Revenue (USD Million) By Country (2021-2032)
Figure 8. Canada Dried Skim Milk Revenue (USD Million) By Country (2021-2032)
Figure 9. Mexico Dried Skim Milk Revenue (USD Million) By Country (2021-2032)
Figure 10. Europe Dried Skim Milk Revenue (USD Million) By Country (2021-2032)
Figure 11. Germany Dried Skim Milk Revenue (USD Million) By Country (2021-2032)
Figure 12. France Dried Skim Milk Revenue (USD Million) By Country (2021-2032)
Figure 13. United Kingdom Dried Skim Milk Revenue (USD Million) By Country (2021-2032)
Figure 14. Spain Dried Skim Milk Revenue (USD Million) By Country (2021-2032)
Figure 15. Italy Dried Skim Milk Revenue (USD Million) By Country (2021-2032)
Figure 16. Russia Dried Skim Milk Revenue (USD Million) By Country (2021-2032)
Figure 17. Rest of Europe Dried Skim Milk Revenue (USD Million) By Country (2021-2032)
Figure 11. Asia Pacific Dried Skim Milk Revenue (USD Million) By Country (2021-2032)
Figure 12. China Dried Skim Milk Revenue (USD Million) By Country (2021-2032)
Figure 13. Japan Dried Skim Milk Revenue (USD Million) By Country (2021-2032)
Figure 14. India Dried Skim Milk Revenue (USD Million) By Country (2021-2032)
Figure 15. South Korea Dried Skim Milk Revenue (USD Million) By Country (2021-2032)
Figure 16. Australia Dried Skim Milk Revenue (USD Million) By Country (2021-2032)
Figure 17. South East Asia Dried Skim Milk Revenue (USD Million) By Country (2021-2032)
Figure 18. South America Dried Skim Milk Revenue (USD Million) By Country (2021-2032)
Figure 19. Brazil Dried Skim Milk Revenue (USD Million) By Country (2021-2032)
Figure 20. Argentina Dried Skim Milk Revenue (USD Million) By Country (2021-2032)
Figure 21. Rest of Asia Pacific Dried Skim Milk Revenue (USD Million) By Country (2021-2032)
Figure 22. Middle East and Africa Dried Skim Milk Revenue (USD Million) By Region (2021-2032)
Figure 23. Saudi Arabia Dried Skim Milk Revenue (USD Million) By Region (2021-2032)
Figure 24. The UAE Dried Skim Milk Revenue (USD Million) By Region (2021-2032)
Figure 25. Rest of Middle East Dried Skim Milk Revenue (USD Million) By Region (2021-2032)
Figure 26. South Africa Dried Skim Milk Revenue (USD Million) By Region (2021-2032)
Figure 27. Africa Dried Skim Milk Revenue (USD Million) By Region (2021-2032)
Figure 28. North America Dried Skim Milk Revenue (USD Million) By Type (2021-2032)
Figure 29. North America Dried Skim Milk Revenue (USD Million) By Application (2021-2032)
Figure 30. North America Dried Skim Milk Revenue (USD Million) By Product (2021-2032)
Figure 31. Europe Dried Skim Milk Revenue (USD Million) By Type (2021-2032)
Figure 32. Europe Dried Skim Milk Revenue (USD Million) By Application (2021-2032)
Figure 33. Europe Dried Skim Milk Revenue (USD Million) By Product (2021-2032)
Figure 34. Asia Pacific Dried Skim Milk Revenue (USD Million) By Type (2021-2032)
Figure 35. Asia Pacific Dried Skim Milk Revenue (USD Million) By Application (2021-2032)
Figure 36. Asia Pacific Dried Skim Milk Revenue (USD Million) By Product (2021-2032)
Figure 37. South America Dried Skim Milk Revenue (USD Million) By Type (2021-2032)
Figure 38. South America Dried Skim Milk Revenue (USD Million) By Application (2021-2032)
Figure 39. South America Dried Skim Milk Revenue (USD Million) By Product (2021-2032)
Figure 40. Middle East and Africa Dried Skim Milk Revenue (USD Million) By Type (2021-2032)
Figure 41. Middle East and Africa Dried Skim Milk Revenue (USD Million) By Application (2021-2032)
Figure 42. Middle East and Africa Dried Skim Milk Revenue (USD Million) By Product (2021-2032)
By Type
High-Heat
Medium-Heat
Low-Heat
By Application
Infant formula
Desserts
Baked goods
Others
Countries Analyzed
North America (US, Canada, Mexico)
Europe (Germany, UK, France, Spain, Italy, Russia, Rest of Europe)
Asia Pacific (China, India, Japan, South Korea, Australia, South East Asia, Rest of Asia)
South America (Brazil, Argentina, Rest of South America)
Middle East and Africa (Saudi Arabia, UAE, Rest of Middle East, South Africa, Egypt, Rest of Africa)
