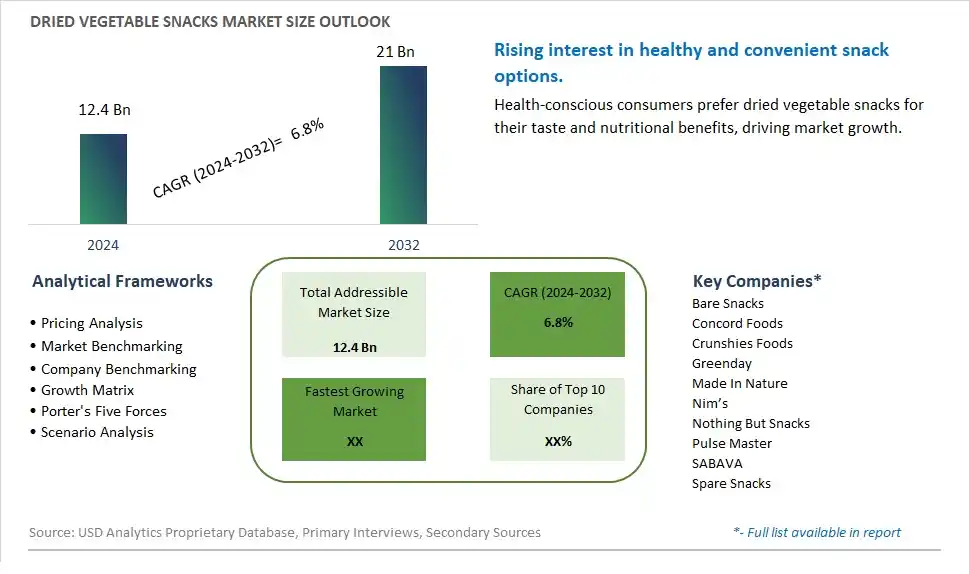
Global Dried Vegetable Snacks Market Size is valued at $12.4 Billion in 2024 and is forecast to register a growth rate (CAGR) of 6.8% to reach $21 Billion by 2032.
The global Dried Vegetable Snacks Market Comprehensive Study analyzes and forecasts the market size across 6 regions and 24 countries for diverse segments -By Type (Broccoli, Okra, Pumpkin, Tomato, Others), By Application (Snacks, Food Decorations, Others)
An Introduction to Dried Vegetable Snacks Market
The Dried Vegetable Snacks market in 2024 is experiencing significant growth, driven by the rising demand for healthy and convenient snack options. Dried vegetable snacks, known for their nutritional benefits and natural flavors, are becoming increasingly popular among health-conscious consumers. The market benefits from advancements in drying technologies that enhance the taste and texture of the products. Additionally, the growing trend of plant-based and clean label foods, along with the increasing awareness of the health benefits of vegetables, is propelling market growth.
Dried Vegetable Snacks Competitive Landscape
The market report analyses the leading companies in the industry including Bare Snacks, Concord Foods, Crunshies Foods, Greenday, Made In Nature, Nim’s, Nothing But Snacks, Pulse Master, SABAVA, Spare Snacks, and Others.
Dried Vegetable Snacks Market Dynamics
Dried Vegetable Snacks Market Trend: Growing Demand for Healthy and Natural Snacks
The dried vegetable snacks market is experiencing a significant trend towards healthy and natural snacking options. As consumers become increasingly health-conscious, there is a marked shift away from traditional, high-calorie, and processed snacks towards options that offer nutritional benefits without compromising on taste. Dried vegetable snacks, made from a variety of vegetables like kale, carrots, and sweet potatoes, are gaining popularity for their natural ingredients, low calorie count, and high vitamin and fiber content. This trend is particularly strong among millennials and Gen Z, who prioritize health and wellness in their dietary choices and are willing to try innovative, healthier snack alternatives.
Dried Vegetable Snacks Market Driver: Rising Awareness of Nutritional Benefits
A key driver for the dried vegetable snacks market is the rising awareness of the nutritional benefits associated with vegetable consumption. As public health campaigns and nutritional education emphasize the importance of incorporating vegetables into daily diets, consumers are looking for convenient ways to increase their vegetable intake. Dried vegetable snacks provide an easy, on-the-go solution that retains much of the nutritional value of fresh vegetables. The increasing prevalence of lifestyle-related health issues, such as obesity and diabetes, also drives consumers to seek out healthier snack options. Marketing efforts that highlight the health benefits, such as high fiber content, vitamins, and antioxidants, play a crucial role in driving demand.
Dried Vegetable Snacks Market Opportunity: Expansion through Flavor Innovation and Diversified Product Lines
The dried vegetable snacks market holds significant opportunities for expansion through flavor innovation and diversified product lines. Companies can attract a wider consumer base by introducing new and exciting flavors, such as spiced, seasoned, or exotic vegetable blends, catering to diverse taste preferences. Additionally, developing organic, gluten-free, and non-GMO variants can appeal to health-conscious consumers seeking clean-label products. Leveraging digital marketing and e-commerce platforms can enhance product visibility and accessibility, tapping into the growing trend of online grocery shopping. Collaborations with chefs and food influencers to create recipes and promote dried vegetable snacks can also drive market growth and consumer engagement.
Dried Vegetable Snacks Market Share Analysis: Pumpkin segment generated the highest revenue share in the industry
The largest segment in the Dried Vegetable Snacks Market is the "Pumpkin" type. Pumpkin snacks have gained immense popularity due to their nutritional value, unique flavor, and versatility in various culinary applications. Dried pumpkin snacks are rich in essential nutrients like vitamins, minerals, antioxidants, and fiber, making them a healthy and convenient snacking option. They appeal to health-conscious consumers looking for nutritious alternatives to traditional snacks. Additionally, dried pumpkin snacks are often used as ingredients in recipes for baked goods, cereals, granola bars, and trail mixes, further expanding their market reach and demand.
Dried Vegetable Snacks Market Share Analysis: Snacks is the fastest growing segment over the forecast period to 2032
The fastest-growing segment in the Dried Vegetable Snacks Market is the "Snacks" application. With the growing emphasis on health and wellness, consumers are increasingly seeking snacks that offer nutritional benefits without compromising on taste. Dried vegetable snacks, including pumpkin, broccoli, okra, and tomato varieties, are gaining traction as they provide a combination of healthfulness and flavor. The Snacks application segment encompasses a wide range of products, such as vegetable chips, crisps, dehydrated vegetable packs, and mixed vegetable snacks. As consumers shift towards healthier snack options, the demand for dried vegetable snacks in the Snacks application segment is expected to experience rapid growth, making it the fastest-growing segment in the Dried Vegetable Snacks Market.
Dried Vegetable Snacks Market Segmentation
By Type
Broccoli
Okra
Pumpkin
Tomato
Others
By Application
Snacks
Food Decorations
Others
Countries Analyzed
North America (US, Canada, Mexico)
Europe (Germany, UK, France, Spain, Italy, Russia, Rest of Europe)
Asia Pacific (China, India, Japan, South Korea, Australia, South East Asia, Rest of Asia)
South America (Brazil, Argentina, Rest of South America)
Middle East and Africa (Saudi Arabia, UAE, Rest of Middle East, South Africa, Egypt, Rest of Africa)
Dried Vegetable Snacks Companies Profiled in the Study
Bare Snacks
Concord Foods
Crunshies Foods
Greenday
Made In Nature
Nim’s
Nothing But Snacks
Pulse Master
SABAVA
Spare Snacks
*- List Not Exhaustive
Chapter 1. TABLE OF CONTENTS
Chapter 2. Introduction to Dried Vegetable Snacks Market
2.1. Market Overview
2.2. Key Statistics and Report Highlights
2.3. Scope of the Comprehensive Study
2.3.1. Market Definition
2.3.2 Countries and Regions Covered
2.3.3 Research Objective
2.3.4 Units, Currency, and Conversions
2.3.5 Industry Value Chain
2.4. Key Market Segments
2.5. Key Companies
2.6. Study Period
Chapter 3. Strategic Analysis Review
3.1. Dried Vegetable Snacks Pricing Analysis and Forecast
3.2. Porter’s Five Forces
3.3. Market Ecosystem
3.4. SWOT Analysis
3.5. Regulatory Scenario
3.3. Effects of Inflation, Russia-Ukraine War, moderating economic growth, and other macroeconomic factors
Chapter 4. Competitive Landscape
4.1. Market Share Analysis
4.1.1. Global Dried Vegetable Snacks Market Share by Company, 2023
4.1.2. Product Offerings of Leading Dried Vegetable Snacks Companies
4.2. Market Entropy
4.2.1. New Product Launches in the Industry
4.2.2. Mergers, Acquisitions, Joint ventures, and Partnerships
4.3. Key Strategies and Best Practices
Chapter 5. Global Market Projections: Best, Reference, and Low Case Scenarios
5.1. Growth Analysis- Case Scenario Definitions
5.2. Low Growth Case Scenario Forecasts
5.3. Reference Growth Case Scenario Forecasts
5.4. High Growth Case Scenario Forecasts
Chapter 6. Market Dynamics
6.1. Dried Vegetable Snacks Market Drivers
6.2. Dried Vegetable Snacks Market Challenges
6.6. Dried Vegetable Snacks Market Opportunities
6.4. Dried Vegetable Snacks Market Trends
Chapter 7. Global Dried Vegetable Snacks Market Outlook Trends
7.1. Global Dried Vegetable Snacks Revenue (USD Million) and CAGR (%) by Type (2021-2032)
7.2. Global Dried Vegetable Snacks Revenue (USD Million) and CAGR (%) by Application (2021-2032)
7.3. Global Dried Vegetable Snacks Revenue (USD Million) and CAGR (%) by Product (2021-2032)
By Type
Broccoli
Okra
Pumpkin
Tomato
Others
By Application
Snacks
Food Decorations
Others
Chapter 8. Global Dried Vegetable Snacks Regional Analysis and Outlook
8.1. Global Dried Vegetable Snacks Revenue (USD Million) By Regions (2021- 2032)
8.2. North America Dried Vegetable Snacks Revenue (USD Million) by Country (2021-2032)
8.2.1. United States Dried Vegetable Snacks Regional Analysis and Outlook
8.2.2. Canada Dried Vegetable Snacks Regional Analysis and Outlook
8.2.3. Mexico Dried Vegetable Snacks Regional Analysis and Outlook
8.3. Europe Dried Vegetable Snacks Revenue (USD Million), by Country (2021-2032)
8.3.1. Germany Dried Vegetable Snacks Regional Analysis and Outlook
8.3.2. France Dried Vegetable Snacks Regional Analysis and Outlook
8.3.3. United Kingdom Dried Vegetable Snacks Regional Analysis and Outlook
8.3.4. Spain Dried Vegetable Snacks Regional Analysis and Outlook
8.3.5. Italy Dried Vegetable Snacks Regional Analysis and Outlook
8.3.6. Russia Dried Vegetable Snacks Regional Analysis and Outlook
8.3.7. Rest of Europe Dried Vegetable Snacks Regional Analysis and Outlook
8.4. Asia Pacific Dried Vegetable Snacks Revenue (USD Million) by Country (2021-2032)
8.4.1. China Dried Vegetable Snacks Regional Analysis and Outlook
8.4.2. Japan Dried Vegetable Snacks Regional Analysis and Outlook
8.4.3. India Dried Vegetable Snacks Regional Analysis and Outlook
8.4.4. South Korea Dried Vegetable Snacks Regional Analysis and Outlook
8.4.5. Australia Dried Vegetable Snacks Regional Analysis and Outlook
8.4.6. South East Asia Dried Vegetable Snacks Regional Analysis and Outlook
8.4.7. Rest of Asia Pacific Dried Vegetable Snacks Regional Analysis and Outlook
8.5. South America Dried Vegetable Snacks Revenue (USD Million), by Country (2021-2032)
8.5.1. Brazil Dried Vegetable Snacks Regional Analysis and Outlook
8.5.2. Argentina Dried Vegetable Snacks Regional Analysis and Outlook
8.5.3. Rest of South America Dried Vegetable Snacks Regional Analysis and Outlook
8.6. Middle East and Africa Dried Vegetable Snacks Revenue (USD Million) by Country (2021-2032)
8.6.1. Middle East Dried Vegetable Snacks Regional Analysis and Outlook
8.6.2. Africa Dried Vegetable Snacks Regional Analysis and Outlook
Chapter 9. North America Dried Vegetable Snacks Analysis and Outlook
9.1. North America Dried Vegetable Snacks Revenue (USD Million) by Segments (2021-2032)
9.1.1. North America Dried Vegetable Snacks Revenue (USD Million) by Type (2021-2032)
9.1.2. North America Dried Vegetable Snacks Revenue (USD Million) by Application (2021-2032)
9.1.3. North America Dried Vegetable Snacks Revenue (USD Million) by Product (2021-2032)
By Type
Broccoli
Okra
Pumpkin
Tomato
Others
By Application
Snacks
Food Decorations
Others
Chapter 10. Europe Dried Vegetable Snacks Analysis and Outlook
10.1. Europe Dried Vegetable Snacks Revenue (USD Million), by Segments (USD Million) (2021-2032)
10.1.1. Europe Dried Vegetable Snacks Revenue (USD Million) by Type (2021-2032)
10.1.2. Europe Dried Vegetable Snacks Revenue (USD Million) by Application (2021-2032)
10.1.3. Europe Dried Vegetable Snacks Revenue (USD Million) by Product (2021-2032)
By Type
Broccoli
Okra
Pumpkin
Tomato
Others
By Application
Snacks
Food Decorations
Others
Chapter 11. Asia Pacific Dried Vegetable Snacks Analysis and Outlook
11.1. Asia Pacific Dried Vegetable Snacks Revenue (USD Million), and Revenue (USD Million) by Segments (2021-2032)
11.1.1. Asia Pacific Dried Vegetable Snacks Revenue (USD Million) by Type (2021-2032)
11.1.2. Asia Pacific Dried Vegetable Snacks Revenue (USD Million) by Application (2021-2032)
11.1.3. Asia Pacific Dried Vegetable Snacks Revenue (USD Million) by Product (2021-2032)
By Type
Broccoli
Okra
Pumpkin
Tomato
Others
By Application
Snacks
Food Decorations
Others
Chapter 12. South America Dried Vegetable Snacks Analysis and Outlook
12.1. South America Dried Vegetable Snacks Revenue (USD Million), by Segments (2021-2032)
12.1.1. South America Dried Vegetable Snacks Revenue (USD Million) by Type (2021-2032)
12.1.2. South America Dried Vegetable Snacks Revenue (USD Million) by Application (2021-2032)
12.1.3. South America Dried Vegetable Snacks Revenue (USD Million) by Product (2021-2032)
By Type
Broccoli
Okra
Pumpkin
Tomato
Others
By Application
Snacks
Food Decorations
Others
Chapter 13. Middle East and Africa Dried Vegetable Snacks Analysis and Outlook
13.1. Middle East and Africa Dried Vegetable Snacks Revenue (USD Million), by Segments (2021-2032)
13.1.1. Middle East and Africa Dried Vegetable Snacks Revenue (USD Million) by Type (2021-2032)
13.1.2. Middle East and Africa Dried Vegetable Snacks Revenue (USD Million) by Application (2021-2032)
13.1.3. Middle East and Africa Dried Vegetable Snacks Revenue (USD Million) by Product (2021-2032)
By Type
Broccoli
Okra
Pumpkin
Tomato
Others
By Application
Snacks
Food Decorations
Others
Chapter 14. Dried Vegetable Snacks Company Profiles
14.1 Business Overview
14.2 Product Profiles
14.3 SWOT Profiles
14.5 Recent Developments
14.6 Financial Profile
List of Companies
Bare Snacks
Concord Foods
Crunshies Foods
Greenday
Made In Nature
Nim’s
Nothing But Snacks
Pulse Master
SABAVA
Spare Snacks
15. Methodology and Data Sources
15.1 Customization Offerings
15.2 Subscription Services
15.3 Related Reports
15.4 Publisher Expertise
LIST OF TABLES
Table 1 Market Segmentation Analysis
Table 2 Global Dried Vegetable Snacks Market Share of Leading Companies, 2023
Table 3 Product Offerings of Leading Companies
Table 4 Low Growth Scenario Forecasts
Table 5 Reference Case Growth Scenario
Table 6 High Growth Case Scenario
Table 7 Global Dried Vegetable Snacks Revenue (USD Million) And CAGR (%) By Type (2021-2032)
Table 8 Global Dried Vegetable Snacks Revenue (USD Million) And CAGR (%) By Application (2021-2032)
Table 9 Global Dried Vegetable Snacks Revenue (USD Million) And CAGR (%) By Product (2021-2032)
Table 10 Global Dried Vegetable Snacks Market Revenue (USD Million) By Regions (2021-2032)
Table 11 Global Dried Vegetable Snacks Market Share (%) By Regions (2021-2032)
Table 12 North America Dried Vegetable Snacks Revenue (USD Million) By Country (2021-2032)
Table 13 Europe Dried Vegetable Snacks Revenue (USD Million) By Country (2021-2032)
Table 14 Asia Pacific Dried Vegetable Snacks Revenue (USD Million) By Country (2021-2032)
Table 15 South America Dried Vegetable Snacks Revenue (USD Million) By Country (2021-2032)
Table 16 Middle East and Africa Dried Vegetable Snacks Revenue (USD Million) By Region (2021-2032)
Table 17 North America Dried Vegetable Snacks Revenue (USD Million) By Type (2021-2032)
Table 18 North America Dried Vegetable Snacks Revenue (USD Million) By Application (2021-2032)
Table 19 North America Dried Vegetable Snacks Revenue (USD Million) By Product (2021-2032)
Table 20 Europe Dried Vegetable Snacks Revenue (USD Million) By Type (2021-2032)
Table 21 Europe Dried Vegetable Snacks Revenue (USD Million) By Application (2021-2032)
Table 22 Europe Dried Vegetable Snacks Revenue (USD Million) By Product (2021-2032)
Table 23 Asia Pacific Dried Vegetable Snacks Revenue (USD Million) By Type (2021-2032)
Table 24 Asia Pacific Dried Vegetable Snacks Revenue (USD Million) By Application (2021-2032)
Table 25 Asia Pacific Dried Vegetable Snacks Revenue (USD Million) By Product (2021-2032)
Table 26 South America Dried Vegetable Snacks Revenue (USD Million) By Type (2021-2032)
Table 27 South America Dried Vegetable Snacks Revenue (USD Million) By Application (2021-2032)
Table 28 South America Dried Vegetable Snacks Revenue (USD Million) By Product (2021-2032)
Table 29 Middle East and Africa Dried Vegetable Snacks Revenue (USD Million) By Type (2021-2032)
Table 30 Middle East and Africa Dried Vegetable Snacks Revenue (USD Million) By Application (2021-2032)
Table 31 Middle East and Africa Dried Vegetable Snacks Revenue (USD Million) By Product (2021-2032)
LIST OF FIGURES
Figure 1. Market Scope
Figure 2. Pricing Forecasts Per Unit, 2023- 2032
Figure 3. Porter’s Five Forces
Figure 4. Global Dried Vegetable Snacks Market Revenue (USD Million) By Regions (2021-2032)
Figure 5. Global Dried Vegetable Snacks Market Share (%) By Regions (2023)
Figure 6. North America Dried Vegetable Snacks Revenue (USD Million) By Country (2021-2032)
Figure 7. United States Dried Vegetable Snacks Revenue (USD Million) By Country (2021-2032)
Figure 8. Canada Dried Vegetable Snacks Revenue (USD Million) By Country (2021-2032)
Figure 9. Mexico Dried Vegetable Snacks Revenue (USD Million) By Country (2021-2032)
Figure 10. Europe Dried Vegetable Snacks Revenue (USD Million) By Country (2021-2032)
Figure 11. Germany Dried Vegetable Snacks Revenue (USD Million) By Country (2021-2032)
Figure 12. France Dried Vegetable Snacks Revenue (USD Million) By Country (2021-2032)
Figure 13. United Kingdom Dried Vegetable Snacks Revenue (USD Million) By Country (2021-2032)
Figure 14. Spain Dried Vegetable Snacks Revenue (USD Million) By Country (2021-2032)
Figure 15. Italy Dried Vegetable Snacks Revenue (USD Million) By Country (2021-2032)
Figure 16. Russia Dried Vegetable Snacks Revenue (USD Million) By Country (2021-2032)
Figure 17. Rest of Europe Dried Vegetable Snacks Revenue (USD Million) By Country (2021-2032)
Figure 11. Asia Pacific Dried Vegetable Snacks Revenue (USD Million) By Country (2021-2032)
Figure 12. China Dried Vegetable Snacks Revenue (USD Million) By Country (2021-2032)
Figure 13. Japan Dried Vegetable Snacks Revenue (USD Million) By Country (2021-2032)
Figure 14. India Dried Vegetable Snacks Revenue (USD Million) By Country (2021-2032)
Figure 15. South Korea Dried Vegetable Snacks Revenue (USD Million) By Country (2021-2032)
Figure 16. Australia Dried Vegetable Snacks Revenue (USD Million) By Country (2021-2032)
Figure 17. South East Asia Dried Vegetable Snacks Revenue (USD Million) By Country (2021-2032)
Figure 18. South America Dried Vegetable Snacks Revenue (USD Million) By Country (2021-2032)
Figure 19. Brazil Dried Vegetable Snacks Revenue (USD Million) By Country (2021-2032)
Figure 20. Argentina Dried Vegetable Snacks Revenue (USD Million) By Country (2021-2032)
Figure 21. Rest of Asia Pacific Dried Vegetable Snacks Revenue (USD Million) By Country (2021-2032)
Figure 22. Middle East and Africa Dried Vegetable Snacks Revenue (USD Million) By Region (2021-2032)
Figure 23. Saudi Arabia Dried Vegetable Snacks Revenue (USD Million) By Region (2021-2032)
Figure 24. The UAE Dried Vegetable Snacks Revenue (USD Million) By Region (2021-2032)
Figure 25. Rest of Middle East Dried Vegetable Snacks Revenue (USD Million) By Region (2021-2032)
Figure 26. South Africa Dried Vegetable Snacks Revenue (USD Million) By Region (2021-2032)
Figure 27. Africa Dried Vegetable Snacks Revenue (USD Million) By Region (2021-2032)
Figure 28. North America Dried Vegetable Snacks Revenue (USD Million) By Type (2021-2032)
Figure 29. North America Dried Vegetable Snacks Revenue (USD Million) By Application (2021-2032)
Figure 30. North America Dried Vegetable Snacks Revenue (USD Million) By Product (2021-2032)
Figure 31. Europe Dried Vegetable Snacks Revenue (USD Million) By Type (2021-2032)
Figure 32. Europe Dried Vegetable Snacks Revenue (USD Million) By Application (2021-2032)
Figure 33. Europe Dried Vegetable Snacks Revenue (USD Million) By Product (2021-2032)
Figure 34. Asia Pacific Dried Vegetable Snacks Revenue (USD Million) By Type (2021-2032)
Figure 35. Asia Pacific Dried Vegetable Snacks Revenue (USD Million) By Application (2021-2032)
Figure 36. Asia Pacific Dried Vegetable Snacks Revenue (USD Million) By Product (2021-2032)
Figure 37. South America Dried Vegetable Snacks Revenue (USD Million) By Type (2021-2032)
Figure 38. South America Dried Vegetable Snacks Revenue (USD Million) By Application (2021-2032)
Figure 39. South America Dried Vegetable Snacks Revenue (USD Million) By Product (2021-2032)
Figure 40. Middle East and Africa Dried Vegetable Snacks Revenue (USD Million) By Type (2021-2032)
Figure 41. Middle East and Africa Dried Vegetable Snacks Revenue (USD Million) By Application (2021-2032)
Figure 42. Middle East and Africa Dried Vegetable Snacks Revenue (USD Million) By Product (2021-2032)
By Type
Broccoli
Okra
Pumpkin
Tomato
Others
By Application
Snacks
Food Decorations
Others
Countries Analyzed
North America (US, Canada, Mexico)
Europe (Germany, UK, France, Spain, Italy, Russia, Rest of Europe)
Asia Pacific (China, India, Japan, South Korea, Australia, South East Asia, Rest of Asia)
South America (Brazil, Argentina, Rest of South America)
Middle East and Africa (Saudi Arabia, UAE, Rest of Middle East, South Africa, Egypt, Rest of Africa)
