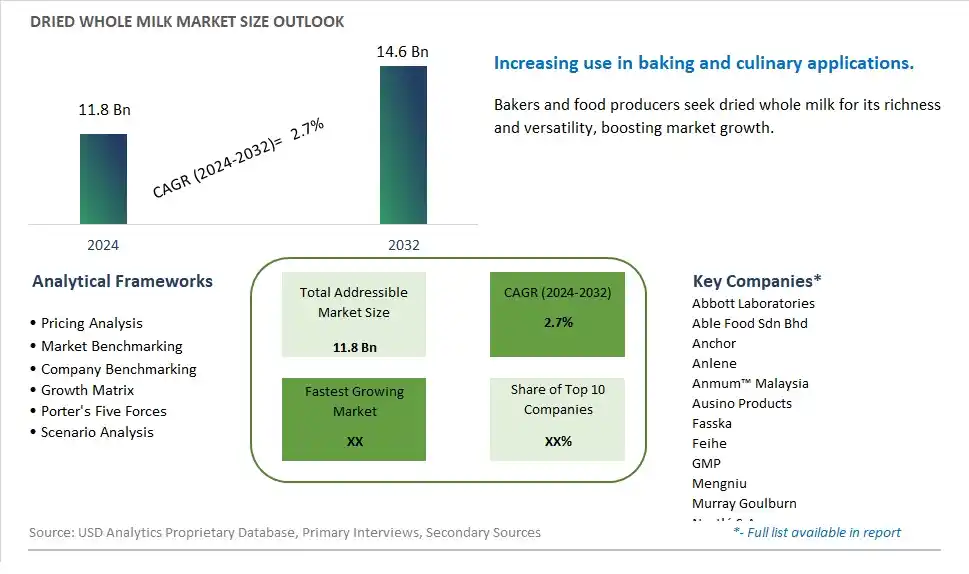
Global Dried Whole Milk Market Size is valued at $11.8 Billion in 2024 and is forecast to register a growth rate (CAGR) of 2.7% to reach $14.6 Billion by 2032.
The global Dried Whole Milk Market Comprehensive Study analyzes and forecasts the market size across 6 regions and 24 countries for diverse segments -By Type (Regular, Instant), By Application (Infant formula, Desserts, Baked goods, Others)
An Introduction to Dried Whole Milk Market
In 2024, the Dried Whole Milk market is witnessing robust growth, driven by the increasing demand for versatile and long-lasting dairy products. Dried whole milk is widely used in the food and beverage industry for its rich taste and high nutritional content. The market benefits from the growing trend of health-conscious eating and the rising demand for high-protein and nutrient-dense food products. Additionally, advancements in drying technologies and the increasing use of dried whole milk in bakery, confectionery, and dairy products are contributing to market expansion.
Dried Whole Milk Competitive Landscape
The market report analyses the leading companies in the industry including Abbott Laboratories, Able Food Sdn Bhd, Anchor, Anlene, Anmum™ Malaysia, Ausino Products, Fasska, Feihe, GMP, Mengniu, Murray Goulburn, Nestlé S.A., Régilait, Tatura, Vreugdenhil Dairy, Wondersun, Yashily, Yili, and Others.
Dried Whole Milk Market Dynamics
Dried Whole Milk Market Trend: Increasing Preference for Shelf-Stable Dairy Products
The dried whole milk market is witnessing a significant trend towards shelf-stable dairy products. With the rising demand for long-lasting and easily transportable food items, consumers are increasingly opting for dried whole milk as a convenient alternative to fresh milk. This trend is particularly strong in regions with limited refrigeration infrastructure and among consumers who prioritize pantry-stable foods for their longevity and reduced spoilage risk. The versatility of dried whole milk, which can be reconstituted for drinking or used as an ingredient in cooking and baking, further supports its growing popularity.
Dried Whole Milk Market Driver: Growing Awareness of Nutritional Benefits
A major driver for the dried whole milk market is the growing awareness of its nutritional benefits. Dried whole milk retains all the essential nutrients of fresh milk, including proteins, vitamins, and minerals, making it an attractive option for health-conscious consumers. As people become more informed about the importance of balanced diets and nutrient intake, the demand for nutrient-dense food products like dried whole milk increases. This driver is also supported by the convenience of having a reliable source of dairy nutrition that does not require refrigeration, making it ideal for various uses in different settings, including home, travel, and emergency preparedness.
Dried Whole Milk Market Opportunity: Expansion in Emerging Markets and E-Commerce
The dried whole milk market presents significant opportunities for expansion in emerging markets and through e-commerce platforms. In emerging markets, where refrigeration infrastructure may be limited, the demand for shelf-stable dairy products is high. Companies can leverage this opportunity by expanding their distribution networks and introducing dried whole milk to new regions. Additionally, the growing trend of online shopping provides a lucrative avenue for reaching a broader consumer base. Developing strong online sales channels and engaging in targeted digital marketing can increase product visibility and accessibility, driving growth in both established and new markets. Collaborations with local retailers and influencers to promote the benefits and versatility of dried whole milk can further enhance market penetration and consumer engagement.
Dried Whole Milk Market Share Analysis: Regular segment generated the highest revenue share in the industry
The largest segment in the Dried Whole Milk Market is the "Regular" type. Regular dried whole milk refers to milk that has been dehydrated and retains its full-fat content, offering a rich and creamy taste similar to fresh whole milk. This type of dried whole milk is widely used in various food and beverage applications due to its versatility and nutritional profile. It is a popular choice for baking, cooking, and preparing beverages like hot chocolate and milkshakes. Regular dried whole milk is also favored by consumers who prefer the taste and texture of full-fat dairy products and seek the nutritional benefits associated with whole milk.
Dried Whole Milk Market Share Analysis: Infant Formula is the fastest growing segment over the forecast period to 2032
The fastest-growing segment in the Dried Whole Milk Market is the "Infant Formula" application. Dried whole milk is a key ingredient in the formulation of infant formula due to its nutritional composition that closely mimics that of natural breast milk. Infant formula manufacturers use dried whole milk to create products that provide essential nutrients such as protein, fat, vitamins, and minerals necessary for the healthy growth and development of infants. As the demand for infant formula continues to rise globally, driven by factors such as increasing birth rates, changing lifestyles, and rising awareness about infant nutrition, the demand for dried whole milk in the Infant Formula application segment is expected to experience significant growth, making it the fastest-growing segment in the Dried Whole Milk Market.
Dried Whole Milk Market Segmentation
By Type
Regular
Instant
By Application
Infant formula
Desserts
Baked goods
Others
Countries Analyzed
North America (US, Canada, Mexico)
Europe (Germany, UK, France, Spain, Italy, Russia, Rest of Europe)
Asia Pacific (China, India, Japan, South Korea, Australia, South East Asia, Rest of Asia)
South America (Brazil, Argentina, Rest of South America)
Middle East and Africa (Saudi Arabia, UAE, Rest of Middle East, South Africa, Egypt, Rest of Africa)
Dried Whole Milk Companies Profiled in the Study
Abbott Laboratories
Able Food Sdn Bhd
Anchor
Anlene
Anmum™ Malaysia
Ausino Products
Fasska
Feihe
GMP
Mengniu
Murray Goulburn
Nestlé S.A.
Régilait
Tatura
Vreugdenhil Dairy
Wondersun
Yashily
Yili
*- List Not Exhaustive
Chapter 1. TABLE OF CONTENTS
Chapter 2. Introduction to Dried Whole Milk Market
2.1. Market Overview
2.2. Key Statistics and Report Highlights
2.3. Scope of the Comprehensive Study
2.3.1. Market Definition
2.3.2 Countries and Regions Covered
2.3.3 Research Objective
2.3.4 Units, Currency, and Conversions
2.3.5 Industry Value Chain
2.4. Key Market Segments
2.5. Key Companies
2.6. Study Period
Chapter 3. Strategic Analysis Review
3.1. Dried Whole Milk Pricing Analysis and Forecast
3.2. Porter’s Five Forces
3.3. Market Ecosystem
3.4. SWOT Analysis
3.5. Regulatory Scenario
3.3. Effects of Inflation, Russia-Ukraine War, moderating economic growth, and other macroeconomic factors
Chapter 4. Competitive Landscape
4.1. Market Share Analysis
4.1.1. Global Dried Whole Milk Market Share by Company, 2023
4.1.2. Product Offerings of Leading Dried Whole Milk Companies
4.2. Market Entropy
4.2.1. New Product Launches in the Industry
4.2.2. Mergers, Acquisitions, Joint ventures, and Partnerships
4.3. Key Strategies and Best Practices
Chapter 5. Global Market Projections: Best, Reference, and Low Case Scenarios
5.1. Growth Analysis- Case Scenario Definitions
5.2. Low Growth Case Scenario Forecasts
5.3. Reference Growth Case Scenario Forecasts
5.4. High Growth Case Scenario Forecasts
Chapter 6. Market Dynamics
6.1. Dried Whole Milk Market Drivers
6.2. Dried Whole Milk Market Challenges
6.6. Dried Whole Milk Market Opportunities
6.4. Dried Whole Milk Market Trends
Chapter 7. Global Dried Whole Milk Market Outlook Trends
7.1. Global Dried Whole Milk Revenue (USD Million) and CAGR (%) by Type (2021-2032)
7.2. Global Dried Whole Milk Revenue (USD Million) and CAGR (%) by Application (2021-2032)
7.3. Global Dried Whole Milk Revenue (USD Million) and CAGR (%) by Product (2021-2032)
By Type
Regular
Instant
By Application
Infant formula
Desserts
Baked goods
Others
Chapter 8. Global Dried Whole Milk Regional Analysis and Outlook
8.1. Global Dried Whole Milk Revenue (USD Million) By Regions (2021- 2032)
8.2. North America Dried Whole Milk Revenue (USD Million) by Country (2021-2032)
8.2.1. United States Dried Whole Milk Regional Analysis and Outlook
8.2.2. Canada Dried Whole Milk Regional Analysis and Outlook
8.2.3. Mexico Dried Whole Milk Regional Analysis and Outlook
8.3. Europe Dried Whole Milk Revenue (USD Million), by Country (2021-2032)
8.3.1. Germany Dried Whole Milk Regional Analysis and Outlook
8.3.2. France Dried Whole Milk Regional Analysis and Outlook
8.3.3. United Kingdom Dried Whole Milk Regional Analysis and Outlook
8.3.4. Spain Dried Whole Milk Regional Analysis and Outlook
8.3.5. Italy Dried Whole Milk Regional Analysis and Outlook
8.3.6. Russia Dried Whole Milk Regional Analysis and Outlook
8.3.7. Rest of Europe Dried Whole Milk Regional Analysis and Outlook
8.4. Asia Pacific Dried Whole Milk Revenue (USD Million) by Country (2021-2032)
8.4.1. China Dried Whole Milk Regional Analysis and Outlook
8.4.2. Japan Dried Whole Milk Regional Analysis and Outlook
8.4.3. India Dried Whole Milk Regional Analysis and Outlook
8.4.4. South Korea Dried Whole Milk Regional Analysis and Outlook
8.4.5. Australia Dried Whole Milk Regional Analysis and Outlook
8.4.6. South East Asia Dried Whole Milk Regional Analysis and Outlook
8.4.7. Rest of Asia Pacific Dried Whole Milk Regional Analysis and Outlook
8.5. South America Dried Whole Milk Revenue (USD Million), by Country (2021-2032)
8.5.1. Brazil Dried Whole Milk Regional Analysis and Outlook
8.5.2. Argentina Dried Whole Milk Regional Analysis and Outlook
8.5.3. Rest of South America Dried Whole Milk Regional Analysis and Outlook
8.6. Middle East and Africa Dried Whole Milk Revenue (USD Million) by Country (2021-2032)
8.6.1. Middle East Dried Whole Milk Regional Analysis and Outlook
8.6.2. Africa Dried Whole Milk Regional Analysis and Outlook
Chapter 9. North America Dried Whole Milk Analysis and Outlook
9.1. North America Dried Whole Milk Revenue (USD Million) by Segments (2021-2032)
9.1.1. North America Dried Whole Milk Revenue (USD Million) by Type (2021-2032)
9.1.2. North America Dried Whole Milk Revenue (USD Million) by Application (2021-2032)
9.1.3. North America Dried Whole Milk Revenue (USD Million) by Product (2021-2032)
By Type
Regular
Instant
By Application
Infant formula
Desserts
Baked goods
Others
Chapter 10. Europe Dried Whole Milk Analysis and Outlook
10.1. Europe Dried Whole Milk Revenue (USD Million), by Segments (USD Million) (2021-2032)
10.1.1. Europe Dried Whole Milk Revenue (USD Million) by Type (2021-2032)
10.1.2. Europe Dried Whole Milk Revenue (USD Million) by Application (2021-2032)
10.1.3. Europe Dried Whole Milk Revenue (USD Million) by Product (2021-2032)
By Type
Regular
Instant
By Application
Infant formula
Desserts
Baked goods
Others
Chapter 11. Asia Pacific Dried Whole Milk Analysis and Outlook
11.1. Asia Pacific Dried Whole Milk Revenue (USD Million), and Revenue (USD Million) by Segments (2021-2032)
11.1.1. Asia Pacific Dried Whole Milk Revenue (USD Million) by Type (2021-2032)
11.1.2. Asia Pacific Dried Whole Milk Revenue (USD Million) by Application (2021-2032)
11.1.3. Asia Pacific Dried Whole Milk Revenue (USD Million) by Product (2021-2032)
By Type
Regular
Instant
By Application
Infant formula
Desserts
Baked goods
Others
Chapter 12. South America Dried Whole Milk Analysis and Outlook
12.1. South America Dried Whole Milk Revenue (USD Million), by Segments (2021-2032)
12.1.1. South America Dried Whole Milk Revenue (USD Million) by Type (2021-2032)
12.1.2. South America Dried Whole Milk Revenue (USD Million) by Application (2021-2032)
12.1.3. South America Dried Whole Milk Revenue (USD Million) by Product (2021-2032)
By Type
Regular
Instant
By Application
Infant formula
Desserts
Baked goods
Others
Chapter 13. Middle East and Africa Dried Whole Milk Analysis and Outlook
13.1. Middle East and Africa Dried Whole Milk Revenue (USD Million), by Segments (2021-2032)
13.1.1. Middle East and Africa Dried Whole Milk Revenue (USD Million) by Type (2021-2032)
13.1.2. Middle East and Africa Dried Whole Milk Revenue (USD Million) by Application (2021-2032)
13.1.3. Middle East and Africa Dried Whole Milk Revenue (USD Million) by Product (2021-2032)
By Type
Regular
Instant
By Application
Infant formula
Desserts
Baked goods
Others
Chapter 14. Dried Whole Milk Company Profiles
14.1 Business Overview
14.2 Product Profiles
14.3 SWOT Profiles
14.5 Recent Developments
14.6 Financial Profile
List of Companies
Abbott Laboratories
Able Food Sdn Bhd
Anchor
Anlene
Anmum™ Malaysia
Ausino Products
Fasska
Feihe
GMP
Mengniu
Murray Goulburn
Nestlé S.A.
Régilait
Tatura
Vreugdenhil Dairy
Wondersun
Yashily
Yili
15. Methodology and Data Sources
15.1 Customization Offerings
15.2 Subscription Services
15.3 Related Reports
15.4 Publisher Expertise
LIST OF TABLES
Table 1 Market Segmentation Analysis
Table 2 Global Dried Whole Milk Market Share of Leading Companies, 2023
Table 3 Product Offerings of Leading Companies
Table 4 Low Growth Scenario Forecasts
Table 5 Reference Case Growth Scenario
Table 6 High Growth Case Scenario
Table 7 Global Dried Whole Milk Revenue (USD Million) And CAGR (%) By Type (2021-2032)
Table 8 Global Dried Whole Milk Revenue (USD Million) And CAGR (%) By Application (2021-2032)
Table 9 Global Dried Whole Milk Revenue (USD Million) And CAGR (%) By Product (2021-2032)
Table 10 Global Dried Whole Milk Market Revenue (USD Million) By Regions (2021-2032)
Table 11 Global Dried Whole Milk Market Share (%) By Regions (2021-2032)
Table 12 North America Dried Whole Milk Revenue (USD Million) By Country (2021-2032)
Table 13 Europe Dried Whole Milk Revenue (USD Million) By Country (2021-2032)
Table 14 Asia Pacific Dried Whole Milk Revenue (USD Million) By Country (2021-2032)
Table 15 South America Dried Whole Milk Revenue (USD Million) By Country (2021-2032)
Table 16 Middle East and Africa Dried Whole Milk Revenue (USD Million) By Region (2021-2032)
Table 17 North America Dried Whole Milk Revenue (USD Million) By Type (2021-2032)
Table 18 North America Dried Whole Milk Revenue (USD Million) By Application (2021-2032)
Table 19 North America Dried Whole Milk Revenue (USD Million) By Product (2021-2032)
Table 20 Europe Dried Whole Milk Revenue (USD Million) By Type (2021-2032)
Table 21 Europe Dried Whole Milk Revenue (USD Million) By Application (2021-2032)
Table 22 Europe Dried Whole Milk Revenue (USD Million) By Product (2021-2032)
Table 23 Asia Pacific Dried Whole Milk Revenue (USD Million) By Type (2021-2032)
Table 24 Asia Pacific Dried Whole Milk Revenue (USD Million) By Application (2021-2032)
Table 25 Asia Pacific Dried Whole Milk Revenue (USD Million) By Product (2021-2032)
Table 26 South America Dried Whole Milk Revenue (USD Million) By Type (2021-2032)
Table 27 South America Dried Whole Milk Revenue (USD Million) By Application (2021-2032)
Table 28 South America Dried Whole Milk Revenue (USD Million) By Product (2021-2032)
Table 29 Middle East and Africa Dried Whole Milk Revenue (USD Million) By Type (2021-2032)
Table 30 Middle East and Africa Dried Whole Milk Revenue (USD Million) By Application (2021-2032)
Table 31 Middle East and Africa Dried Whole Milk Revenue (USD Million) By Product (2021-2032)
LIST OF FIGURES
Figure 1. Market Scope
Figure 2. Pricing Forecasts Per Unit, 2023- 2032
Figure 3. Porter’s Five Forces
Figure 4. Global Dried Whole Milk Market Revenue (USD Million) By Regions (2021-2032)
Figure 5. Global Dried Whole Milk Market Share (%) By Regions (2023)
Figure 6. North America Dried Whole Milk Revenue (USD Million) By Country (2021-2032)
Figure 7. United States Dried Whole Milk Revenue (USD Million) By Country (2021-2032)
Figure 8. Canada Dried Whole Milk Revenue (USD Million) By Country (2021-2032)
Figure 9. Mexico Dried Whole Milk Revenue (USD Million) By Country (2021-2032)
Figure 10. Europe Dried Whole Milk Revenue (USD Million) By Country (2021-2032)
Figure 11. Germany Dried Whole Milk Revenue (USD Million) By Country (2021-2032)
Figure 12. France Dried Whole Milk Revenue (USD Million) By Country (2021-2032)
Figure 13. United Kingdom Dried Whole Milk Revenue (USD Million) By Country (2021-2032)
Figure 14. Spain Dried Whole Milk Revenue (USD Million) By Country (2021-2032)
Figure 15. Italy Dried Whole Milk Revenue (USD Million) By Country (2021-2032)
Figure 16. Russia Dried Whole Milk Revenue (USD Million) By Country (2021-2032)
Figure 17. Rest of Europe Dried Whole Milk Revenue (USD Million) By Country (2021-2032)
Figure 11. Asia Pacific Dried Whole Milk Revenue (USD Million) By Country (2021-2032)
Figure 12. China Dried Whole Milk Revenue (USD Million) By Country (2021-2032)
Figure 13. Japan Dried Whole Milk Revenue (USD Million) By Country (2021-2032)
Figure 14. India Dried Whole Milk Revenue (USD Million) By Country (2021-2032)
Figure 15. South Korea Dried Whole Milk Revenue (USD Million) By Country (2021-2032)
Figure 16. Australia Dried Whole Milk Revenue (USD Million) By Country (2021-2032)
Figure 17. South East Asia Dried Whole Milk Revenue (USD Million) By Country (2021-2032)
Figure 18. South America Dried Whole Milk Revenue (USD Million) By Country (2021-2032)
Figure 19. Brazil Dried Whole Milk Revenue (USD Million) By Country (2021-2032)
Figure 20. Argentina Dried Whole Milk Revenue (USD Million) By Country (2021-2032)
Figure 21. Rest of Asia Pacific Dried Whole Milk Revenue (USD Million) By Country (2021-2032)
Figure 22. Middle East and Africa Dried Whole Milk Revenue (USD Million) By Region (2021-2032)
Figure 23. Saudi Arabia Dried Whole Milk Revenue (USD Million) By Region (2021-2032)
Figure 24. The UAE Dried Whole Milk Revenue (USD Million) By Region (2021-2032)
Figure 25. Rest of Middle East Dried Whole Milk Revenue (USD Million) By Region (2021-2032)
Figure 26. South Africa Dried Whole Milk Revenue (USD Million) By Region (2021-2032)
Figure 27. Africa Dried Whole Milk Revenue (USD Million) By Region (2021-2032)
Figure 28. North America Dried Whole Milk Revenue (USD Million) By Type (2021-2032)
Figure 29. North America Dried Whole Milk Revenue (USD Million) By Application (2021-2032)
Figure 30. North America Dried Whole Milk Revenue (USD Million) By Product (2021-2032)
Figure 31. Europe Dried Whole Milk Revenue (USD Million) By Type (2021-2032)
Figure 32. Europe Dried Whole Milk Revenue (USD Million) By Application (2021-2032)
Figure 33. Europe Dried Whole Milk Revenue (USD Million) By Product (2021-2032)
Figure 34. Asia Pacific Dried Whole Milk Revenue (USD Million) By Type (2021-2032)
Figure 35. Asia Pacific Dried Whole Milk Revenue (USD Million) By Application (2021-2032)
Figure 36. Asia Pacific Dried Whole Milk Revenue (USD Million) By Product (2021-2032)
Figure 37. South America Dried Whole Milk Revenue (USD Million) By Type (2021-2032)
Figure 38. South America Dried Whole Milk Revenue (USD Million) By Application (2021-2032)
Figure 39. South America Dried Whole Milk Revenue (USD Million) By Product (2021-2032)
Figure 40. Middle East and Africa Dried Whole Milk Revenue (USD Million) By Type (2021-2032)
Figure 41. Middle East and Africa Dried Whole Milk Revenue (USD Million) By Application (2021-2032)
Figure 42. Middle East and Africa Dried Whole Milk Revenue (USD Million) By Product (2021-2032)
By Type
Regular
Instant
By Application
Infant formula
Desserts
Baked goods
Others
Countries Analyzed
North America (US, Canada, Mexico)
Europe (Germany, UK, France, Spain, Italy, Russia, Rest of Europe)
Asia Pacific (China, India, Japan, South Korea, Australia, South East Asia, Rest of Asia)
South America (Brazil, Argentina, Rest of South America)
Middle East and Africa (Saudi Arabia, UAE, Rest of Middle East, South Africa, Egypt, Rest of Africa)
