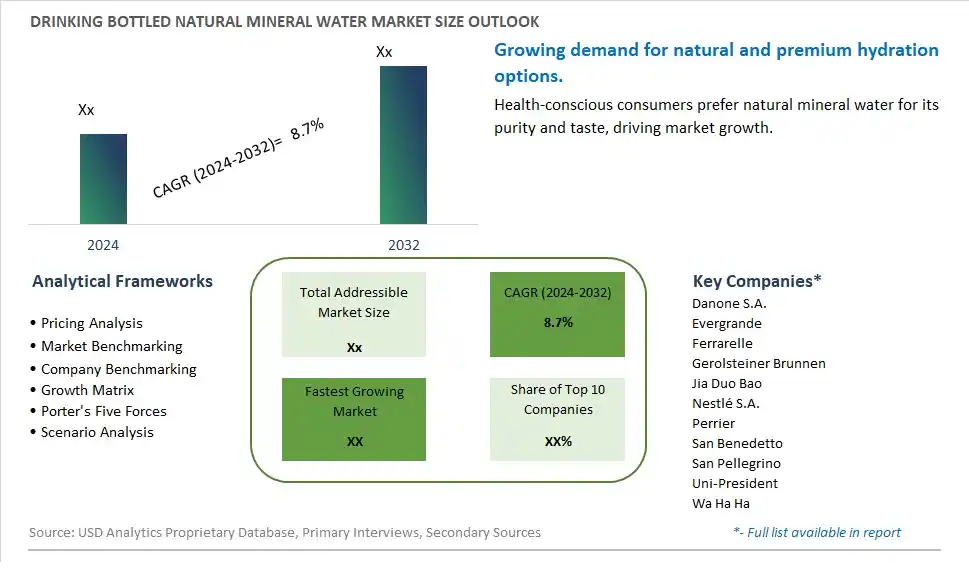
Global Drinking Bottled Natural Mineral Water Market Size is valued at $XX Million in 2024 and is forecast to register a growth rate (CAGR) of 8.7% to reach $XX Million by 2032.
The global Drinking Bottled Natural Mineral Water Market Comprehensive Study analyzes and forecasts the market size across 6 regions and 24 countries for diverse segments -By Type (Natural Mineral Water Containing Gas, Inflatable Natural Mineral Water, Airless Natural Mineral Water, Degassed Natural Mineral Water), By Application (Family, Office, School, Government, Others)
An Introduction to Drinking Bottled Natural Mineral Water Market
The Drinking Bottled Natural Mineral Water market in 2024 is thriving, driven by the increasing demand for convenient and healthy hydration options. Natural mineral water, known for its purity and mineral content, is becoming a preferred choice among health-conscious consumers. The market benefits from the rising awareness of the health benefits of mineral water and the growing trend of premium and exotic bottled water varieties. Additionally, advancements in packaging technologies and the increasing focus on sustainability and eco-friendly packaging are contributing to market growth.
Drinking Bottled Natural Mineral Water Competitive Landscape
The market report analyses the leading companies in the industry including Danone S.A., Evergrande, Ferrarelle, Gerolsteiner Brunnen, Jia Duo Bao, Nestlé S.A., Perrier, San Benedetto, San Pellegrino, Uni-President, Wa Ha Ha, and Others.
Drinking Bottled Natural Mineral Water Market Dynamics
Drinking Bottled Natural Mineral Water Market Trend: Growing Demand for Premium and Functional Beverages
The market for drinking bottled natural mineral water is experiencing a significant trend towards premium and functional beverages. Consumers are increasingly seeking high-quality, pure, and naturally sourced hydration options, driving the demand for mineral-rich bottled water. This trend is particularly pronounced among health-conscious individuals who value the natural minerals and electrolytes found in premium bottled water for their perceived health benefits. The rise of wellness-focused lifestyles, coupled with a willingness to pay more for superior quality and enhanced functionality, supports this shift towards premium and functional bottled water products.
Drinking Bottled Natural Mineral Water Market Driver: Rising Health and Wellness Awareness
A major driver for the bottled natural mineral water market is the rising health and wellness awareness among consumers. As people become more educated about the benefits of proper hydration and the importance of mineral intake, there is a growing preference for bottled natural mineral water over regular tap or purified water. The natural minerals in bottled mineral water, such as calcium, magnesium, and potassium, are believed to support overall health, including bone strength, cardiovascular function, and hydration balance. This increased focus on health and wellness, coupled with concerns over water quality and contamination, is driving consumers to choose bottled natural mineral water as a safer and healthier hydration option.
Drinking Bottled Natural Mineral Water Market Opportunity: Expansion Through Sustainable Packaging and New Flavors
The bottled natural mineral water market holds significant opportunities for growth through sustainable packaging innovations and the introduction of new flavors. With increasing environmental consciousness, consumers are seeking products that align with their values, including sustainability. Companies can capitalize on this by developing eco-friendly packaging solutions, such as biodegradable or recyclable bottles, to attract environmentally conscious consumers. Additionally, offering a variety of flavored mineral water options can cater to diverse taste preferences and enhance the appeal of the product. Collaborating with retailers to highlight the benefits of natural mineral water and promoting these sustainable and innovative products through digital marketing can further drive market expansion and consumer engagement.
Drinking Bottled Natural Mineral Water Market Share Analysis: Natural Mineral Water Containing Gas segment generated the highest revenue share in the industry
The largest segment in the Drinking Bottled Natural Mineral Water Market is "Natural Mineral Water Containing Gas." This type of mineral water is characterized by its effervescence or carbonation, which occurs naturally due to the presence of dissolved gases, primarily carbon dioxide. Consumers often prefer natural mineral water containing gas for its refreshing and fizzy quality, making it a popular choice for hydration and as a beverage option in various settings. Its unique taste and perceived health benefits associated with natural minerals and carbonation contribute to its prominence within the market.
Drinking Bottled Natural Mineral Water Market Share Analysis: Office is the fastest growing segment over the forecast period to 2032
The fastest-growing segment in the Drinking Bottled Natural Mineral Water Market is the "Office" application. This segment pertains to the consumption of bottled natural mineral water within office environments, including workplaces, corporate offices, and business establishments. The growing emphasis on health and wellness in the workplace, coupled with increased awareness of the importance of hydration for productivity and well-being, has led to a surge in the demand for bottled natural mineral water among office-goers. Additionally, initiatives promoting sustainable practices and eco-friendly packaging in offices further contribute to the growth of this segment, making it the fastest-growing application in the Drinking Bottled Natural Mineral Water Market.
Drinking Bottled Natural Mineral Water Market Segmentation
By Type
Natural Mineral Water Containing Gas
Inflatable Natural Mineral Water
Airless Natural Mineral Water
Degassed Natural Mineral Water
By Application
Family
Office
School
Government
Others
Countries Analyzed
North America (US, Canada, Mexico)
Europe (Germany, UK, France, Spain, Italy, Russia, Rest of Europe)
Asia Pacific (China, India, Japan, South Korea, Australia, South East Asia, Rest of Asia)
South America (Brazil, Argentina, Rest of South America)
Middle East and Africa (Saudi Arabia, UAE, Rest of Middle East, South Africa, Egypt, Rest of Africa)
Drinking Bottled Natural Mineral Water Companies Profiled in the Study
Danone S.A.
Evergrande
Ferrarelle
Gerolsteiner Brunnen
Jia Duo Bao
Nestlé S.A.
Perrier
San Benedetto
San Pellegrino
Uni-President
Wa Ha Ha
*- List Not Exhaustive
Chapter 1. TABLE OF CONTENTS
Chapter 2. Introduction to Drinking Bottled Natural Mineral Water Market
2.1. Market Overview
2.2. Key Statistics and Report Highlights
2.3. Scope of the Comprehensive Study
2.3.1. Market Definition
2.3.2 Countries and Regions Covered
2.3.3 Research Objective
2.3.4 Units, Currency, and Conversions
2.3.5 Industry Value Chain
2.4. Key Market Segments
2.5. Key Companies
2.6. Study Period
Chapter 3. Strategic Analysis Review
3.1. Drinking Bottled Natural Mineral Water Pricing Analysis and Forecast
3.2. Porter’s Five Forces
3.3. Market Ecosystem
3.4. SWOT Analysis
3.5. Regulatory Scenario
3.3. Effects of Inflation, Russia-Ukraine War, moderating economic growth, and other macroeconomic factors
Chapter 4. Competitive Landscape
4.1. Market Share Analysis
4.1.1. Global Drinking Bottled Natural Mineral Water Market Share by Company, 2023
4.1.2. Product Offerings of Leading Drinking Bottled Natural Mineral Water Companies
4.2. Market Entropy
4.2.1. New Product Launches in the Industry
4.2.2. Mergers, Acquisitions, Joint ventures, and Partnerships
4.3. Key Strategies and Best Practices
Chapter 5. Global Market Projections: Best, Reference, and Low Case Scenarios
5.1. Growth Analysis- Case Scenario Definitions
5.2. Low Growth Case Scenario Forecasts
5.3. Reference Growth Case Scenario Forecasts
5.4. High Growth Case Scenario Forecasts
Chapter 6. Market Dynamics
6.1. Drinking Bottled Natural Mineral Water Market Drivers
6.2. Drinking Bottled Natural Mineral Water Market Challenges
6.6. Drinking Bottled Natural Mineral Water Market Opportunities
6.4. Drinking Bottled Natural Mineral Water Market Trends
Chapter 7. Global Drinking Bottled Natural Mineral Water Market Outlook Trends
7.1. Global Drinking Bottled Natural Mineral Water Revenue (USD Million) and CAGR (%) by Type (2021-2032)
7.2. Global Drinking Bottled Natural Mineral Water Revenue (USD Million) and CAGR (%) by Application (2021-2032)
7.3. Global Drinking Bottled Natural Mineral Water Revenue (USD Million) and CAGR (%) by Product (2021-2032)
By Type
Natural Mineral Water Containing Gas
Inflatable Natural Mineral Water
Airless Natural Mineral Water
Degassed Natural Mineral Water
By Application
Family
Office
School
Government
Others
Chapter 8. Global Drinking Bottled Natural Mineral Water Regional Analysis and Outlook
8.1. Global Drinking Bottled Natural Mineral Water Revenue (USD Million) By Regions (2021- 2032)
8.2. North America Drinking Bottled Natural Mineral Water Revenue (USD Million) by Country (2021-2032)
8.2.1. United States Drinking Bottled Natural Mineral Water Regional Analysis and Outlook
8.2.2. Canada Drinking Bottled Natural Mineral Water Regional Analysis and Outlook
8.2.3. Mexico Drinking Bottled Natural Mineral Water Regional Analysis and Outlook
8.3. Europe Drinking Bottled Natural Mineral Water Revenue (USD Million), by Country (2021-2032)
8.3.1. Germany Drinking Bottled Natural Mineral Water Regional Analysis and Outlook
8.3.2. France Drinking Bottled Natural Mineral Water Regional Analysis and Outlook
8.3.3. United Kingdom Drinking Bottled Natural Mineral Water Regional Analysis and Outlook
8.3.4. Spain Drinking Bottled Natural Mineral Water Regional Analysis and Outlook
8.3.5. Italy Drinking Bottled Natural Mineral Water Regional Analysis and Outlook
8.3.6. Russia Drinking Bottled Natural Mineral Water Regional Analysis and Outlook
8.3.7. Rest of Europe Drinking Bottled Natural Mineral Water Regional Analysis and Outlook
8.4. Asia Pacific Drinking Bottled Natural Mineral Water Revenue (USD Million) by Country (2021-2032)
8.4.1. China Drinking Bottled Natural Mineral Water Regional Analysis and Outlook
8.4.2. Japan Drinking Bottled Natural Mineral Water Regional Analysis and Outlook
8.4.3. India Drinking Bottled Natural Mineral Water Regional Analysis and Outlook
8.4.4. South Korea Drinking Bottled Natural Mineral Water Regional Analysis and Outlook
8.4.5. Australia Drinking Bottled Natural Mineral Water Regional Analysis and Outlook
8.4.6. South East Asia Drinking Bottled Natural Mineral Water Regional Analysis and Outlook
8.4.7. Rest of Asia Pacific Drinking Bottled Natural Mineral Water Regional Analysis and Outlook
8.5. South America Drinking Bottled Natural Mineral Water Revenue (USD Million), by Country (2021-2032)
8.5.1. Brazil Drinking Bottled Natural Mineral Water Regional Analysis and Outlook
8.5.2. Argentina Drinking Bottled Natural Mineral Water Regional Analysis and Outlook
8.5.3. Rest of South America Drinking Bottled Natural Mineral Water Regional Analysis and Outlook
8.6. Middle East and Africa Drinking Bottled Natural Mineral Water Revenue (USD Million) by Country (2021-2032)
8.6.1. Middle East Drinking Bottled Natural Mineral Water Regional Analysis and Outlook
8.6.2. Africa Drinking Bottled Natural Mineral Water Regional Analysis and Outlook
Chapter 9. North America Drinking Bottled Natural Mineral Water Analysis and Outlook
9.1. North America Drinking Bottled Natural Mineral Water Revenue (USD Million) by Segments (2021-2032)
9.1.1. North America Drinking Bottled Natural Mineral Water Revenue (USD Million) by Type (2021-2032)
9.1.2. North America Drinking Bottled Natural Mineral Water Revenue (USD Million) by Application (2021-2032)
9.1.3. North America Drinking Bottled Natural Mineral Water Revenue (USD Million) by Product (2021-2032)
By Type
Natural Mineral Water Containing Gas
Inflatable Natural Mineral Water
Airless Natural Mineral Water
Degassed Natural Mineral Water
By Application
Family
Office
School
Government
Others
Chapter 10. Europe Drinking Bottled Natural Mineral Water Analysis and Outlook
10.1. Europe Drinking Bottled Natural Mineral Water Revenue (USD Million), by Segments (USD Million) (2021-2032)
10.1.1. Europe Drinking Bottled Natural Mineral Water Revenue (USD Million) by Type (2021-2032)
10.1.2. Europe Drinking Bottled Natural Mineral Water Revenue (USD Million) by Application (2021-2032)
10.1.3. Europe Drinking Bottled Natural Mineral Water Revenue (USD Million) by Product (2021-2032)
By Type
Natural Mineral Water Containing Gas
Inflatable Natural Mineral Water
Airless Natural Mineral Water
Degassed Natural Mineral Water
By Application
Family
Office
School
Government
Others
Chapter 11. Asia Pacific Drinking Bottled Natural Mineral Water Analysis and Outlook
11.1. Asia Pacific Drinking Bottled Natural Mineral Water Revenue (USD Million), and Revenue (USD Million) by Segments (2021-2032)
11.1.1. Asia Pacific Drinking Bottled Natural Mineral Water Revenue (USD Million) by Type (2021-2032)
11.1.2. Asia Pacific Drinking Bottled Natural Mineral Water Revenue (USD Million) by Application (2021-2032)
11.1.3. Asia Pacific Drinking Bottled Natural Mineral Water Revenue (USD Million) by Product (2021-2032)
By Type
Natural Mineral Water Containing Gas
Inflatable Natural Mineral Water
Airless Natural Mineral Water
Degassed Natural Mineral Water
By Application
Family
Office
School
Government
Others
Chapter 12. South America Drinking Bottled Natural Mineral Water Analysis and Outlook
12.1. South America Drinking Bottled Natural Mineral Water Revenue (USD Million), by Segments (2021-2032)
12.1.1. South America Drinking Bottled Natural Mineral Water Revenue (USD Million) by Type (2021-2032)
12.1.2. South America Drinking Bottled Natural Mineral Water Revenue (USD Million) by Application (2021-2032)
12.1.3. South America Drinking Bottled Natural Mineral Water Revenue (USD Million) by Product (2021-2032)
By Type
Natural Mineral Water Containing Gas
Inflatable Natural Mineral Water
Airless Natural Mineral Water
Degassed Natural Mineral Water
By Application
Family
Office
School
Government
Others
Chapter 13. Middle East and Africa Drinking Bottled Natural Mineral Water Analysis and Outlook
13.1. Middle East and Africa Drinking Bottled Natural Mineral Water Revenue (USD Million), by Segments (2021-2032)
13.1.1. Middle East and Africa Drinking Bottled Natural Mineral Water Revenue (USD Million) by Type (2021-2032)
13.1.2. Middle East and Africa Drinking Bottled Natural Mineral Water Revenue (USD Million) by Application (2021-2032)
13.1.3. Middle East and Africa Drinking Bottled Natural Mineral Water Revenue (USD Million) by Product (2021-2032)
By Type
Natural Mineral Water Containing Gas
Inflatable Natural Mineral Water
Airless Natural Mineral Water
Degassed Natural Mineral Water
By Application
Family
Office
School
Government
Others
Chapter 14. Drinking Bottled Natural Mineral Water Company Profiles
14.1 Business Overview
14.2 Product Profiles
14.3 SWOT Profiles
14.5 Recent Developments
14.6 Financial Profile
List of Companies
Danone S.A.
Evergrande
Ferrarelle
Gerolsteiner Brunnen
Jia Duo Bao
Nestlé S.A.
Perrier
San Benedetto
San Pellegrino
Uni-President
Wa Ha Ha
15. Methodology and Data Sources
15.1 Customization Offerings
15.2 Subscription Services
15.3 Related Reports
15.4 Publisher Expertise
LIST OF TABLES
Table 1 Market Segmentation Analysis
Table 2 Global Drinking Bottled Natural Mineral Water Market Share of Leading Companies, 2023
Table 3 Product Offerings of Leading Companies
Table 4 Low Growth Scenario Forecasts
Table 5 Reference Case Growth Scenario
Table 6 High Growth Case Scenario
Table 7 Global Drinking Bottled Natural Mineral Water Revenue (USD Million) And CAGR (%) By Type (2021-2032)
Table 8 Global Drinking Bottled Natural Mineral Water Revenue (USD Million) And CAGR (%) By Application (2021-2032)
Table 9 Global Drinking Bottled Natural Mineral Water Revenue (USD Million) And CAGR (%) By Product (2021-2032)
Table 10 Global Drinking Bottled Natural Mineral Water Market Revenue (USD Million) By Regions (2021-2032)
Table 11 Global Drinking Bottled Natural Mineral Water Market Share (%) By Regions (2021-2032)
Table 12 North America Drinking Bottled Natural Mineral Water Revenue (USD Million) By Country (2021-2032)
Table 13 Europe Drinking Bottled Natural Mineral Water Revenue (USD Million) By Country (2021-2032)
Table 14 Asia Pacific Drinking Bottled Natural Mineral Water Revenue (USD Million) By Country (2021-2032)
Table 15 South America Drinking Bottled Natural Mineral Water Revenue (USD Million) By Country (2021-2032)
Table 16 Middle East and Africa Drinking Bottled Natural Mineral Water Revenue (USD Million) By Region (2021-2032)
Table 17 North America Drinking Bottled Natural Mineral Water Revenue (USD Million) By Type (2021-2032)
Table 18 North America Drinking Bottled Natural Mineral Water Revenue (USD Million) By Application (2021-2032)
Table 19 North America Drinking Bottled Natural Mineral Water Revenue (USD Million) By Product (2021-2032)
Table 20 Europe Drinking Bottled Natural Mineral Water Revenue (USD Million) By Type (2021-2032)
Table 21 Europe Drinking Bottled Natural Mineral Water Revenue (USD Million) By Application (2021-2032)
Table 22 Europe Drinking Bottled Natural Mineral Water Revenue (USD Million) By Product (2021-2032)
Table 23 Asia Pacific Drinking Bottled Natural Mineral Water Revenue (USD Million) By Type (2021-2032)
Table 24 Asia Pacific Drinking Bottled Natural Mineral Water Revenue (USD Million) By Application (2021-2032)
Table 25 Asia Pacific Drinking Bottled Natural Mineral Water Revenue (USD Million) By Product (2021-2032)
Table 26 South America Drinking Bottled Natural Mineral Water Revenue (USD Million) By Type (2021-2032)
Table 27 South America Drinking Bottled Natural Mineral Water Revenue (USD Million) By Application (2021-2032)
Table 28 South America Drinking Bottled Natural Mineral Water Revenue (USD Million) By Product (2021-2032)
Table 29 Middle East and Africa Drinking Bottled Natural Mineral Water Revenue (USD Million) By Type (2021-2032)
Table 30 Middle East and Africa Drinking Bottled Natural Mineral Water Revenue (USD Million) By Application (2021-2032)
Table 31 Middle East and Africa Drinking Bottled Natural Mineral Water Revenue (USD Million) By Product (2021-2032)
LIST OF FIGURES
Figure 1. Market Scope
Figure 2. Pricing Forecasts Per Unit, 2023- 2032
Figure 3. Porter’s Five Forces
Figure 4. Global Drinking Bottled Natural Mineral Water Market Revenue (USD Million) By Regions (2021-2032)
Figure 5. Global Drinking Bottled Natural Mineral Water Market Share (%) By Regions (2023)
Figure 6. North America Drinking Bottled Natural Mineral Water Revenue (USD Million) By Country (2021-2032)
Figure 7. United States Drinking Bottled Natural Mineral Water Revenue (USD Million) By Country (2021-2032)
Figure 8. Canada Drinking Bottled Natural Mineral Water Revenue (USD Million) By Country (2021-2032)
Figure 9. Mexico Drinking Bottled Natural Mineral Water Revenue (USD Million) By Country (2021-2032)
Figure 10. Europe Drinking Bottled Natural Mineral Water Revenue (USD Million) By Country (2021-2032)
Figure 11. Germany Drinking Bottled Natural Mineral Water Revenue (USD Million) By Country (2021-2032)
Figure 12. France Drinking Bottled Natural Mineral Water Revenue (USD Million) By Country (2021-2032)
Figure 13. United Kingdom Drinking Bottled Natural Mineral Water Revenue (USD Million) By Country (2021-2032)
Figure 14. Spain Drinking Bottled Natural Mineral Water Revenue (USD Million) By Country (2021-2032)
Figure 15. Italy Drinking Bottled Natural Mineral Water Revenue (USD Million) By Country (2021-2032)
Figure 16. Russia Drinking Bottled Natural Mineral Water Revenue (USD Million) By Country (2021-2032)
Figure 17. Rest of Europe Drinking Bottled Natural Mineral Water Revenue (USD Million) By Country (2021-2032)
Figure 11. Asia Pacific Drinking Bottled Natural Mineral Water Revenue (USD Million) By Country (2021-2032)
Figure 12. China Drinking Bottled Natural Mineral Water Revenue (USD Million) By Country (2021-2032)
Figure 13. Japan Drinking Bottled Natural Mineral Water Revenue (USD Million) By Country (2021-2032)
Figure 14. India Drinking Bottled Natural Mineral Water Revenue (USD Million) By Country (2021-2032)
Figure 15. South Korea Drinking Bottled Natural Mineral Water Revenue (USD Million) By Country (2021-2032)
Figure 16. Australia Drinking Bottled Natural Mineral Water Revenue (USD Million) By Country (2021-2032)
Figure 17. South East Asia Drinking Bottled Natural Mineral Water Revenue (USD Million) By Country (2021-2032)
Figure 18. South America Drinking Bottled Natural Mineral Water Revenue (USD Million) By Country (2021-2032)
Figure 19. Brazil Drinking Bottled Natural Mineral Water Revenue (USD Million) By Country (2021-2032)
Figure 20. Argentina Drinking Bottled Natural Mineral Water Revenue (USD Million) By Country (2021-2032)
Figure 21. Rest of Asia Pacific Drinking Bottled Natural Mineral Water Revenue (USD Million) By Country (2021-2032)
Figure 22. Middle East and Africa Drinking Bottled Natural Mineral Water Revenue (USD Million) By Region (2021-2032)
Figure 23. Saudi Arabia Drinking Bottled Natural Mineral Water Revenue (USD Million) By Region (2021-2032)
Figure 24. The UAE Drinking Bottled Natural Mineral Water Revenue (USD Million) By Region (2021-2032)
Figure 25. Rest of Middle East Drinking Bottled Natural Mineral Water Revenue (USD Million) By Region (2021-2032)
Figure 26. South Africa Drinking Bottled Natural Mineral Water Revenue (USD Million) By Region (2021-2032)
Figure 27. Africa Drinking Bottled Natural Mineral Water Revenue (USD Million) By Region (2021-2032)
Figure 28. North America Drinking Bottled Natural Mineral Water Revenue (USD Million) By Type (2021-2032)
Figure 29. North America Drinking Bottled Natural Mineral Water Revenue (USD Million) By Application (2021-2032)
Figure 30. North America Drinking Bottled Natural Mineral Water Revenue (USD Million) By Product (2021-2032)
Figure 31. Europe Drinking Bottled Natural Mineral Water Revenue (USD Million) By Type (2021-2032)
Figure 32. Europe Drinking Bottled Natural Mineral Water Revenue (USD Million) By Application (2021-2032)
Figure 33. Europe Drinking Bottled Natural Mineral Water Revenue (USD Million) By Product (2021-2032)
Figure 34. Asia Pacific Drinking Bottled Natural Mineral Water Revenue (USD Million) By Type (2021-2032)
Figure 35. Asia Pacific Drinking Bottled Natural Mineral Water Revenue (USD Million) By Application (2021-2032)
Figure 36. Asia Pacific Drinking Bottled Natural Mineral Water Revenue (USD Million) By Product (2021-2032)
Figure 37. South America Drinking Bottled Natural Mineral Water Revenue (USD Million) By Type (2021-2032)
Figure 38. South America Drinking Bottled Natural Mineral Water Revenue (USD Million) By Application (2021-2032)
Figure 39. South America Drinking Bottled Natural Mineral Water Revenue (USD Million) By Product (2021-2032)
Figure 40. Middle East and Africa Drinking Bottled Natural Mineral Water Revenue (USD Million) By Type (2021-2032)
Figure 41. Middle East and Africa Drinking Bottled Natural Mineral Water Revenue (USD Million) By Application (2021-2032)
Figure 42. Middle East and Africa Drinking Bottled Natural Mineral Water Revenue (USD Million) By Product (2021-2032)
By Type
Natural Mineral Water Containing Gas
Inflatable Natural Mineral Water
Airless Natural Mineral Water
Degassed Natural Mineral Water
By Application
Family
Office
School
Government
Others
Countries Analyzed
North America (US, Canada, Mexico)
Europe (Germany, UK, France, Spain, Italy, Russia, Rest of Europe)
Asia Pacific (China, India, Japan, South Korea, Australia, South East Asia, Rest of Asia)
South America (Brazil, Argentina, Rest of South America)
Middle East and Africa (Saudi Arabia, UAE, Rest of Middle East, South Africa, Egypt, Rest of Africa)
