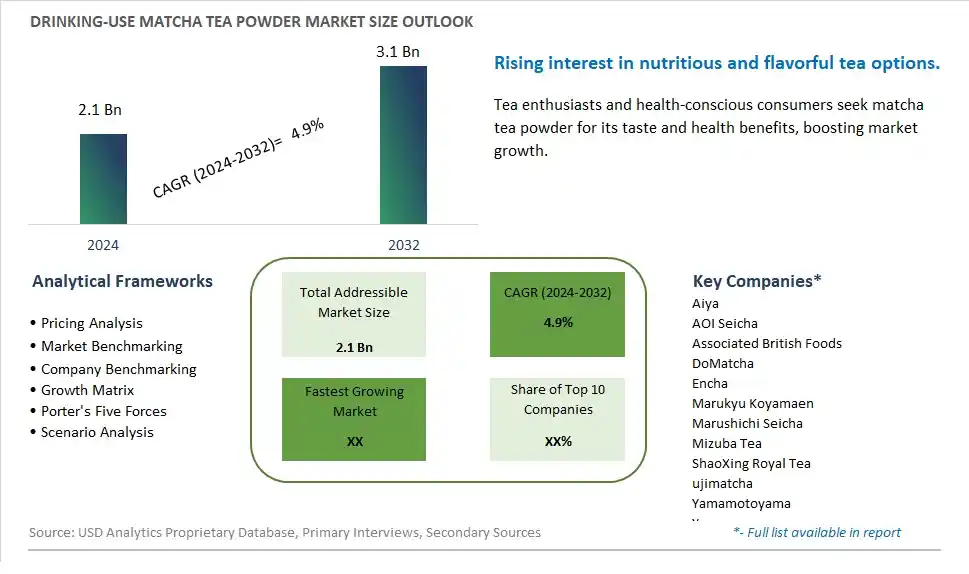
Global Drinking-use Matcha Tea Powder Market Size is valued at $2.1 Billion in 2024 and is forecast to register a growth rate (CAGR) of 4.9% to reach $3.1 Billion by 2032.
The global Drinking-use Matcha Tea Powder Market Comprehensive Study analyzes and forecasts the market size across 6 regions and 24 countries for diverse segments -By Type (Low Pricing, Medium Pricing, High Pricing), By Application (Drinking Tea, Pastry, Ice Cream, Beverage)
An Introduction to Drinking-use Matcha Tea Powder Market
In 2024, the Drinking Use Matcha Tea Powder market is experiencing significant growth, driven by the rising demand for healthy and functional beverages. Matcha tea powder, known for its high antioxidant content and numerous health benefits, is gaining popularity among consumers. The market benefits from the increasing awareness of the health benefits of matcha and the growing trend of wellness and mindfulness. Additionally, innovations in product formulations and the rising popularity of matcha-based beverages and snacks are contributing to market expansion.
Drinking use Matcha Tea Powder Competitive Landscape
The market report analyses the leading companies in the industry including Aiya, AOI Seicha, Associated British Foods, DoMatcha, Encha, Marukyu Koyamaen, Marushichi Seicha, Mizuba Tea, ShaoXing Royal Tea, ujimatcha, Yamamotoyama, Yanoen, and Others.
Drinking use Matcha Tea Powder Market Dynamics
Drinking use Matcha Tea Powder Market Trend: Rising Popularity of Functional Beverages
The market for drinking-use matcha tea powder is experiencing a significant trend towards functional beverages. Consumers are increasingly seeking beverages that offer health benefits beyond basic hydration, and matcha tea powder fits this demand perfectly. Known for its high antioxidant content, calming effects due to L-theanine, and natural energy boost from caffeine, matcha is becoming a popular choice among health-conscious individuals. This trend is also driven by the growing interest in traditional and exotic teas, with matcha's rich cultural heritage and unique preparation methods adding to its appeal. The increasing availability of matcha in cafes, health stores, and online platforms further supports its rising popularity.
Drinking use Matcha Tea Powder Market Driver: Growing Health and Wellness Awareness
A major driver for the drinking-use matcha tea powder market is the growing health and wellness awareness among consumers. As people become more informed about the benefits of natural and plant-based products, the demand for matcha tea powder, known for its numerous health benefits, is on the rise. Matcha is rich in antioxidants, vitamins, and minerals, and is touted for its ability to enhance metabolism, improve focus, and support detoxification. The increasing focus on holistic health and the shift towards preventive healthcare practices are encouraging consumers to incorporate matcha into their daily routines as a nutritious and functional beverage.
Drinking use Matcha Tea Powder Market Opportunity: Innovation in Product Formats and Flavors
The matcha tea powder market holds substantial opportunities for innovation in product formats and flavors. Companies can expand their product lines by introducing ready-to-drink matcha beverages, matcha-infused smoothies, and convenient single-serve sachets that cater to on-the-go consumers. Additionally, experimenting with new and unique flavors, such as matcha blended with fruit extracts, spices, or herbs, can attract a wider audience and create new consumption occasions. Leveraging social media and digital marketing to educate consumers about the versatility and health benefits of matcha can enhance brand visibility and engagement. Collaborations with wellness influencers and nutritionists can further promote matcha as a staple in health-conscious diets, driving market growth.
Drinking-use Matcha Tea Powder Market Share Analysis- Largest Segment by Type
The Medium Pricing segment is the largest in the Drinking-use Matcha Tea Powder Market by type. This dominance is driven by the balance between quality and affordability that medium-priced matcha offers. Consumers seeking a high-quality matcha experience without the premium price tag often opt for medium-priced matcha tea powder. This segment appeals to a broad range of consumers, from health enthusiasts to casual tea drinkers, looking for the nutritional benefits and unique flavor of matcha. The medium pricing category offers a good compromise, providing superior taste and health benefits compared to low-priced options while being more accessible than high-priced premium matcha. The extensive availability of medium-priced matcha in supermarkets, health food stores, and online platforms further supports its significant market share. The continuous innovation in matcha products, including flavored and fortified options, also enhances the appeal of the medium pricing segment.
Drinking-use Matcha Tea Powder Market Share Analysis- Fastest Growing Segment by Application
The Beverage segment is poised to grow the fastest in the Drinking-use Matcha Tea Powder Market by application over the next five years. This rapid growth is driven by the increasing popularity of matcha-infused beverages, such as lattes, smoothies, and health drinks, among health-conscious consumers. The versatility of matcha tea powder in enhancing the flavor and nutritional profile of various beverages makes it a popular choice among beverage manufacturers and consumers alike. Additionally, the growing trend of functional beverages that provide health benefits such as improved focus, energy, and detoxification supports the demand for matcha-infused drinks. The continuous innovation in beverage formulations, including ready-to-drink matcha products and matcha-based energy drinks, further drives the growth of this segment. The influence of social media and health influencers in promoting matcha as a superfood also boosts its popularity and adoption in the beverage industry.
Drinking use Matcha Tea Powder Market Segmentation
By Type
Low Pricing
Medium Pricing
High Pricing
By Application
Drinking Tea
Pastry
Ice Cream
Beverage
Countries Analyzed
North America (US, Canada, Mexico)
Europe (Germany, UK, France, Spain, Italy, Russia, Rest of Europe)
Asia Pacific (China, India, Japan, South Korea, Australia, South East Asia, Rest of Asia)
South America (Brazil, Argentina, Rest of South America)
Middle East and Africa (Saudi Arabia, UAE, Rest of Middle East, South Africa, Egypt, Rest of Africa)
Drinking use Matcha Tea Powder Companies Profiled in the Study
Aiya
AOI Seicha
Associated British Foods
DoMatcha
Encha
Marukyu Koyamaen
Marushichi Seicha
Mizuba Tea
ShaoXing Royal Tea
ujimatcha
Yamamotoyama
Yanoen
*- List Not Exhaustive
Chapter 1. TABLE OF CONTENTS
Chapter 2. Introduction to Drinking use Matcha Tea Powder Market
2.1. Market Overview
2.2. Key Statistics and Report Highlights
2.3. Scope of the Comprehensive Study
2.3.1. Market Definition
2.3.2 Countries and Regions Covered
2.3.3 Research Objective
2.3.4 Units, Currency, and Conversions
2.3.5 Industry Value Chain
2.4. Key Market Segments
2.5. Key Companies
2.6. Study Period
Chapter 3. Strategic Analysis Review
3.1. Drinking use Matcha Tea Powder Pricing Analysis and Forecast
3.2. Porter’s Five Forces
3.3. Market Ecosystem
3.4. SWOT Analysis
3.5. Regulatory Scenario
3.3. Effects of Inflation, Russia-Ukraine War, moderating economic growth, and other macroeconomic factors
Chapter 4. Competitive Landscape
4.1. Market Share Analysis
4.1.1. Global Drinking use Matcha Tea Powder Market Share by Company, 2023
4.1.2. Product Offerings of Leading Drinking use Matcha Tea Powder Companies
4.2. Market Entropy
4.2.1. New Product Launches in the Industry
4.2.2. Mergers, Acquisitions, Joint ventures, and Partnerships
4.3. Key Strategies and Best Practices
Chapter 5. Global Market Projections: Best, Reference, and Low Case Scenarios
5.1. Growth Analysis- Case Scenario Definitions
5.2. Low Growth Case Scenario Forecasts
5.3. Reference Growth Case Scenario Forecasts
5.4. High Growth Case Scenario Forecasts
Chapter 6. Market Dynamics
6.1. Drinking use Matcha Tea Powder Market Drivers
6.2. Drinking use Matcha Tea Powder Market Challenges
6.6. Drinking use Matcha Tea Powder Market Opportunities
6.4. Drinking use Matcha Tea Powder Market Trends
Chapter 7. Global Drinking use Matcha Tea Powder Market Outlook Trends
7.1. Global Drinking use Matcha Tea Powder Revenue (USD Million) and CAGR (%) by Type (2021-2032)
7.2. Global Drinking use Matcha Tea Powder Revenue (USD Million) and CAGR (%) by Application (2021-2032)
7.3. Global Drinking use Matcha Tea Powder Revenue (USD Million) and CAGR (%) by Product (2021-2032)
By Type
Low Pricing
Medium Pricing
High Pricing
By Application
Drinking Tea
Pastry
Ice Cream
Beverage
Chapter 8. Global Drinking use Matcha Tea Powder Regional Analysis and Outlook
8.1. Global Drinking use Matcha Tea Powder Revenue (USD Million) By Regions (2021- 2032)
8.2. North America Drinking use Matcha Tea Powder Revenue (USD Million) by Country (2021-2032)
8.2.1. United States Drinking use Matcha Tea Powder Regional Analysis and Outlook
8.2.2. Canada Drinking use Matcha Tea Powder Regional Analysis and Outlook
8.2.3. Mexico Drinking use Matcha Tea Powder Regional Analysis and Outlook
8.3. Europe Drinking use Matcha Tea Powder Revenue (USD Million), by Country (2021-2032)
8.3.1. Germany Drinking use Matcha Tea Powder Regional Analysis and Outlook
8.3.2. France Drinking use Matcha Tea Powder Regional Analysis and Outlook
8.3.3. United Kingdom Drinking use Matcha Tea Powder Regional Analysis and Outlook
8.3.4. Spain Drinking use Matcha Tea Powder Regional Analysis and Outlook
8.3.5. Italy Drinking use Matcha Tea Powder Regional Analysis and Outlook
8.3.6. Russia Drinking use Matcha Tea Powder Regional Analysis and Outlook
8.3.7. Rest of Europe Drinking use Matcha Tea Powder Regional Analysis and Outlook
8.4. Asia Pacific Drinking use Matcha Tea Powder Revenue (USD Million) by Country (2021-2032)
8.4.1. China Drinking use Matcha Tea Powder Regional Analysis and Outlook
8.4.2. Japan Drinking use Matcha Tea Powder Regional Analysis and Outlook
8.4.3. India Drinking use Matcha Tea Powder Regional Analysis and Outlook
8.4.4. South Korea Drinking use Matcha Tea Powder Regional Analysis and Outlook
8.4.5. Australia Drinking use Matcha Tea Powder Regional Analysis and Outlook
8.4.6. South East Asia Drinking use Matcha Tea Powder Regional Analysis and Outlook
8.4.7. Rest of Asia Pacific Drinking use Matcha Tea Powder Regional Analysis and Outlook
8.5. South America Drinking use Matcha Tea Powder Revenue (USD Million), by Country (2021-2032)
8.5.1. Brazil Drinking use Matcha Tea Powder Regional Analysis and Outlook
8.5.2. Argentina Drinking use Matcha Tea Powder Regional Analysis and Outlook
8.5.3. Rest of South America Drinking use Matcha Tea Powder Regional Analysis and Outlook
8.6. Middle East and Africa Drinking use Matcha Tea Powder Revenue (USD Million) by Country (2021-2032)
8.6.1. Middle East Drinking use Matcha Tea Powder Regional Analysis and Outlook
8.6.2. Africa Drinking use Matcha Tea Powder Regional Analysis and Outlook
Chapter 9. North America Drinking use Matcha Tea Powder Analysis and Outlook
9.1. North America Drinking use Matcha Tea Powder Revenue (USD Million) by Segments (2021-2032)
9.1.1. North America Drinking use Matcha Tea Powder Revenue (USD Million) by Type (2021-2032)
9.1.2. North America Drinking use Matcha Tea Powder Revenue (USD Million) by Application (2021-2032)
9.1.3. North America Drinking use Matcha Tea Powder Revenue (USD Million) by Product (2021-2032)
By Type
Low Pricing
Medium Pricing
High Pricing
By Application
Drinking Tea
Pastry
Ice Cream
Beverage
Chapter 10. Europe Drinking use Matcha Tea Powder Analysis and Outlook
10.1. Europe Drinking use Matcha Tea Powder Revenue (USD Million), by Segments (USD Million) (2021-2032)
10.1.1. Europe Drinking use Matcha Tea Powder Revenue (USD Million) by Type (2021-2032)
10.1.2. Europe Drinking use Matcha Tea Powder Revenue (USD Million) by Application (2021-2032)
10.1.3. Europe Drinking use Matcha Tea Powder Revenue (USD Million) by Product (2021-2032)
By Type
Low Pricing
Medium Pricing
High Pricing
By Application
Drinking Tea
Pastry
Ice Cream
Beverage
Chapter 11. Asia Pacific Drinking use Matcha Tea Powder Analysis and Outlook
11.1. Asia Pacific Drinking use Matcha Tea Powder Revenue (USD Million), and Revenue (USD Million) by Segments (2021-2032)
11.1.1. Asia Pacific Drinking use Matcha Tea Powder Revenue (USD Million) by Type (2021-2032)
11.1.2. Asia Pacific Drinking use Matcha Tea Powder Revenue (USD Million) by Application (2021-2032)
11.1.3. Asia Pacific Drinking use Matcha Tea Powder Revenue (USD Million) by Product (2021-2032)
By Type
Low Pricing
Medium Pricing
High Pricing
By Application
Drinking Tea
Pastry
Ice Cream
Beverage
Chapter 12. South America Drinking use Matcha Tea Powder Analysis and Outlook
12.1. South America Drinking use Matcha Tea Powder Revenue (USD Million), by Segments (2021-2032)
12.1.1. South America Drinking use Matcha Tea Powder Revenue (USD Million) by Type (2021-2032)
12.1.2. South America Drinking use Matcha Tea Powder Revenue (USD Million) by Application (2021-2032)
12.1.3. South America Drinking use Matcha Tea Powder Revenue (USD Million) by Product (2021-2032)
By Type
Low Pricing
Medium Pricing
High Pricing
By Application
Drinking Tea
Pastry
Ice Cream
Beverage
Chapter 13. Middle East and Africa Drinking use Matcha Tea Powder Analysis and Outlook
13.1. Middle East and Africa Drinking use Matcha Tea Powder Revenue (USD Million), by Segments (2021-2032)
13.1.1. Middle East and Africa Drinking use Matcha Tea Powder Revenue (USD Million) by Type (2021-2032)
13.1.2. Middle East and Africa Drinking use Matcha Tea Powder Revenue (USD Million) by Application (2021-2032)
13.1.3. Middle East and Africa Drinking use Matcha Tea Powder Revenue (USD Million) by Product (2021-2032)
By Type
Low Pricing
Medium Pricing
High Pricing
By Application
Drinking Tea
Pastry
Ice Cream
Beverage
Chapter 14. Drinking use Matcha Tea Powder Company Profiles
14.1 Business Overview
14.2 Product Profiles
14.3 SWOT Profiles
14.5 Recent Developments
14.6 Financial Profile
List of Companies
Aiya
AOI Seicha
Associated British Foods
DoMatcha
Encha
Marukyu Koyamaen
Marushichi Seicha
Mizuba Tea
ShaoXing Royal Tea
ujimatcha
Yamamotoyama
Yanoen
15. Methodology and Data Sources
15.1 Customization Offerings
15.2 Subscription Services
15.3 Related Reports
15.4 Publisher Expertise
LIST OF TABLES
Table 1 Market Segmentation Analysis
Table 2 Global Drinking use Matcha Tea Powder Market Share of Leading Companies, 2023
Table 3 Product Offerings of Leading Companies
Table 4 Low Growth Scenario Forecasts
Table 5 Reference Case Growth Scenario
Table 6 High Growth Case Scenario
Table 7 Global Drinking use Matcha Tea Powder Revenue (USD Million) And CAGR (%) By Type (2021-2032)
Table 8 Global Drinking use Matcha Tea Powder Revenue (USD Million) And CAGR (%) By Application (2021-2032)
Table 9 Global Drinking use Matcha Tea Powder Revenue (USD Million) And CAGR (%) By Product (2021-2032)
Table 10 Global Drinking use Matcha Tea Powder Market Revenue (USD Million) By Regions (2021-2032)
Table 11 Global Drinking use Matcha Tea Powder Market Share (%) By Regions (2021-2032)
Table 12 North America Drinking use Matcha Tea Powder Revenue (USD Million) By Country (2021-2032)
Table 13 Europe Drinking use Matcha Tea Powder Revenue (USD Million) By Country (2021-2032)
Table 14 Asia Pacific Drinking use Matcha Tea Powder Revenue (USD Million) By Country (2021-2032)
Table 15 South America Drinking use Matcha Tea Powder Revenue (USD Million) By Country (2021-2032)
Table 16 Middle East and Africa Drinking use Matcha Tea Powder Revenue (USD Million) By Region (2021-2032)
Table 17 North America Drinking use Matcha Tea Powder Revenue (USD Million) By Type (2021-2032)
Table 18 North America Drinking use Matcha Tea Powder Revenue (USD Million) By Application (2021-2032)
Table 19 North America Drinking use Matcha Tea Powder Revenue (USD Million) By Product (2021-2032)
Table 20 Europe Drinking use Matcha Tea Powder Revenue (USD Million) By Type (2021-2032)
Table 21 Europe Drinking use Matcha Tea Powder Revenue (USD Million) By Application (2021-2032)
Table 22 Europe Drinking use Matcha Tea Powder Revenue (USD Million) By Product (2021-2032)
Table 23 Asia Pacific Drinking use Matcha Tea Powder Revenue (USD Million) By Type (2021-2032)
Table 24 Asia Pacific Drinking use Matcha Tea Powder Revenue (USD Million) By Application (2021-2032)
Table 25 Asia Pacific Drinking use Matcha Tea Powder Revenue (USD Million) By Product (2021-2032)
Table 26 South America Drinking use Matcha Tea Powder Revenue (USD Million) By Type (2021-2032)
Table 27 South America Drinking use Matcha Tea Powder Revenue (USD Million) By Application (2021-2032)
Table 28 South America Drinking use Matcha Tea Powder Revenue (USD Million) By Product (2021-2032)
Table 29 Middle East and Africa Drinking use Matcha Tea Powder Revenue (USD Million) By Type (2021-2032)
Table 30 Middle East and Africa Drinking use Matcha Tea Powder Revenue (USD Million) By Application (2021-2032)
Table 31 Middle East and Africa Drinking use Matcha Tea Powder Revenue (USD Million) By Product (2021-2032)
LIST OF FIGURES
Figure 1. Market Scope
Figure 2. Pricing Forecasts Per Unit, 2023- 2032
Figure 3. Porter’s Five Forces
Figure 4. Global Drinking use Matcha Tea Powder Market Revenue (USD Million) By Regions (2021-2032)
Figure 5. Global Drinking use Matcha Tea Powder Market Share (%) By Regions (2023)
Figure 6. North America Drinking use Matcha Tea Powder Revenue (USD Million) By Country (2021-2032)
Figure 7. United States Drinking use Matcha Tea Powder Revenue (USD Million) By Country (2021-2032)
Figure 8. Canada Drinking use Matcha Tea Powder Revenue (USD Million) By Country (2021-2032)
Figure 9. Mexico Drinking use Matcha Tea Powder Revenue (USD Million) By Country (2021-2032)
Figure 10. Europe Drinking use Matcha Tea Powder Revenue (USD Million) By Country (2021-2032)
Figure 11. Germany Drinking use Matcha Tea Powder Revenue (USD Million) By Country (2021-2032)
Figure 12. France Drinking use Matcha Tea Powder Revenue (USD Million) By Country (2021-2032)
Figure 13. United Kingdom Drinking use Matcha Tea Powder Revenue (USD Million) By Country (2021-2032)
Figure 14. Spain Drinking use Matcha Tea Powder Revenue (USD Million) By Country (2021-2032)
Figure 15. Italy Drinking use Matcha Tea Powder Revenue (USD Million) By Country (2021-2032)
Figure 16. Russia Drinking use Matcha Tea Powder Revenue (USD Million) By Country (2021-2032)
Figure 17. Rest of Europe Drinking use Matcha Tea Powder Revenue (USD Million) By Country (2021-2032)
Figure 11. Asia Pacific Drinking use Matcha Tea Powder Revenue (USD Million) By Country (2021-2032)
Figure 12. China Drinking use Matcha Tea Powder Revenue (USD Million) By Country (2021-2032)
Figure 13. Japan Drinking use Matcha Tea Powder Revenue (USD Million) By Country (2021-2032)
Figure 14. India Drinking use Matcha Tea Powder Revenue (USD Million) By Country (2021-2032)
Figure 15. South Korea Drinking use Matcha Tea Powder Revenue (USD Million) By Country (2021-2032)
Figure 16. Australia Drinking use Matcha Tea Powder Revenue (USD Million) By Country (2021-2032)
Figure 17. South East Asia Drinking use Matcha Tea Powder Revenue (USD Million) By Country (2021-2032)
Figure 18. South America Drinking use Matcha Tea Powder Revenue (USD Million) By Country (2021-2032)
Figure 19. Brazil Drinking use Matcha Tea Powder Revenue (USD Million) By Country (2021-2032)
Figure 20. Argentina Drinking use Matcha Tea Powder Revenue (USD Million) By Country (2021-2032)
Figure 21. Rest of Asia Pacific Drinking use Matcha Tea Powder Revenue (USD Million) By Country (2021-2032)
Figure 22. Middle East and Africa Drinking use Matcha Tea Powder Revenue (USD Million) By Region (2021-2032)
Figure 23. Saudi Arabia Drinking use Matcha Tea Powder Revenue (USD Million) By Region (2021-2032)
Figure 24. The UAE Drinking use Matcha Tea Powder Revenue (USD Million) By Region (2021-2032)
Figure 25. Rest of Middle East Drinking use Matcha Tea Powder Revenue (USD Million) By Region (2021-2032)
Figure 26. South Africa Drinking use Matcha Tea Powder Revenue (USD Million) By Region (2021-2032)
Figure 27. Africa Drinking use Matcha Tea Powder Revenue (USD Million) By Region (2021-2032)
Figure 28. North America Drinking use Matcha Tea Powder Revenue (USD Million) By Type (2021-2032)
Figure 29. North America Drinking use Matcha Tea Powder Revenue (USD Million) By Application (2021-2032)
Figure 30. North America Drinking use Matcha Tea Powder Revenue (USD Million) By Product (2021-2032)
Figure 31. Europe Drinking use Matcha Tea Powder Revenue (USD Million) By Type (2021-2032)
Figure 32. Europe Drinking use Matcha Tea Powder Revenue (USD Million) By Application (2021-2032)
Figure 33. Europe Drinking use Matcha Tea Powder Revenue (USD Million) By Product (2021-2032)
Figure 34. Asia Pacific Drinking use Matcha Tea Powder Revenue (USD Million) By Type (2021-2032)
Figure 35. Asia Pacific Drinking use Matcha Tea Powder Revenue (USD Million) By Application (2021-2032)
Figure 36. Asia Pacific Drinking use Matcha Tea Powder Revenue (USD Million) By Product (2021-2032)
Figure 37. South America Drinking use Matcha Tea Powder Revenue (USD Million) By Type (2021-2032)
Figure 38. South America Drinking use Matcha Tea Powder Revenue (USD Million) By Application (2021-2032)
Figure 39. South America Drinking use Matcha Tea Powder Revenue (USD Million) By Product (2021-2032)
Figure 40. Middle East and Africa Drinking use Matcha Tea Powder Revenue (USD Million) By Type (2021-2032)
Figure 41. Middle East and Africa Drinking use Matcha Tea Powder Revenue (USD Million) By Application (2021-2032)
Figure 42. Middle East and Africa Drinking use Matcha Tea Powder Revenue (USD Million) By Product (2021-2032)
By Type
Low Pricing
Medium Pricing
High Pricing
By Application
Drinking Tea
Pastry
Ice Cream
Beverage
Countries Analyzed
North America (US, Canada, Mexico)
Europe (Germany, UK, France, Spain, Italy, Russia, Rest of Europe)
Asia Pacific (China, India, Japan, South Korea, Australia, South East Asia, Rest of Asia)
South America (Brazil, Argentina, Rest of South America)
Middle East and Africa (Saudi Arabia, UAE, Rest of Middle East, South Africa, Egypt, Rest of Africa)
