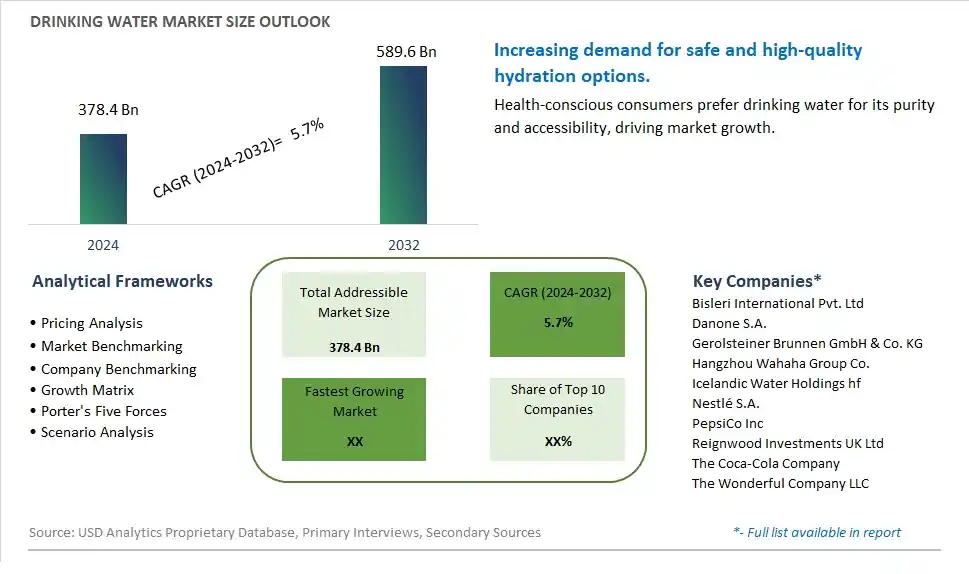
Global Drinking Water Market Size is valued at $378.4 Billion in 2024 and is forecast to register a growth rate (CAGR) of 5.7% to reach $589.6 Billion by 2032.
The global Drinking Water Market Comprehensive Study analyzes and forecasts the market size across 6 regions and 24 countries for diverse segments -By Type (Mineral Water, Sparkling Water, Distilled Water, Spring Water, Others), By Distribution Channel (Supermarkets/Hypermarkets, Convenience Stores, Online Retailers, Others)
An Introduction to Drinking Water Market
The Drinking Water market in 2024 is witnessing robust growth, driven by the increasing demand for safe, clean, and convenient hydration options. The market includes various forms of drinking water, such as bottled, filtered, and flavored water, catering to diverse consumer preferences. The market benefits from the rising awareness of the importance of hydration and the growing trend of health and wellness. Additionally, advancements in water purification and packaging technologies, along with the increasing focus on sustainability and eco-friendly packaging, are contributing to market growth.
Drinking Water Competitive Landscape
The market report analyses the leading companies in the industry including Bisleri International Pvt. Ltd, Danone S.A., Gerolsteiner Brunnen GmbH & Co. KG, Hangzhou Wahaha Group Co., Icelandic Water Holdings hf, Nestlé S.A., PepsiCo Inc, Reignwood Investments UK Ltd, The Coca-Cola Company, The Wonderful Company LLC, and Others.
Drinking Water Market Dynamics
Drinking Water Market Trend: Increasing Demand for Enhanced and Functional Water
The drinking water market is experiencing a significant trend towards enhanced and functional water products. Consumers are no longer just looking for hydration but also seeking additional health benefits from their water. This includes water infused with electrolytes, vitamins, minerals, and even flavors that enhance taste and provide extra nutritional value. The trend is driven by a growing health and wellness movement, where consumers prioritize beverages that contribute to their overall well-being. This shift towards functional water is particularly strong among active individuals, athletes, and health-conscious consumers looking for products that support their lifestyle and fitness goals.
Drinking Water Market Driver: Rising Health and Safety Concerns
A major driver for the drinking water market is the rising health and safety concerns among consumers. With increasing awareness about the potential contaminants and impurities present in tap water, more people are turning to bottled and filtered water options to ensure their drinking water is safe and clean. Concerns about waterborne diseases, pollution, and the overall quality of municipal water supplies have significantly driven the demand for purified and bottled drinking water. Marketing campaigns that highlight the purity, safety, and health benefits of drinking water from reputable sources have also played a crucial role in boosting consumer trust and demand.
Drinking Water Market Opportunity: Growth in Sustainable and Eco-Friendly Packaging
The drinking water market holds substantial opportunities for growth through sustainable and eco-friendly packaging solutions. As environmental awareness increases, consumers are seeking products that minimize ecological impact. Companies can capitalize on this by developing and promoting biodegradable, recyclable, and reusable packaging options for drinking water. Innovations such as plant-based bottles, aluminum cans, and glass containers can attract environmentally conscious consumers. Additionally, implementing circular economy practices, such as bottle return schemes and recycling initiatives, can enhance brand reputation and consumer loyalty. Expanding distribution through online platforms and leveraging digital marketing to emphasize sustainability credentials can further drive market growth and reach a broader audience.
Drinking Water Market Share Analysis: Mineral Water segment generated the highest revenue share in the industry
The largest segment in the Drinking Water Market is "Mineral Water." Mineral water stands out as a top choice among consumers due to its perceived health benefits and natural mineral content. With rising health consciousness and an increasing preference for clean and pure drinking options, mineral water has captured a significant share of the market. Its popularity stems from the presence of essential minerals like calcium, magnesium, and potassium, which are beneficial for overall health. Consumers often choose mineral water for hydration purposes and as an alternative to sugary or artificially flavored beverages, contributing substantially to the dominance of this segment in the market.
Drinking Water Market Share Analysis: Online Retailers is the fastest growing segment over the forecast period to 2032
The fastest-growing segment in the Drinking Water Market is "Online Retailers" as the distribution channel. With the rapid digitalization of commerce and the convenience offered by online shopping platforms, the online retail channel has witnessed remarkable growth in the distribution of drinking water. Consumers increasingly prefer the ease of ordering drinking water online, benefiting from doorstep delivery and a wide range of options to choose from. The Past few yearsfurther accelerated this trend, with more consumers embracing online shopping for essential goods, including drinking water. The convenience, accessibility, and competitive pricing offered by online retailers contribute significantly to the fast-paced growth of this segment within the market.
Drinking Water Market Segmentation
By Type
Mineral Water
Sparkling Water
Distilled Water
Spring Water
Others
By Distribution Channel
Supermarkets/Hypermarkets
Convenience Stores
Online Retailers
Others
Countries Analyzed
North America (US, Canada, Mexico)
Europe (Germany, UK, France, Spain, Italy, Russia, Rest of Europe)
Asia Pacific (China, India, Japan, South Korea, Australia, South East Asia, Rest of Asia)
South America (Brazil, Argentina, Rest of South America)
Middle East and Africa (Saudi Arabia, UAE, Rest of Middle East, South Africa, Egypt, Rest of Africa)
Drinking Water Companies Profiled in the Study
Bisleri International Pvt. Ltd
Danone S.A.
Gerolsteiner Brunnen GmbH & Co. KG
Hangzhou Wahaha Group Co.
Icelandic Water Holdings hf
Nestlé S.A.
PepsiCo Inc
Reignwood Investments UK Ltd
The Coca-Cola Company
The Wonderful Company LLC
*- List Not Exhaustive
Chapter 1. TABLE OF CONTENTS
Chapter 2. Introduction to Drinking Water Market
2.1. Market Overview
2.2. Key Statistics and Report Highlights
2.3. Scope of the Comprehensive Study
2.3.1. Market Definition
2.3.2 Countries and Regions Covered
2.3.3 Research Objective
2.3.4 Units, Currency, and Conversions
2.3.5 Industry Value Chain
2.4. Key Market Segments
2.5. Key Companies
2.6. Study Period
Chapter 3. Strategic Analysis Review
3.1. Drinking Water Pricing Analysis and Forecast
3.2. Porter’s Five Forces
3.3. Market Ecosystem
3.4. SWOT Analysis
3.5. Regulatory Scenario
3.3. Effects of Inflation, Russia-Ukraine War, moderating economic growth, and other macroeconomic factors
Chapter 4. Competitive Landscape
4.1. Market Share Analysis
4.1.1. Global Drinking Water Market Share by Company, 2023
4.1.2. Product Offerings of Leading Drinking Water Companies
4.2. Market Entropy
4.2.1. New Product Launches in the Industry
4.2.2. Mergers, Acquisitions, Joint ventures, and Partnerships
4.3. Key Strategies and Best Practices
Chapter 5. Global Market Projections: Best, Reference, and Low Case Scenarios
5.1. Growth Analysis- Case Scenario Definitions
5.2. Low Growth Case Scenario Forecasts
5.3. Reference Growth Case Scenario Forecasts
5.4. High Growth Case Scenario Forecasts
Chapter 6. Market Dynamics
6.1. Drinking Water Market Drivers
6.2. Drinking Water Market Challenges
6.6. Drinking Water Market Opportunities
6.4. Drinking Water Market Trends
Chapter 7. Global Drinking Water Market Outlook Trends
7.1. Global Drinking Water Revenue (USD Million) and CAGR (%) by Type (2021-2032)
7.2. Global Drinking Water Revenue (USD Million) and CAGR (%) by Application (2021-2032)
7.3. Global Drinking Water Revenue (USD Million) and CAGR (%) by Product (2021-2032)
By Type
Mineral Water
Sparkling Water
Distilled Water
Spring Water
Others
By Distribution Channel
Supermarkets/Hypermarkets
Convenience Stores
Online Retailers
Others
Chapter 8. Global Drinking Water Regional Analysis and Outlook
8.1. Global Drinking Water Revenue (USD Million) By Regions (2021- 2032)
8.2. North America Drinking Water Revenue (USD Million) by Country (2021-2032)
8.2.1. United States Drinking Water Regional Analysis and Outlook
8.2.2. Canada Drinking Water Regional Analysis and Outlook
8.2.3. Mexico Drinking Water Regional Analysis and Outlook
8.3. Europe Drinking Water Revenue (USD Million), by Country (2021-2032)
8.3.1. Germany Drinking Water Regional Analysis and Outlook
8.3.2. France Drinking Water Regional Analysis and Outlook
8.3.3. United Kingdom Drinking Water Regional Analysis and Outlook
8.3.4. Spain Drinking Water Regional Analysis and Outlook
8.3.5. Italy Drinking Water Regional Analysis and Outlook
8.3.6. Russia Drinking Water Regional Analysis and Outlook
8.3.7. Rest of Europe Drinking Water Regional Analysis and Outlook
8.4. Asia Pacific Drinking Water Revenue (USD Million) by Country (2021-2032)
8.4.1. China Drinking Water Regional Analysis and Outlook
8.4.2. Japan Drinking Water Regional Analysis and Outlook
8.4.3. India Drinking Water Regional Analysis and Outlook
8.4.4. South Korea Drinking Water Regional Analysis and Outlook
8.4.5. Australia Drinking Water Regional Analysis and Outlook
8.4.6. South East Asia Drinking Water Regional Analysis and Outlook
8.4.7. Rest of Asia Pacific Drinking Water Regional Analysis and Outlook
8.5. South America Drinking Water Revenue (USD Million), by Country (2021-2032)
8.5.1. Brazil Drinking Water Regional Analysis and Outlook
8.5.2. Argentina Drinking Water Regional Analysis and Outlook
8.5.3. Rest of South America Drinking Water Regional Analysis and Outlook
8.6. Middle East and Africa Drinking Water Revenue (USD Million) by Country (2021-2032)
8.6.1. Middle East Drinking Water Regional Analysis and Outlook
8.6.2. Africa Drinking Water Regional Analysis and Outlook
Chapter 9. North America Drinking Water Analysis and Outlook
9.1. North America Drinking Water Revenue (USD Million) by Segments (2021-2032)
9.1.1. North America Drinking Water Revenue (USD Million) by Type (2021-2032)
9.1.2. North America Drinking Water Revenue (USD Million) by Application (2021-2032)
9.1.3. North America Drinking Water Revenue (USD Million) by Product (2021-2032)
By Type
Mineral Water
Sparkling Water
Distilled Water
Spring Water
Others
By Distribution Channel
Supermarkets/Hypermarkets
Convenience Stores
Online Retailers
Others
Chapter 10. Europe Drinking Water Analysis and Outlook
10.1. Europe Drinking Water Revenue (USD Million), by Segments (USD Million) (2021-2032)
10.1.1. Europe Drinking Water Revenue (USD Million) by Type (2021-2032)
10.1.2. Europe Drinking Water Revenue (USD Million) by Application (2021-2032)
10.1.3. Europe Drinking Water Revenue (USD Million) by Product (2021-2032)
By Type
Mineral Water
Sparkling Water
Distilled Water
Spring Water
Others
By Distribution Channel
Supermarkets/Hypermarkets
Convenience Stores
Online Retailers
Others
Chapter 11. Asia Pacific Drinking Water Analysis and Outlook
11.1. Asia Pacific Drinking Water Revenue (USD Million), and Revenue (USD Million) by Segments (2021-2032)
11.1.1. Asia Pacific Drinking Water Revenue (USD Million) by Type (2021-2032)
11.1.2. Asia Pacific Drinking Water Revenue (USD Million) by Application (2021-2032)
11.1.3. Asia Pacific Drinking Water Revenue (USD Million) by Product (2021-2032)
By Type
Mineral Water
Sparkling Water
Distilled Water
Spring Water
Others
By Distribution Channel
Supermarkets/Hypermarkets
Convenience Stores
Online Retailers
Others
Chapter 12. South America Drinking Water Analysis and Outlook
12.1. South America Drinking Water Revenue (USD Million), by Segments (2021-2032)
12.1.1. South America Drinking Water Revenue (USD Million) by Type (2021-2032)
12.1.2. South America Drinking Water Revenue (USD Million) by Application (2021-2032)
12.1.3. South America Drinking Water Revenue (USD Million) by Product (2021-2032)
By Type
Mineral Water
Sparkling Water
Distilled Water
Spring Water
Others
By Distribution Channel
Supermarkets/Hypermarkets
Convenience Stores
Online Retailers
Others
Chapter 13. Middle East and Africa Drinking Water Analysis and Outlook
13.1. Middle East and Africa Drinking Water Revenue (USD Million), by Segments (2021-2032)
13.1.1. Middle East and Africa Drinking Water Revenue (USD Million) by Type (2021-2032)
13.1.2. Middle East and Africa Drinking Water Revenue (USD Million) by Application (2021-2032)
13.1.3. Middle East and Africa Drinking Water Revenue (USD Million) by Product (2021-2032)
By Type
Mineral Water
Sparkling Water
Distilled Water
Spring Water
Others
By Distribution Channel
Supermarkets/Hypermarkets
Convenience Stores
Online Retailers
Others
Chapter 14. Drinking Water Company Profiles
14.1 Business Overview
14.2 Product Profiles
14.3 SWOT Profiles
14.5 Recent Developments
14.6 Financial Profile
List of Companies
Bisleri International Pvt. Ltd
Danone S.A.
Gerolsteiner Brunnen GmbH & Co. KG
Hangzhou Wahaha Group Co.
Icelandic Water Holdings hf
Nestlé S.A.
PepsiCo Inc
Reignwood Investments UK Ltd
The Coca-Cola Company
The Wonderful Company LLC
15. Methodology and Data Sources
15.1 Customization Offerings
15.2 Subscription Services
15.3 Related Reports
15.4 Publisher Expertise
LIST OF TABLES
Table 1 Market Segmentation Analysis
Table 2 Global Drinking Water Market Share of Leading Companies, 2023
Table 3 Product Offerings of Leading Companies
Table 4 Low Growth Scenario Forecasts
Table 5 Reference Case Growth Scenario
Table 6 High Growth Case Scenario
Table 7 Global Drinking Water Revenue (USD Million) And CAGR (%) By Type (2021-2032)
Table 8 Global Drinking Water Revenue (USD Million) And CAGR (%) By Application (2021-2032)
Table 9 Global Drinking Water Revenue (USD Million) And CAGR (%) By Product (2021-2032)
Table 10 Global Drinking Water Market Revenue (USD Million) By Regions (2021-2032)
Table 11 Global Drinking Water Market Share (%) By Regions (2021-2032)
Table 12 North America Drinking Water Revenue (USD Million) By Country (2021-2032)
Table 13 Europe Drinking Water Revenue (USD Million) By Country (2021-2032)
Table 14 Asia Pacific Drinking Water Revenue (USD Million) By Country (2021-2032)
Table 15 South America Drinking Water Revenue (USD Million) By Country (2021-2032)
Table 16 Middle East and Africa Drinking Water Revenue (USD Million) By Region (2021-2032)
Table 17 North America Drinking Water Revenue (USD Million) By Type (2021-2032)
Table 18 North America Drinking Water Revenue (USD Million) By Application (2021-2032)
Table 19 North America Drinking Water Revenue (USD Million) By Product (2021-2032)
Table 20 Europe Drinking Water Revenue (USD Million) By Type (2021-2032)
Table 21 Europe Drinking Water Revenue (USD Million) By Application (2021-2032)
Table 22 Europe Drinking Water Revenue (USD Million) By Product (2021-2032)
Table 23 Asia Pacific Drinking Water Revenue (USD Million) By Type (2021-2032)
Table 24 Asia Pacific Drinking Water Revenue (USD Million) By Application (2021-2032)
Table 25 Asia Pacific Drinking Water Revenue (USD Million) By Product (2021-2032)
Table 26 South America Drinking Water Revenue (USD Million) By Type (2021-2032)
Table 27 South America Drinking Water Revenue (USD Million) By Application (2021-2032)
Table 28 South America Drinking Water Revenue (USD Million) By Product (2021-2032)
Table 29 Middle East and Africa Drinking Water Revenue (USD Million) By Type (2021-2032)
Table 30 Middle East and Africa Drinking Water Revenue (USD Million) By Application (2021-2032)
Table 31 Middle East and Africa Drinking Water Revenue (USD Million) By Product (2021-2032)
LIST OF FIGURES
Figure 1. Market Scope
Figure 2. Pricing Forecasts Per Unit, 2023- 2032
Figure 3. Porter’s Five Forces
Figure 4. Global Drinking Water Market Revenue (USD Million) By Regions (2021-2032)
Figure 5. Global Drinking Water Market Share (%) By Regions (2023)
Figure 6. North America Drinking Water Revenue (USD Million) By Country (2021-2032)
Figure 7. United States Drinking Water Revenue (USD Million) By Country (2021-2032)
Figure 8. Canada Drinking Water Revenue (USD Million) By Country (2021-2032)
Figure 9. Mexico Drinking Water Revenue (USD Million) By Country (2021-2032)
Figure 10. Europe Drinking Water Revenue (USD Million) By Country (2021-2032)
Figure 11. Germany Drinking Water Revenue (USD Million) By Country (2021-2032)
Figure 12. France Drinking Water Revenue (USD Million) By Country (2021-2032)
Figure 13. United Kingdom Drinking Water Revenue (USD Million) By Country (2021-2032)
Figure 14. Spain Drinking Water Revenue (USD Million) By Country (2021-2032)
Figure 15. Italy Drinking Water Revenue (USD Million) By Country (2021-2032)
Figure 16. Russia Drinking Water Revenue (USD Million) By Country (2021-2032)
Figure 17. Rest of Europe Drinking Water Revenue (USD Million) By Country (2021-2032)
Figure 11. Asia Pacific Drinking Water Revenue (USD Million) By Country (2021-2032)
Figure 12. China Drinking Water Revenue (USD Million) By Country (2021-2032)
Figure 13. Japan Drinking Water Revenue (USD Million) By Country (2021-2032)
Figure 14. India Drinking Water Revenue (USD Million) By Country (2021-2032)
Figure 15. South Korea Drinking Water Revenue (USD Million) By Country (2021-2032)
Figure 16. Australia Drinking Water Revenue (USD Million) By Country (2021-2032)
Figure 17. South East Asia Drinking Water Revenue (USD Million) By Country (2021-2032)
Figure 18. South America Drinking Water Revenue (USD Million) By Country (2021-2032)
Figure 19. Brazil Drinking Water Revenue (USD Million) By Country (2021-2032)
Figure 20. Argentina Drinking Water Revenue (USD Million) By Country (2021-2032)
Figure 21. Rest of Asia Pacific Drinking Water Revenue (USD Million) By Country (2021-2032)
Figure 22. Middle East and Africa Drinking Water Revenue (USD Million) By Region (2021-2032)
Figure 23. Saudi Arabia Drinking Water Revenue (USD Million) By Region (2021-2032)
Figure 24. The UAE Drinking Water Revenue (USD Million) By Region (2021-2032)
Figure 25. Rest of Middle East Drinking Water Revenue (USD Million) By Region (2021-2032)
Figure 26. South Africa Drinking Water Revenue (USD Million) By Region (2021-2032)
Figure 27. Africa Drinking Water Revenue (USD Million) By Region (2021-2032)
Figure 28. North America Drinking Water Revenue (USD Million) By Type (2021-2032)
Figure 29. North America Drinking Water Revenue (USD Million) By Application (2021-2032)
Figure 30. North America Drinking Water Revenue (USD Million) By Product (2021-2032)
Figure 31. Europe Drinking Water Revenue (USD Million) By Type (2021-2032)
Figure 32. Europe Drinking Water Revenue (USD Million) By Application (2021-2032)
Figure 33. Europe Drinking Water Revenue (USD Million) By Product (2021-2032)
Figure 34. Asia Pacific Drinking Water Revenue (USD Million) By Type (2021-2032)
Figure 35. Asia Pacific Drinking Water Revenue (USD Million) By Application (2021-2032)
Figure 36. Asia Pacific Drinking Water Revenue (USD Million) By Product (2021-2032)
Figure 37. South America Drinking Water Revenue (USD Million) By Type (2021-2032)
Figure 38. South America Drinking Water Revenue (USD Million) By Application (2021-2032)
Figure 39. South America Drinking Water Revenue (USD Million) By Product (2021-2032)
Figure 40. Middle East and Africa Drinking Water Revenue (USD Million) By Type (2021-2032)
Figure 41. Middle East and Africa Drinking Water Revenue (USD Million) By Application (2021-2032)
Figure 42. Middle East and Africa Drinking Water Revenue (USD Million) By Product (2021-2032)
By Type
Mineral Water
Sparkling Water
Distilled Water
Spring Water
Others
By Distribution Channel
Supermarkets/Hypermarkets
Convenience Stores
Online Retailers
Others
Countries Analyzed
North America (US, Canada, Mexico)
Europe (Germany, UK, France, Spain, Italy, Russia, Rest of Europe)
Asia Pacific (China, India, Japan, South Korea, Australia, South East Asia, Rest of Asia)
South America (Brazil, Argentina, Rest of South America)
Middle East and Africa (Saudi Arabia, UAE, Rest of Middle East, South Africa, Egypt, Rest of Africa)
