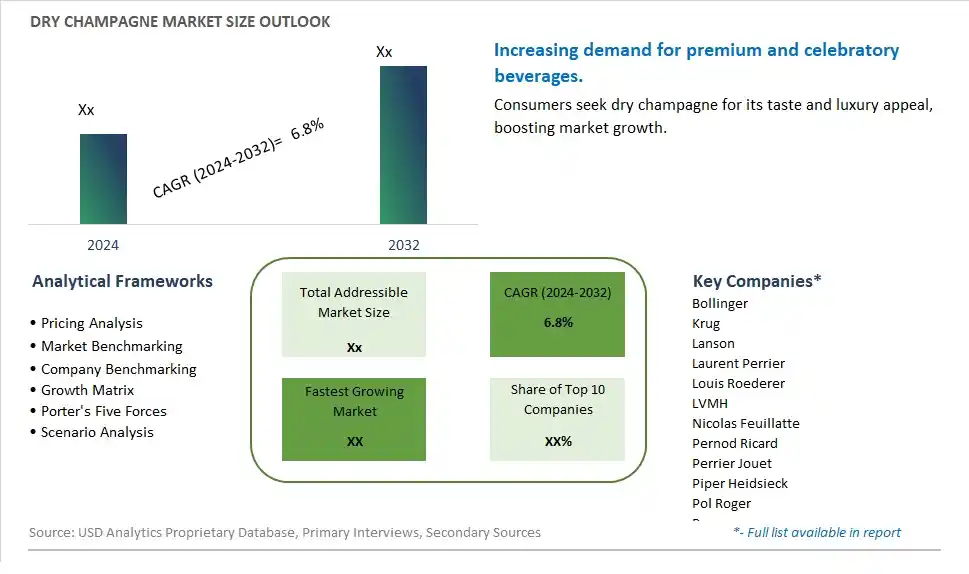
Global Dry Champagne Market Size is valued at $XX Million in 2024 and is forecast to register a growth rate (CAGR) of 6.8% to reach $XX Million by 2032.
The global Dry Champagne Market Comprehensive Study analyzes and forecasts the market size across 6 regions and 24 countries for diverse segments -By Type (Extra Brut, Brut, Extra Dry, Others), By Application (Supermarkets/Hypermarkets, Departmental Stores, Convenience Store, Online, Others)
An Introduction to Dry Champagne Market
In 2024, the Dry Champagne market is witnessing robust growth, fueled by the rising demand for premium and celebratory alcoholic beverages. Dry champagne, known for its refined taste and lower sugar content, is increasingly popular among consumers seeking sophisticated drinking experiences. The market benefits from the growing trend of luxury consumption, the expansion of champagne varieties, and the rising popularity of sparkling wines. Additionally, advancements in production techniques and the increasing focus on quality and authenticity are driving market growth.
Dry Champagne Competitive Landscape
The market report analyses the leading companies in the industry including Bollinger, Krug, Lanson, Laurent Perrier, Louis Roederer, LVMH, Nicolas Feuillatte, Pernod Ricard, Perrier Jouet, Piper Heidsieck, Pol Roger, Pommery, Taittinger, and Others.
Dry Champagne Market Dynamics
Dry Champagne Market Trend: Increasing Demand for Premium and Luxury Alcoholic Beverages
The dry champagne market is witnessing a significant trend towards premium and luxury alcoholic beverages. Consumers are increasingly seeking high-quality, sophisticated drinks for special occasions and celebrations, driving the demand for dry champagne. This trend is particularly strong among affluent consumers who are willing to pay a premium for superior taste, craftsmanship, and brand prestige. The rise of the experiential economy, where consumers prioritize unique and memorable experiences, further supports this trend. Dry champagne, known for its refined taste and elegant presentation, fits perfectly within this context, making it a preferred choice for festive and upscale events.
Dry Champagne Market Driver: Growing Popularity of Celebratory and Social Occasions
A major driver for the dry champagne market is the growing popularity of celebratory and social occasions. As social gatherings, weddings, parties, and other festive events become more frequent and elaborate, the demand for high-quality champagne increases. Dry champagne, with its crisp and refreshing taste, is often associated with celebration and luxury, making it a staple at such events. The resurgence of traditional celebrations and the increasing trend of "bubbles for everyday" are also contributing to this driver. Marketing efforts that emphasize the role of dry champagne in enhancing special moments and creating memorable experiences effectively attract consumers looking to elevate their celebrations.
Dry Champagne Market Opportunity: Expansion Through Innovative Packaging and Marketing
The dry champagne market holds significant opportunities for expansion through innovative packaging and marketing strategies. Companies can differentiate their products by introducing unique and visually appealing packaging that enhances the luxury appeal of dry champagne. Limited edition releases, personalized bottles, and sustainable packaging options can attract a wider audience and create buzz in the market. Additionally, leveraging digital marketing and social media to showcase the lifestyle and experiential aspects of dry champagne can increase brand visibility and engagement. Collaborations with influencers, celebrities, and event planners can further drive market growth by positioning dry champagne as the ultimate choice for sophisticated and celebratory experiences.
Dry Champagne Market Share Analysis: Brut segment generated the highest revenue share in the industry
The largest segment in the Dry Champagne Market is "Brut." Brut champagne is a widely popular type known for its dryness and crispness, making it a favorite choice among champagne enthusiasts worldwide. It strikes a balance between acidity and sweetness, offering a refreshing taste that pairs well with a variety of dishes and occasions. Brut champagne's versatility and broad appeal contribute to its dominance in the market, capturing a significant share of champagne consumers who prefer a dry and elegant flavor profile.
Dry Champagne Market Share Analysis: Online is the fastest growing segment over the forecast period to 2032
The fastest-growing segment in the Dry Champagne Market is "Online." As consumer shopping behaviors evolve, the online channel for purchasing dry champagne experiences rapid growth. Online platforms provide convenience, accessibility, and a wide selection of dry champagne brands and variants, attracting consumers who prefer the ease of ordering from home or on-the-go. Further, online retailers often offer exclusive deals, discounts, and personalized recommendations, enhancing the overall shopping experience for dry champagne enthusiasts. The convenience and extensive reach of online platforms contribute significantly to the segment's fast-paced growth, catering to the modern consumer's preferences and lifestyle demands in the Dry Champagne Market.
Dry Champagne Market Segmentation
By Type
Extra Brut
Brut
Extra Dry
Others
By Application
Supermarkets/Hypermarkets
Departmental Stores
Convenience Store
Online
Others
Countries Analyzed
North America (US, Canada, Mexico)
Europe (Germany, UK, France, Spain, Italy, Russia, Rest of Europe)
Asia Pacific (China, India, Japan, South Korea, Australia, South East Asia, Rest of Asia)
South America (Brazil, Argentina, Rest of South America)
Middle East and Africa (Saudi Arabia, UAE, Rest of Middle East, South Africa, Egypt, Rest of Africa)
Dry Champagne Companies Profiled in the Study
Bollinger
Krug
Lanson
Laurent Perrier
Louis Roederer
LVMH
Nicolas Feuillatte
Pernod Ricard
Perrier Jouet
Piper Heidsieck
Pol Roger
Pommery
Taittinger
*- List Not Exhaustive
Chapter 1. TABLE OF CONTENTS
Chapter 2. Introduction to Dry Champagne Market
2.1. Market Overview
2.2. Key Statistics and Report Highlights
2.3. Scope of the Comprehensive Study
2.3.1. Market Definition
2.3.2 Countries and Regions Covered
2.3.3 Research Objective
2.3.4 Units, Currency, and Conversions
2.3.5 Industry Value Chain
2.4. Key Market Segments
2.5. Key Companies
2.6. Study Period
Chapter 3. Strategic Analysis Review
3.1. Dry Champagne Pricing Analysis and Forecast
3.2. Porter’s Five Forces
3.3. Market Ecosystem
3.4. SWOT Analysis
3.5. Regulatory Scenario
3.3. Effects of Inflation, Russia-Ukraine War, moderating economic growth, and other macroeconomic factors
Chapter 4. Competitive Landscape
4.1. Market Share Analysis
4.1.1. Global Dry Champagne Market Share by Company, 2023
4.1.2. Product Offerings of Leading Dry Champagne Companies
4.2. Market Entropy
4.2.1. New Product Launches in the Industry
4.2.2. Mergers, Acquisitions, Joint ventures, and Partnerships
4.3. Key Strategies and Best Practices
Chapter 5. Global Market Projections: Best, Reference, and Low Case Scenarios
5.1. Growth Analysis- Case Scenario Definitions
5.2. Low Growth Case Scenario Forecasts
5.3. Reference Growth Case Scenario Forecasts
5.4. High Growth Case Scenario Forecasts
Chapter 6. Market Dynamics
6.1. Dry Champagne Market Drivers
6.2. Dry Champagne Market Challenges
6.6. Dry Champagne Market Opportunities
6.4. Dry Champagne Market Trends
Chapter 7. Global Dry Champagne Market Outlook Trends
7.1. Global Dry Champagne Revenue (USD Million) and CAGR (%) by Type (2021-2032)
7.2. Global Dry Champagne Revenue (USD Million) and CAGR (%) by Application (2021-2032)
7.3. Global Dry Champagne Revenue (USD Million) and CAGR (%) by Product (2021-2032)
By Type
Extra Brut
Brut
Extra Dry
Others
By Application
Supermarkets/Hypermarkets
Departmental Stores
Convenience Store
Online
Others
Chapter 8. Global Dry Champagne Regional Analysis and Outlook
8.1. Global Dry Champagne Revenue (USD Million) By Regions (2021- 2032)
8.2. North America Dry Champagne Revenue (USD Million) by Country (2021-2032)
8.2.1. United States Dry Champagne Regional Analysis and Outlook
8.2.2. Canada Dry Champagne Regional Analysis and Outlook
8.2.3. Mexico Dry Champagne Regional Analysis and Outlook
8.3. Europe Dry Champagne Revenue (USD Million), by Country (2021-2032)
8.3.1. Germany Dry Champagne Regional Analysis and Outlook
8.3.2. France Dry Champagne Regional Analysis and Outlook
8.3.3. United Kingdom Dry Champagne Regional Analysis and Outlook
8.3.4. Spain Dry Champagne Regional Analysis and Outlook
8.3.5. Italy Dry Champagne Regional Analysis and Outlook
8.3.6. Russia Dry Champagne Regional Analysis and Outlook
8.3.7. Rest of Europe Dry Champagne Regional Analysis and Outlook
8.4. Asia Pacific Dry Champagne Revenue (USD Million) by Country (2021-2032)
8.4.1. China Dry Champagne Regional Analysis and Outlook
8.4.2. Japan Dry Champagne Regional Analysis and Outlook
8.4.3. India Dry Champagne Regional Analysis and Outlook
8.4.4. South Korea Dry Champagne Regional Analysis and Outlook
8.4.5. Australia Dry Champagne Regional Analysis and Outlook
8.4.6. South East Asia Dry Champagne Regional Analysis and Outlook
8.4.7. Rest of Asia Pacific Dry Champagne Regional Analysis and Outlook
8.5. South America Dry Champagne Revenue (USD Million), by Country (2021-2032)
8.5.1. Brazil Dry Champagne Regional Analysis and Outlook
8.5.2. Argentina Dry Champagne Regional Analysis and Outlook
8.5.3. Rest of South America Dry Champagne Regional Analysis and Outlook
8.6. Middle East and Africa Dry Champagne Revenue (USD Million) by Country (2021-2032)
8.6.1. Middle East Dry Champagne Regional Analysis and Outlook
8.6.2. Africa Dry Champagne Regional Analysis and Outlook
Chapter 9. North America Dry Champagne Analysis and Outlook
9.1. North America Dry Champagne Revenue (USD Million) by Segments (2021-2032)
9.1.1. North America Dry Champagne Revenue (USD Million) by Type (2021-2032)
9.1.2. North America Dry Champagne Revenue (USD Million) by Application (2021-2032)
9.1.3. North America Dry Champagne Revenue (USD Million) by Product (2021-2032)
By Type
Extra Brut
Brut
Extra Dry
Others
By Application
Supermarkets/Hypermarkets
Departmental Stores
Convenience Store
Online
Others
Chapter 10. Europe Dry Champagne Analysis and Outlook
10.1. Europe Dry Champagne Revenue (USD Million), by Segments (USD Million) (2021-2032)
10.1.1. Europe Dry Champagne Revenue (USD Million) by Type (2021-2032)
10.1.2. Europe Dry Champagne Revenue (USD Million) by Application (2021-2032)
10.1.3. Europe Dry Champagne Revenue (USD Million) by Product (2021-2032)
By Type
Extra Brut
Brut
Extra Dry
Others
By Application
Supermarkets/Hypermarkets
Departmental Stores
Convenience Store
Online
Others
Chapter 11. Asia Pacific Dry Champagne Analysis and Outlook
11.1. Asia Pacific Dry Champagne Revenue (USD Million), and Revenue (USD Million) by Segments (2021-2032)
11.1.1. Asia Pacific Dry Champagne Revenue (USD Million) by Type (2021-2032)
11.1.2. Asia Pacific Dry Champagne Revenue (USD Million) by Application (2021-2032)
11.1.3. Asia Pacific Dry Champagne Revenue (USD Million) by Product (2021-2032)
By Type
Extra Brut
Brut
Extra Dry
Others
By Application
Supermarkets/Hypermarkets
Departmental Stores
Convenience Store
Online
Others
Chapter 12. South America Dry Champagne Analysis and Outlook
12.1. South America Dry Champagne Revenue (USD Million), by Segments (2021-2032)
12.1.1. South America Dry Champagne Revenue (USD Million) by Type (2021-2032)
12.1.2. South America Dry Champagne Revenue (USD Million) by Application (2021-2032)
12.1.3. South America Dry Champagne Revenue (USD Million) by Product (2021-2032)
By Type
Extra Brut
Brut
Extra Dry
Others
By Application
Supermarkets/Hypermarkets
Departmental Stores
Convenience Store
Online
Others
Chapter 13. Middle East and Africa Dry Champagne Analysis and Outlook
13.1. Middle East and Africa Dry Champagne Revenue (USD Million), by Segments (2021-2032)
13.1.1. Middle East and Africa Dry Champagne Revenue (USD Million) by Type (2021-2032)
13.1.2. Middle East and Africa Dry Champagne Revenue (USD Million) by Application (2021-2032)
13.1.3. Middle East and Africa Dry Champagne Revenue (USD Million) by Product (2021-2032)
By Type
Extra Brut
Brut
Extra Dry
Others
By Application
Supermarkets/Hypermarkets
Departmental Stores
Convenience Store
Online
Others
Chapter 14. Dry Champagne Company Profiles
14.1 Business Overview
14.2 Product Profiles
14.3 SWOT Profiles
14.5 Recent Developments
14.6 Financial Profile
List of Companies
Bollinger
Krug
Lanson
Laurent Perrier
Louis Roederer
LVMH
Nicolas Feuillatte
Pernod Ricard
Perrier Jouet
Piper Heidsieck
Pol Roger
Pommery
Taittinger
15. Methodology and Data Sources
15.1 Customization Offerings
15.2 Subscription Services
15.3 Related Reports
15.4 Publisher Expertise
LIST OF TABLES
Table 1 Market Segmentation Analysis
Table 2 Global Dry Champagne Market Share of Leading Companies, 2023
Table 3 Product Offerings of Leading Companies
Table 4 Low Growth Scenario Forecasts
Table 5 Reference Case Growth Scenario
Table 6 High Growth Case Scenario
Table 7 Global Dry Champagne Revenue (USD Million) And CAGR (%) By Type (2021-2032)
Table 8 Global Dry Champagne Revenue (USD Million) And CAGR (%) By Application (2021-2032)
Table 9 Global Dry Champagne Revenue (USD Million) And CAGR (%) By Product (2021-2032)
Table 10 Global Dry Champagne Market Revenue (USD Million) By Regions (2021-2032)
Table 11 Global Dry Champagne Market Share (%) By Regions (2021-2032)
Table 12 North America Dry Champagne Revenue (USD Million) By Country (2021-2032)
Table 13 Europe Dry Champagne Revenue (USD Million) By Country (2021-2032)
Table 14 Asia Pacific Dry Champagne Revenue (USD Million) By Country (2021-2032)
Table 15 South America Dry Champagne Revenue (USD Million) By Country (2021-2032)
Table 16 Middle East and Africa Dry Champagne Revenue (USD Million) By Region (2021-2032)
Table 17 North America Dry Champagne Revenue (USD Million) By Type (2021-2032)
Table 18 North America Dry Champagne Revenue (USD Million) By Application (2021-2032)
Table 19 North America Dry Champagne Revenue (USD Million) By Product (2021-2032)
Table 20 Europe Dry Champagne Revenue (USD Million) By Type (2021-2032)
Table 21 Europe Dry Champagne Revenue (USD Million) By Application (2021-2032)
Table 22 Europe Dry Champagne Revenue (USD Million) By Product (2021-2032)
Table 23 Asia Pacific Dry Champagne Revenue (USD Million) By Type (2021-2032)
Table 24 Asia Pacific Dry Champagne Revenue (USD Million) By Application (2021-2032)
Table 25 Asia Pacific Dry Champagne Revenue (USD Million) By Product (2021-2032)
Table 26 South America Dry Champagne Revenue (USD Million) By Type (2021-2032)
Table 27 South America Dry Champagne Revenue (USD Million) By Application (2021-2032)
Table 28 South America Dry Champagne Revenue (USD Million) By Product (2021-2032)
Table 29 Middle East and Africa Dry Champagne Revenue (USD Million) By Type (2021-2032)
Table 30 Middle East and Africa Dry Champagne Revenue (USD Million) By Application (2021-2032)
Table 31 Middle East and Africa Dry Champagne Revenue (USD Million) By Product (2021-2032)
LIST OF FIGURES
Figure 1. Market Scope
Figure 2. Pricing Forecasts Per Unit, 2023- 2032
Figure 3. Porter’s Five Forces
Figure 4. Global Dry Champagne Market Revenue (USD Million) By Regions (2021-2032)
Figure 5. Global Dry Champagne Market Share (%) By Regions (2023)
Figure 6. North America Dry Champagne Revenue (USD Million) By Country (2021-2032)
Figure 7. United States Dry Champagne Revenue (USD Million) By Country (2021-2032)
Figure 8. Canada Dry Champagne Revenue (USD Million) By Country (2021-2032)
Figure 9. Mexico Dry Champagne Revenue (USD Million) By Country (2021-2032)
Figure 10. Europe Dry Champagne Revenue (USD Million) By Country (2021-2032)
Figure 11. Germany Dry Champagne Revenue (USD Million) By Country (2021-2032)
Figure 12. France Dry Champagne Revenue (USD Million) By Country (2021-2032)
Figure 13. United Kingdom Dry Champagne Revenue (USD Million) By Country (2021-2032)
Figure 14. Spain Dry Champagne Revenue (USD Million) By Country (2021-2032)
Figure 15. Italy Dry Champagne Revenue (USD Million) By Country (2021-2032)
Figure 16. Russia Dry Champagne Revenue (USD Million) By Country (2021-2032)
Figure 17. Rest of Europe Dry Champagne Revenue (USD Million) By Country (2021-2032)
Figure 11. Asia Pacific Dry Champagne Revenue (USD Million) By Country (2021-2032)
Figure 12. China Dry Champagne Revenue (USD Million) By Country (2021-2032)
Figure 13. Japan Dry Champagne Revenue (USD Million) By Country (2021-2032)
Figure 14. India Dry Champagne Revenue (USD Million) By Country (2021-2032)
Figure 15. South Korea Dry Champagne Revenue (USD Million) By Country (2021-2032)
Figure 16. Australia Dry Champagne Revenue (USD Million) By Country (2021-2032)
Figure 17. South East Asia Dry Champagne Revenue (USD Million) By Country (2021-2032)
Figure 18. South America Dry Champagne Revenue (USD Million) By Country (2021-2032)
Figure 19. Brazil Dry Champagne Revenue (USD Million) By Country (2021-2032)
Figure 20. Argentina Dry Champagne Revenue (USD Million) By Country (2021-2032)
Figure 21. Rest of Asia Pacific Dry Champagne Revenue (USD Million) By Country (2021-2032)
Figure 22. Middle East and Africa Dry Champagne Revenue (USD Million) By Region (2021-2032)
Figure 23. Saudi Arabia Dry Champagne Revenue (USD Million) By Region (2021-2032)
Figure 24. The UAE Dry Champagne Revenue (USD Million) By Region (2021-2032)
Figure 25. Rest of Middle East Dry Champagne Revenue (USD Million) By Region (2021-2032)
Figure 26. South Africa Dry Champagne Revenue (USD Million) By Region (2021-2032)
Figure 27. Africa Dry Champagne Revenue (USD Million) By Region (2021-2032)
Figure 28. North America Dry Champagne Revenue (USD Million) By Type (2021-2032)
Figure 29. North America Dry Champagne Revenue (USD Million) By Application (2021-2032)
Figure 30. North America Dry Champagne Revenue (USD Million) By Product (2021-2032)
Figure 31. Europe Dry Champagne Revenue (USD Million) By Type (2021-2032)
Figure 32. Europe Dry Champagne Revenue (USD Million) By Application (2021-2032)
Figure 33. Europe Dry Champagne Revenue (USD Million) By Product (2021-2032)
Figure 34. Asia Pacific Dry Champagne Revenue (USD Million) By Type (2021-2032)
Figure 35. Asia Pacific Dry Champagne Revenue (USD Million) By Application (2021-2032)
Figure 36. Asia Pacific Dry Champagne Revenue (USD Million) By Product (2021-2032)
Figure 37. South America Dry Champagne Revenue (USD Million) By Type (2021-2032)
Figure 38. South America Dry Champagne Revenue (USD Million) By Application (2021-2032)
Figure 39. South America Dry Champagne Revenue (USD Million) By Product (2021-2032)
Figure 40. Middle East and Africa Dry Champagne Revenue (USD Million) By Type (2021-2032)
Figure 41. Middle East and Africa Dry Champagne Revenue (USD Million) By Application (2021-2032)
Figure 42. Middle East and Africa Dry Champagne Revenue (USD Million) By Product (2021-2032)
By Type
Extra Brut
Brut
Extra Dry
Others
By Application
Supermarkets/Hypermarkets
Departmental Stores
Convenience Store
Online
Others
Countries Analyzed
North America (US, Canada, Mexico)
Europe (Germany, UK, France, Spain, Italy, Russia, Rest of Europe)
Asia Pacific (China, India, Japan, South Korea, Australia, South East Asia, Rest of Asia)
South America (Brazil, Argentina, Rest of South America)
Middle East and Africa (Saudi Arabia, UAE, Rest of Middle East, South Africa, Egypt, Rest of Africa)
