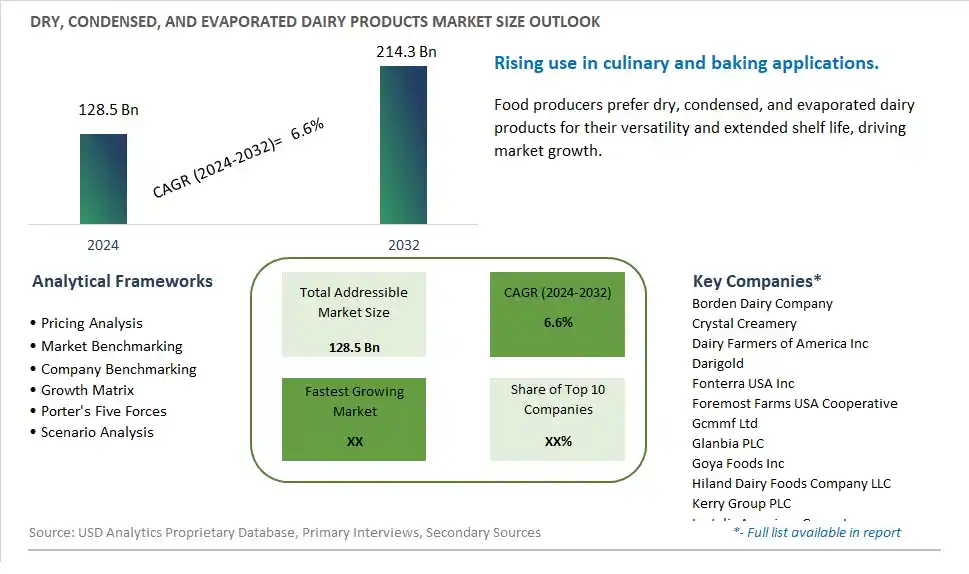
Global Dry, Condensed, and Evaporated Dairy Products Market Size is valued at $128.5 Billion in 2024 and is forecast to register a growth rate (CAGR) of 6.6% to reach $214.3 Billion by 2032.
The global Dry, Condensed, and Evaporated Dairy Products Market Comprehensive Study analyzes and forecasts the market size across 6 regions and 24 countries for diverse segments -By Type (Dry Dairy Product, Condensed Dairy Product, Evaporated Dairy Product), By Distribution Channel (Supermarkets/Hypermarkets, Convenience Stores, E-Commerce, Others), By End-User (Food, Beverages, Intermediate Products, Condiments, Others)
An Introduction to Dry, Condensed, and Evaporated Dairy Products Market
The Dry Condensed and Evaporated Dairy Products market in 2024 is thriving, driven by the increasing demand for convenient and long-lasting dairy alternatives. These products, including dry milk powders and evaporated milk, are widely used in the food and beverage industry for their versatility and nutritional benefits. The market benefits from the rising trend of convenience foods, the growing demand for shelf-stable ingredients, and the expansion of dairy applications in bakery, confectionery, and processed foods. Additionally, innovations in processing technologies and packaging are enhancing product quality and shelf life.
Dry Condensed and Evaporated Dairy Products Competitive Landscape
The market report analyses the leading companies in the industry including Borden Dairy Company, Crystal Creamery, Dairy Farmers of America Inc, Darigold, Fonterra USA Inc, Foremost Farms USA Cooperative, Gcmmf Ltd, Glanbia PLC, Goya Foods Inc, Hiland Dairy Foods Company LLC, Kerry Group PLC, Lactalis American Group Inc, Land O'Lakes Inc, Leprino Foods Company, Magnolia Inc, Merrick's Inc, Milk Specialties Company, Nestlé S.A, PBM Covington LLC, Prairie Farms Dairy Inc, Rhodes Food Group, Saputo Inc, Schreiber Foods Inc, Tate & Lyle PLC, The J.M. Smucker Company, and Others.
Dry Condensed and Evaporated Dairy Products Market Dynamics
Dry Condensed and Evaporated Dairy Products Market Trend: Growing Demand for Shelf-Stable Dairy Products
The market for dry condensed and evaporated dairy products is experiencing a significant trend towards shelf-stable dairy solutions. As consumers and businesses increasingly seek products with extended shelf lives and convenient storage options, the demand for these dairy products rises. This trend is particularly strong in regions with limited refrigeration infrastructure and among consumers who prioritize pantry-stable foods for their longevity and reduced waste. The COVID-19 pandemic has further accelerated this trend, as consumers stockpile non-perishable food items to ensure food security during uncertain times. The versatility and ease of use of dry condensed and evaporated dairy products in various culinary applications also support their growing popularity.
Dry Condensed and Evaporated Dairy Products Market Driver: Rising Demand in the Foodservice Industry
A major driver for the dry condensed and evaporated dairy products market is the rising demand from the foodservice industry. Restaurants, bakeries, and food manufacturers require reliable and cost-effective dairy ingredients that can be stored for longer periods without spoiling. Dry condensed and evaporated dairy products offer the ideal solution, providing consistent quality and convenience. The foodservice industry's growth, driven by increasing urbanization, busy lifestyles, and the rise of quick-service restaurants, further fuels this demand. Additionally, these dairy products are essential in many traditional and modern recipes, making them a staple in professional kitchens.
Dry Condensed and Evaporated Dairy Products Market Opportunity: Expansion into Emerging Markets and E-Commerce Channels
The dry condensed and evaporated dairy products market presents significant opportunities for expansion into emerging markets and e-commerce channels. As developing regions experience economic growth and improved living standards, there is a rising demand for convenient and nutritious food products, including shelf-stable dairy items. Companies can leverage this opportunity by expanding their distribution networks and introducing their products to new geographical areas. Furthermore, the increasing trend of online grocery shopping provides a lucrative avenue for reaching a broader consumer base. Developing robust e-commerce platforms and engaging in targeted digital marketing can enhance product visibility and accessibility, driving sales and market growth in both established and emerging markets.
Dry, Condensed, and Evaporated Dairy Products Market Share Analysis- Largest Segment by Type
The Dry Dairy Product segment is the largest in the Dry, Condensed, and Evaporated Dairy Products Market by type. This dominance is due to the widespread use and versatility of dry dairy products, such as milk powder and whey powder, in various food and beverage applications. Dry dairy products are valued for their long shelf life, ease of storage, and convenience in transportation, making them essential ingredients in the food processing industry. They are commonly used in the production of baked goods, confectionery, infant formula, and nutritional supplements. The high demand for dry dairy products in both developed and developing markets supports their significant market share. Additionally, the continuous innovation in product formulations, including fortified and specialized milk powders, further enhances their appeal and market position.
Dry, Condensed, and Evaporated Dairy Products Market Share Analysis- Fastest Growing Segment by Distribution Channel
The E-Commerce segment is poised to grow the fastest in the Dry, Condensed, and Evaporated Dairy Products Market by distribution channel over the next five years. This rapid growth is driven by the increasing consumer shift towards online shopping and the convenience it offers. E-commerce platforms provide a wide variety of dairy products, including niche and specialty items that may not be readily available in physical stores. The convenience of browsing and purchasing from home, coupled with the option of home delivery, appeals to a broad range of consumers. The COVID-19 pandemic has further accelerated the adoption of online shopping, and this trend continues as consumers appreciate the safety and convenience of having products delivered to their doorstep. Additionally, online retailers often offer competitive pricing, detailed product information, and customer reviews, which further drive consumer confidence and sales. The growth of digital marketing and targeted online advertisements also boosts the visibility and sales of dry, condensed, and evaporated dairy products through e-commerce channels.
Dry, Condensed, and Evaporated Dairy Products Market Share Analysis- Largest Segment by End-User
The Food segment is the largest in the Dry, Condensed, and Evaporated Dairy Products Market by end-user. This dominance is driven by the extensive use of dairy products as essential ingredients in various food applications, including bakery, confectionery, and processed foods. Dry dairy products such as milk powder and whey powder are widely used for their functional properties, such as emulsification, stabilization, and flavor enhancement. Condensed and evaporated dairy products are also commonly used in desserts, sauces, and ready-to-eat meals, contributing to their significant market share. The high demand for dairy-based ingredients in the food processing industry, coupled with the versatility of these products in enhancing the taste, texture, and nutritional profile of food items, supports their dominant position. Additionally, the continuous innovation in food product formulations and the growing consumer preference for convenient and nutritious food options further reinforce the prominence of the food segment.
Dry Condensed and Evaporated Dairy Products Market Segmentation
By Type
Dry Dairy Product
Condensed Dairy Product
Evaporated Dairy Product
By Distribution Channel
Supermarkets/Hypermarkets
Convenience Stores
E-Commerce
Others
By End-User
Food
Beverages
Intermediate Products
Condiments
Others
Countries Analyzed
North America (US, Canada, Mexico)
Europe (Germany, UK, France, Spain, Italy, Russia, Rest of Europe)
Asia Pacific (China, India, Japan, South Korea, Australia, South East Asia, Rest of Asia)
South America (Brazil, Argentina, Rest of South America)
Middle East and Africa (Saudi Arabia, UAE, Rest of Middle East, South Africa, Egypt, Rest of Africa)
Dry Condensed and Evaporated Dairy Products Companies Profiled in the Study
Borden Dairy Company
Crystal Creamery
Dairy Farmers of America Inc
Darigold
Fonterra USA Inc
Foremost Farms USA Cooperative
Gcmmf Ltd
Glanbia PLC
Goya Foods Inc
Hiland Dairy Foods Company LLC
Kerry Group PLC
Lactalis American Group Inc
Land O'Lakes Inc
Leprino Foods Company
Magnolia Inc
Merrick's Inc
Milk Specialties Company
Nestlé S.A
PBM Covington LLC
Prairie Farms Dairy Inc
Rhodes Food Group
Saputo Inc
Schreiber Foods Inc
Tate & Lyle PLC
The J.M. Smucker Company
*- List Not Exhaustive
Chapter 1. TABLE OF CONTENTS
Chapter 2. Introduction to Dry Condensed and Evaporated Dairy Products Market
2.1. Market Overview
2.2. Key Statistics and Report Highlights
2.3. Scope of the Comprehensive Study
2.3.1. Market Definition
2.3.2 Countries and Regions Covered
2.3.3 Research Objective
2.3.4 Units, Currency, and Conversions
2.3.5 Industry Value Chain
2.4. Key Market Segments
2.5. Key Companies
2.6. Study Period
Chapter 3. Strategic Analysis Review
3.1. Dry Condensed and Evaporated Dairy Products Pricing Analysis and Forecast
3.2. Porter’s Five Forces
3.3. Market Ecosystem
3.4. SWOT Analysis
3.5. Regulatory Scenario
3.3. Effects of Inflation, Russia-Ukraine War, moderating economic growth, and other macroeconomic factors
Chapter 4. Competitive Landscape
4.1. Market Share Analysis
4.1.1. Global Dry Condensed and Evaporated Dairy Products Market Share by Company, 2023
4.1.2. Product Offerings of Leading Dry Condensed and Evaporated Dairy Products Companies
4.2. Market Entropy
4.2.1. New Product Launches in the Industry
4.2.2. Mergers, Acquisitions, Joint ventures, and Partnerships
4.3. Key Strategies and Best Practices
Chapter 5. Global Market Projections: Best, Reference, and Low Case Scenarios
5.1. Growth Analysis- Case Scenario Definitions
5.2. Low Growth Case Scenario Forecasts
5.3. Reference Growth Case Scenario Forecasts
5.4. High Growth Case Scenario Forecasts
Chapter 6. Market Dynamics
6.1. Dry Condensed and Evaporated Dairy Products Market Drivers
6.2. Dry Condensed and Evaporated Dairy Products Market Challenges
6.6. Dry Condensed and Evaporated Dairy Products Market Opportunities
6.4. Dry Condensed and Evaporated Dairy Products Market Trends
Chapter 7. Global Dry Condensed and Evaporated Dairy Products Market Outlook Trends
7.1. Global Dry Condensed and Evaporated Dairy Products Revenue (USD Million) and CAGR (%) by Type (2021-2032)
7.2. Global Dry Condensed and Evaporated Dairy Products Revenue (USD Million) and CAGR (%) by Application (2021-2032)
7.3. Global Dry Condensed and Evaporated Dairy Products Revenue (USD Million) and CAGR (%) by Product (2021-2032)
By Type
Dry Dairy Product
Condensed Dairy Product
Evaporated Dairy Product
By Distribution Channel
Supermarkets/Hypermarkets
Convenience Stores
E-Commerce
Others
By End-User
Food
Beverages
Intermediate Products
Condiments
Others
Chapter 8. Global Dry Condensed and Evaporated Dairy Products Regional Analysis and Outlook
8.1. Global Dry Condensed and Evaporated Dairy Products Revenue (USD Million) By Regions (2021- 2032)
8.2. North America Dry Condensed and Evaporated Dairy Products Revenue (USD Million) by Country (2021-2032)
8.2.1. United States Dry Condensed and Evaporated Dairy Products Regional Analysis and Outlook
8.2.2. Canada Dry Condensed and Evaporated Dairy Products Regional Analysis and Outlook
8.2.3. Mexico Dry Condensed and Evaporated Dairy Products Regional Analysis and Outlook
8.3. Europe Dry Condensed and Evaporated Dairy Products Revenue (USD Million), by Country (2021-2032)
8.3.1. Germany Dry Condensed and Evaporated Dairy Products Regional Analysis and Outlook
8.3.2. France Dry Condensed and Evaporated Dairy Products Regional Analysis and Outlook
8.3.3. United Kingdom Dry Condensed and Evaporated Dairy Products Regional Analysis and Outlook
8.3.4. Spain Dry Condensed and Evaporated Dairy Products Regional Analysis and Outlook
8.3.5. Italy Dry Condensed and Evaporated Dairy Products Regional Analysis and Outlook
8.3.6. Russia Dry Condensed and Evaporated Dairy Products Regional Analysis and Outlook
8.3.7. Rest of Europe Dry Condensed and Evaporated Dairy Products Regional Analysis and Outlook
8.4. Asia Pacific Dry Condensed and Evaporated Dairy Products Revenue (USD Million) by Country (2021-2032)
8.4.1. China Dry Condensed and Evaporated Dairy Products Regional Analysis and Outlook
8.4.2. Japan Dry Condensed and Evaporated Dairy Products Regional Analysis and Outlook
8.4.3. India Dry Condensed and Evaporated Dairy Products Regional Analysis and Outlook
8.4.4. South Korea Dry Condensed and Evaporated Dairy Products Regional Analysis and Outlook
8.4.5. Australia Dry Condensed and Evaporated Dairy Products Regional Analysis and Outlook
8.4.6. South East Asia Dry Condensed and Evaporated Dairy Products Regional Analysis and Outlook
8.4.7. Rest of Asia Pacific Dry Condensed and Evaporated Dairy Products Regional Analysis and Outlook
8.5. South America Dry Condensed and Evaporated Dairy Products Revenue (USD Million), by Country (2021-2032)
8.5.1. Brazil Dry Condensed and Evaporated Dairy Products Regional Analysis and Outlook
8.5.2. Argentina Dry Condensed and Evaporated Dairy Products Regional Analysis and Outlook
8.5.3. Rest of South America Dry Condensed and Evaporated Dairy Products Regional Analysis and Outlook
8.6. Middle East and Africa Dry Condensed and Evaporated Dairy Products Revenue (USD Million) by Country (2021-2032)
8.6.1. Middle East Dry Condensed and Evaporated Dairy Products Regional Analysis and Outlook
8.6.2. Africa Dry Condensed and Evaporated Dairy Products Regional Analysis and Outlook
Chapter 9. North America Dry Condensed and Evaporated Dairy Products Analysis and Outlook
9.1. North America Dry Condensed and Evaporated Dairy Products Revenue (USD Million) by Segments (2021-2032)
9.1.1. North America Dry Condensed and Evaporated Dairy Products Revenue (USD Million) by Type (2021-2032)
9.1.2. North America Dry Condensed and Evaporated Dairy Products Revenue (USD Million) by Application (2021-2032)
9.1.3. North America Dry Condensed and Evaporated Dairy Products Revenue (USD Million) by Product (2021-2032)
By Type
Dry Dairy Product
Condensed Dairy Product
Evaporated Dairy Product
By Distribution Channel
Supermarkets/Hypermarkets
Convenience Stores
E-Commerce
Others
By End-User
Food
Beverages
Intermediate Products
Condiments
Others
Chapter 10. Europe Dry Condensed and Evaporated Dairy Products Analysis and Outlook
10.1. Europe Dry Condensed and Evaporated Dairy Products Revenue (USD Million), by Segments (USD Million) (2021-2032)
10.1.1. Europe Dry Condensed and Evaporated Dairy Products Revenue (USD Million) by Type (2021-2032)
10.1.2. Europe Dry Condensed and Evaporated Dairy Products Revenue (USD Million) by Application (2021-2032)
10.1.3. Europe Dry Condensed and Evaporated Dairy Products Revenue (USD Million) by Product (2021-2032)
By Type
Dry Dairy Product
Condensed Dairy Product
Evaporated Dairy Product
By Distribution Channel
Supermarkets/Hypermarkets
Convenience Stores
E-Commerce
Others
By End-User
Food
Beverages
Intermediate Products
Condiments
Others
Chapter 11. Asia Pacific Dry Condensed and Evaporated Dairy Products Analysis and Outlook
11.1. Asia Pacific Dry Condensed and Evaporated Dairy Products Revenue (USD Million), and Revenue (USD Million) by Segments (2021-2032)
11.1.1. Asia Pacific Dry Condensed and Evaporated Dairy Products Revenue (USD Million) by Type (2021-2032)
11.1.2. Asia Pacific Dry Condensed and Evaporated Dairy Products Revenue (USD Million) by Application (2021-2032)
11.1.3. Asia Pacific Dry Condensed and Evaporated Dairy Products Revenue (USD Million) by Product (2021-2032)
By Type
Dry Dairy Product
Condensed Dairy Product
Evaporated Dairy Product
By Distribution Channel
Supermarkets/Hypermarkets
Convenience Stores
E-Commerce
Others
By End-User
Food
Beverages
Intermediate Products
Condiments
Others
Chapter 12. South America Dry Condensed and Evaporated Dairy Products Analysis and Outlook
12.1. South America Dry Condensed and Evaporated Dairy Products Revenue (USD Million), by Segments (2021-2032)
12.1.1. South America Dry Condensed and Evaporated Dairy Products Revenue (USD Million) by Type (2021-2032)
12.1.2. South America Dry Condensed and Evaporated Dairy Products Revenue (USD Million) by Application (2021-2032)
12.1.3. South America Dry Condensed and Evaporated Dairy Products Revenue (USD Million) by Product (2021-2032)
By Type
Dry Dairy Product
Condensed Dairy Product
Evaporated Dairy Product
By Distribution Channel
Supermarkets/Hypermarkets
Convenience Stores
E-Commerce
Others
By End-User
Food
Beverages
Intermediate Products
Condiments
Others
Chapter 13. Middle East and Africa Dry Condensed and Evaporated Dairy Products Analysis and Outlook
13.1. Middle East and Africa Dry Condensed and Evaporated Dairy Products Revenue (USD Million), by Segments (2021-2032)
13.1.1. Middle East and Africa Dry Condensed and Evaporated Dairy Products Revenue (USD Million) by Type (2021-2032)
13.1.2. Middle East and Africa Dry Condensed and Evaporated Dairy Products Revenue (USD Million) by Application (2021-2032)
13.1.3. Middle East and Africa Dry Condensed and Evaporated Dairy Products Revenue (USD Million) by Product (2021-2032)
By Type
Dry Dairy Product
Condensed Dairy Product
Evaporated Dairy Product
By Distribution Channel
Supermarkets/Hypermarkets
Convenience Stores
E-Commerce
Others
By End-User
Food
Beverages
Intermediate Products
Condiments
Others
Chapter 14. Dry Condensed and Evaporated Dairy Products Company Profiles
14.1 Business Overview
14.2 Product Profiles
14.3 SWOT Profiles
14.5 Recent Developments
14.6 Financial Profile
List of Companies
Borden Dairy Company
Crystal Creamery
Dairy Farmers of America Inc
Darigold
Fonterra USA Inc
Foremost Farms USA Cooperative
Gcmmf Ltd
Glanbia PLC
Goya Foods Inc
Hiland Dairy Foods Company LLC
Kerry Group PLC
Lactalis American Group Inc
Land O'Lakes Inc
Leprino Foods Company
Magnolia Inc
Merrick's Inc
Milk Specialties Company
Nestlé S.A
PBM Covington LLC
Prairie Farms Dairy Inc
Rhodes Food Group
Saputo Inc
Schreiber Foods Inc
Tate & Lyle PLC
The J.M. Smucker Company
15. Methodology and Data Sources
15.1 Customization Offerings
15.2 Subscription Services
15.3 Related Reports
15.4 Publisher Expertise
LIST OF TABLES
Table 1 Market Segmentation Analysis
Table 2 Global Dry Condensed and Evaporated Dairy Products Market Share of Leading Companies, 2023
Table 3 Product Offerings of Leading Companies
Table 4 Low Growth Scenario Forecasts
Table 5 Reference Case Growth Scenario
Table 6 High Growth Case Scenario
Table 7 Global Dry Condensed and Evaporated Dairy Products Revenue (USD Million) And CAGR (%) By Type (2021-2032)
Table 8 Global Dry Condensed and Evaporated Dairy Products Revenue (USD Million) And CAGR (%) By Application (2021-2032)
Table 9 Global Dry Condensed and Evaporated Dairy Products Revenue (USD Million) And CAGR (%) By Product (2021-2032)
Table 10 Global Dry Condensed and Evaporated Dairy Products Market Revenue (USD Million) By Regions (2021-2032)
Table 11 Global Dry Condensed and Evaporated Dairy Products Market Share (%) By Regions (2021-2032)
Table 12 North America Dry Condensed and Evaporated Dairy Products Revenue (USD Million) By Country (2021-2032)
Table 13 Europe Dry Condensed and Evaporated Dairy Products Revenue (USD Million) By Country (2021-2032)
Table 14 Asia Pacific Dry Condensed and Evaporated Dairy Products Revenue (USD Million) By Country (2021-2032)
Table 15 South America Dry Condensed and Evaporated Dairy Products Revenue (USD Million) By Country (2021-2032)
Table 16 Middle East and Africa Dry Condensed and Evaporated Dairy Products Revenue (USD Million) By Region (2021-2032)
Table 17 North America Dry Condensed and Evaporated Dairy Products Revenue (USD Million) By Type (2021-2032)
Table 18 North America Dry Condensed and Evaporated Dairy Products Revenue (USD Million) By Application (2021-2032)
Table 19 North America Dry Condensed and Evaporated Dairy Products Revenue (USD Million) By Product (2021-2032)
Table 20 Europe Dry Condensed and Evaporated Dairy Products Revenue (USD Million) By Type (2021-2032)
Table 21 Europe Dry Condensed and Evaporated Dairy Products Revenue (USD Million) By Application (2021-2032)
Table 22 Europe Dry Condensed and Evaporated Dairy Products Revenue (USD Million) By Product (2021-2032)
Table 23 Asia Pacific Dry Condensed and Evaporated Dairy Products Revenue (USD Million) By Type (2021-2032)
Table 24 Asia Pacific Dry Condensed and Evaporated Dairy Products Revenue (USD Million) By Application (2021-2032)
Table 25 Asia Pacific Dry Condensed and Evaporated Dairy Products Revenue (USD Million) By Product (2021-2032)
Table 26 South America Dry Condensed and Evaporated Dairy Products Revenue (USD Million) By Type (2021-2032)
Table 27 South America Dry Condensed and Evaporated Dairy Products Revenue (USD Million) By Application (2021-2032)
Table 28 South America Dry Condensed and Evaporated Dairy Products Revenue (USD Million) By Product (2021-2032)
Table 29 Middle East and Africa Dry Condensed and Evaporated Dairy Products Revenue (USD Million) By Type (2021-2032)
Table 30 Middle East and Africa Dry Condensed and Evaporated Dairy Products Revenue (USD Million) By Application (2021-2032)
Table 31 Middle East and Africa Dry Condensed and Evaporated Dairy Products Revenue (USD Million) By Product (2021-2032)
LIST OF FIGURES
Figure 1. Market Scope
Figure 2. Pricing Forecasts Per Unit, 2023- 2032
Figure 3. Porter’s Five Forces
Figure 4. Global Dry Condensed and Evaporated Dairy Products Market Revenue (USD Million) By Regions (2021-2032)
Figure 5. Global Dry Condensed and Evaporated Dairy Products Market Share (%) By Regions (2023)
Figure 6. North America Dry Condensed and Evaporated Dairy Products Revenue (USD Million) By Country (2021-2032)
Figure 7. United States Dry Condensed and Evaporated Dairy Products Revenue (USD Million) By Country (2021-2032)
Figure 8. Canada Dry Condensed and Evaporated Dairy Products Revenue (USD Million) By Country (2021-2032)
Figure 9. Mexico Dry Condensed and Evaporated Dairy Products Revenue (USD Million) By Country (2021-2032)
Figure 10. Europe Dry Condensed and Evaporated Dairy Products Revenue (USD Million) By Country (2021-2032)
Figure 11. Germany Dry Condensed and Evaporated Dairy Products Revenue (USD Million) By Country (2021-2032)
Figure 12. France Dry Condensed and Evaporated Dairy Products Revenue (USD Million) By Country (2021-2032)
Figure 13. United Kingdom Dry Condensed and Evaporated Dairy Products Revenue (USD Million) By Country (2021-2032)
Figure 14. Spain Dry Condensed and Evaporated Dairy Products Revenue (USD Million) By Country (2021-2032)
Figure 15. Italy Dry Condensed and Evaporated Dairy Products Revenue (USD Million) By Country (2021-2032)
Figure 16. Russia Dry Condensed and Evaporated Dairy Products Revenue (USD Million) By Country (2021-2032)
Figure 17. Rest of Europe Dry Condensed and Evaporated Dairy Products Revenue (USD Million) By Country (2021-2032)
Figure 11. Asia Pacific Dry Condensed and Evaporated Dairy Products Revenue (USD Million) By Country (2021-2032)
Figure 12. China Dry Condensed and Evaporated Dairy Products Revenue (USD Million) By Country (2021-2032)
Figure 13. Japan Dry Condensed and Evaporated Dairy Products Revenue (USD Million) By Country (2021-2032)
Figure 14. India Dry Condensed and Evaporated Dairy Products Revenue (USD Million) By Country (2021-2032)
Figure 15. South Korea Dry Condensed and Evaporated Dairy Products Revenue (USD Million) By Country (2021-2032)
Figure 16. Australia Dry Condensed and Evaporated Dairy Products Revenue (USD Million) By Country (2021-2032)
Figure 17. South East Asia Dry Condensed and Evaporated Dairy Products Revenue (USD Million) By Country (2021-2032)
Figure 18. South America Dry Condensed and Evaporated Dairy Products Revenue (USD Million) By Country (2021-2032)
Figure 19. Brazil Dry Condensed and Evaporated Dairy Products Revenue (USD Million) By Country (2021-2032)
Figure 20. Argentina Dry Condensed and Evaporated Dairy Products Revenue (USD Million) By Country (2021-2032)
Figure 21. Rest of Asia Pacific Dry Condensed and Evaporated Dairy Products Revenue (USD Million) By Country (2021-2032)
Figure 22. Middle East and Africa Dry Condensed and Evaporated Dairy Products Revenue (USD Million) By Region (2021-2032)
Figure 23. Saudi Arabia Dry Condensed and Evaporated Dairy Products Revenue (USD Million) By Region (2021-2032)
Figure 24. The UAE Dry Condensed and Evaporated Dairy Products Revenue (USD Million) By Region (2021-2032)
Figure 25. Rest of Middle East Dry Condensed and Evaporated Dairy Products Revenue (USD Million) By Region (2021-2032)
Figure 26. South Africa Dry Condensed and Evaporated Dairy Products Revenue (USD Million) By Region (2021-2032)
Figure 27. Africa Dry Condensed and Evaporated Dairy Products Revenue (USD Million) By Region (2021-2032)
Figure 28. North America Dry Condensed and Evaporated Dairy Products Revenue (USD Million) By Type (2021-2032)
Figure 29. North America Dry Condensed and Evaporated Dairy Products Revenue (USD Million) By Application (2021-2032)
Figure 30. North America Dry Condensed and Evaporated Dairy Products Revenue (USD Million) By Product (2021-2032)
Figure 31. Europe Dry Condensed and Evaporated Dairy Products Revenue (USD Million) By Type (2021-2032)
Figure 32. Europe Dry Condensed and Evaporated Dairy Products Revenue (USD Million) By Application (2021-2032)
Figure 33. Europe Dry Condensed and Evaporated Dairy Products Revenue (USD Million) By Product (2021-2032)
Figure 34. Asia Pacific Dry Condensed and Evaporated Dairy Products Revenue (USD Million) By Type (2021-2032)
Figure 35. Asia Pacific Dry Condensed and Evaporated Dairy Products Revenue (USD Million) By Application (2021-2032)
Figure 36. Asia Pacific Dry Condensed and Evaporated Dairy Products Revenue (USD Million) By Product (2021-2032)
Figure 37. South America Dry Condensed and Evaporated Dairy Products Revenue (USD Million) By Type (2021-2032)
Figure 38. South America Dry Condensed and Evaporated Dairy Products Revenue (USD Million) By Application (2021-2032)
Figure 39. South America Dry Condensed and Evaporated Dairy Products Revenue (USD Million) By Product (2021-2032)
Figure 40. Middle East and Africa Dry Condensed and Evaporated Dairy Products Revenue (USD Million) By Type (2021-2032)
Figure 41. Middle East and Africa Dry Condensed and Evaporated Dairy Products Revenue (USD Million) By Application (2021-2032)
Figure 42. Middle East and Africa Dry Condensed and Evaporated Dairy Products Revenue (USD Million) By Product (2021-2032)
By Type
Dry Dairy Product
Condensed Dairy Product
Evaporated Dairy Product
By Distribution Channel
Supermarkets/Hypermarkets
Convenience Stores
E-Commerce
Others
By End-User
Food
Beverages
Intermediate Products
Condiments
Others
Countries Analyzed
North America (US, Canada, Mexico)
Europe (Germany, UK, France, Spain, Italy, Russia, Rest of Europe)
Asia Pacific (China, India, Japan, South Korea, Australia, South East Asia, Rest of Asia)
South America (Brazil, Argentina, Rest of South America)
Middle East and Africa (Saudi Arabia, UAE, Rest of Middle East, South Africa, Egypt, Rest of Africa)
