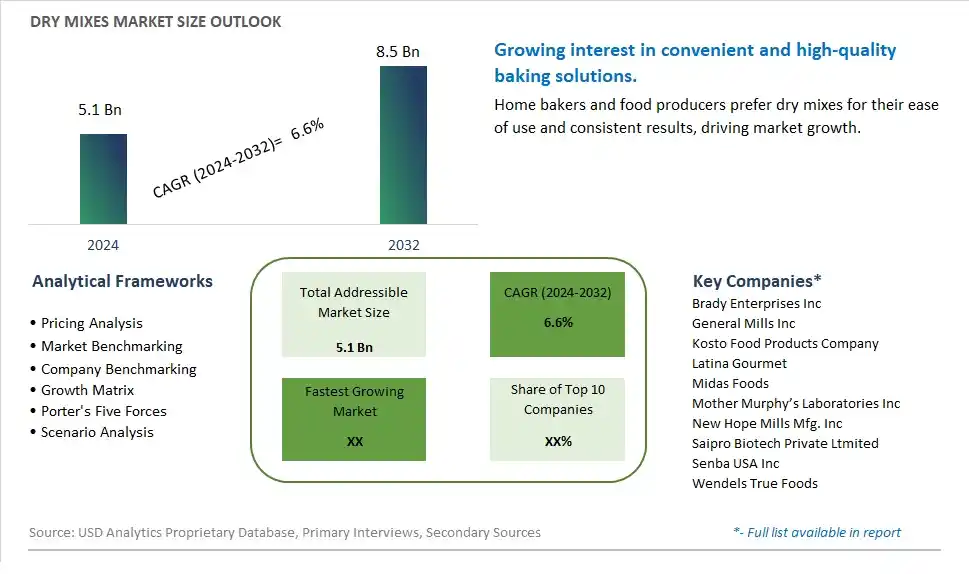
Global Dry Mixes Market Size is valued at $5.1 Billion in 2024 and is forecast to register a growth rate (CAGR) of 6.6% to reach $8.5 Billion by 2032.
The global Dry Mixes Market Comprehensive Study analyzes and forecasts the market size across 6 regions and 24 countries for diverse segments -By Product (Spices Mixes, Baking Mix, Curry Seasoning Mix, Others), By Type (Organic, Conventional), By End-User (Commercial, Residential), By Distribution Channel (Hypermarket/Supermarket, Convenience Stores, Departmental Stores, Specialty Stores, Online Sales Channels, Others)
An Introduction to Dry Mixes Market
In 2024, the Dry Mixes market is thriving, driven by the increasing demand for convenient and easy-to-prepare food solutions. Dry mixes, including baking mixes, soup mixes, and seasoning blends, are widely used in households and foodservice for their versatility and long shelf life. The market benefits from the rising trend of convenience foods, the growing demand for home cooking, and the expansion of product offerings and flavors. Additionally, advancements in packaging and formulation technologies are enhancing product quality and consumer appeal.
Dry Mixes Competitive Landscape
The market report analyses the leading companies in the industry including Brady Enterprises Inc, General Mills Inc , Kosto Food Products Company, Latina Gourmet, Midas Foods, Mother Murphy’s Laboratories Inc, New Hope Mills Mfg. Inc, Saipro Biotech Private Ltmited, Senba USA Inc, Wendels True Foods, and Others.
Dry Mixes Market Dynamics
Dry Mixes Market Trend: Increasing Demand for Convenient and Time-Saving Cooking Solutions
The dry mixes market is experiencing a significant trend towards convenient and time-saving cooking solutions. As consumers lead increasingly busy lifestyles, there is a growing preference for products that simplify meal preparation without compromising on quality and taste. Dry mixes, including baking mixes, soup mixes, and seasoning blends, cater to this demand by offering pre-measured, easy-to-use ingredients that reduce cooking time and effort. This trend is particularly strong among working professionals, students, and families who seek quick and convenient meal options that still allow them to enjoy home-cooked food. The rise of meal kits and DIY food solutions further supports the popularity of dry mixes.
Dry Mixes Market Driver: Rising Popularity of Home Cooking and Baking
A major driver for the dry mixes market is the rising popularity of home cooking and baking. As more people discover the joys and benefits of preparing meals at home, there is an increased demand for products that facilitate this activity. Dry mixes provide a reliable and consistent way to achieve delicious results, making them a favorite among both novice cooks and experienced chefs. The surge in home cooking, spurred by factors such as health consciousness, economic considerations, and the influence of cooking shows and social media, continues to drive the demand for a wide variety of dry mixes. Marketing efforts that highlight the ease of use and versatility of these products resonate well with consumers looking to enhance their culinary experiences.
Dry Mixes Market Opportunity: Innovation in Health-Focused and Specialty Products
The dry mixes market holds significant opportunities for innovation in health-focused and specialty products. Companies can tap into the growing health and wellness trend by developing dry mixes that cater to specific dietary needs, such as gluten-free, organic, low-sodium, and vegan options. Additionally, creating gourmet and artisanal dry mixes with unique flavor profiles can attract food enthusiasts and those seeking premium quality ingredients. Expanding distribution through e-commerce platforms and health food stores can increase product accessibility and reach a broader audience. Collaborations with nutritionists and chefs to develop and promote new dry mix products can further drive market growth and consumer engagement.
Dry Mixes Market Share Analysis: Spices Mixes segment generated the highest revenue share in the industry
The largest segment in the Dry Mixes Market is "Spices Mixes." Spices mixes encompass a wide variety of blends that cater to diverse culinary preferences, ranging from savory to sweet flavors. These mixes often include a combination of herbs, spices, and seasonings carefully curated to enhance the taste and aroma of dishes. The popularity of spices mixes stems from their convenience and ability to add depth and complexity to meals without the need for individual ingredient sourcing and preparation. Consumers appreciate the versatility of spices mixes, which can be used in marinades, rubs, sauces, and various cooking applications, making them a staple in both home kitchens and commercial food establishments.
Dry Mixes Market Share Analysis: Online Sales Channel is the fastest growing segment over the forecast period to 2032
The fastest-growing segment in the Dry Mixes Market is "Online Sales Channels." The rapid growth of e-commerce platforms and online retailing has revolutionized the way consumers purchase dry mixes. Online sales channels offer unparalleled convenience, a vast array of product options, competitive pricing, and doorstep delivery, making them highly attractive to modern consumers. The shift towards digital shopping experiences, especially in the wake of the Past few years, has accelerated the growth of online sales channels for dry mixes. Further, online platforms provide opportunities for manufacturers and retailers to reach a global audience, expand market presence, and engage in targeted marketing strategies, driving the robust growth of this segment in the dry mixes market until 2032.
Dry Mixes Market Share Analysis: Commercial is the fastest growing segment over the forecast period to 2032
The "Commercial" segment stands out as a significant category within the Dry Mixes Market. Commercial establishments, including restaurants, cafes, hotels, catering services, and foodservice providers, are major consumers of dry mixes. These businesses rely on dry mixes for their convenience, consistency in flavor profiles, time-saving benefits, and cost-effectiveness in food preparation. The commercial sector's demand for dry mixes is driven by the need to maintain quality standards, streamline kitchen operations, and meet the diverse taste preferences of customers. As the foodservice industry continues to expand globally, particularly in emerging markets, the commercial segment remains pivotal in driving the overall growth of the dry mixes market.
Dry Mixes Market Share Analysis: Organic is the fastest growing segment over the forecast period to 2032
The fastest-growing segment in the Dry Mixes Market is "Organic" dry mixes. With increasing consumer awareness of health and environmental sustainability, there has been a notable shift towards organic food products, including dry mixes. Organic dry mixes are free from synthetic pesticides, fertilizers, genetically modified organisms (GMOs), and artificial additives, appealing to health-conscious consumers seeking natural and wholesome ingredients. The organic segment's growth is propelled by rising concerns about food safety, nutritional value, and ethical sourcing practices. Manufacturers are responding to this trend by offering a wide range of organic dry mixes that cater to various dietary preferences, such as gluten-free, vegan, and non-GMO options. This emphasis on organic offerings is expected to drive substantial growth in the dry mixes market, especially among health-conscious and environmentally conscious consumers.
Dry Mixes Market Segmentation
By Product
Spices Mixes
Baking Mix
Curry Seasoning Mix
Others
By Type
Organic
Conventional
By End-User
Commercial
Residential
By Distribution Channel
Hypermarket/Supermarket
Convenience Stores
Departmental Stores
Specialty Stores
Online Sales Channels
Others
Countries Analyzed
North America (US, Canada, Mexico)
Europe (Germany, UK, France, Spain, Italy, Russia, Rest of Europe)
Asia Pacific (China, India, Japan, South Korea, Australia, South East Asia, Rest of Asia)
South America (Brazil, Argentina, Rest of South America)
Middle East and Africa (Saudi Arabia, UAE, Rest of Middle East, South Africa, Egypt, Rest of Africa)
Dry Mixes Companies Profiled in the Study
Brady Enterprises Inc
General Mills Inc
Kosto Food Products Company
Latina Gourmet
Midas Foods
Mother Murphy’s Laboratories Inc
New Hope Mills Mfg. Inc
Saipro Biotech Private Ltmited
Senba USA Inc
Wendels True Foods
*- List Not Exhaustive
Chapter 1. TABLE OF CONTENTS
Chapter 2. Introduction to Dry Mixes Market
2.1. Market Overview
2.2. Key Statistics and Report Highlights
2.3. Scope of the Comprehensive Study
2.3.1. Market Definition
2.3.2 Countries and Regions Covered
2.3.3 Research Objective
2.3.4 Units, Currency, and Conversions
2.3.5 Industry Value Chain
2.4. Key Market Segments
2.5. Key Companies
2.6. Study Period
Chapter 3. Strategic Analysis Review
3.1. Dry Mixes Pricing Analysis and Forecast
3.2. Porter’s Five Forces
3.3. Market Ecosystem
3.4. SWOT Analysis
3.5. Regulatory Scenario
3.3. Effects of Inflation, Russia-Ukraine War, moderating economic growth, and other macroeconomic factors
Chapter 4. Competitive Landscape
4.1. Market Share Analysis
4.1.1. Global Dry Mixes Market Share by Company, 2023
4.1.2. Product Offerings of Leading Dry Mixes Companies
4.2. Market Entropy
4.2.1. New Product Launches in the Industry
4.2.2. Mergers, Acquisitions, Joint ventures, and Partnerships
4.3. Key Strategies and Best Practices
Chapter 5. Global Market Projections: Best, Reference, and Low Case Scenarios
5.1. Growth Analysis- Case Scenario Definitions
5.2. Low Growth Case Scenario Forecasts
5.3. Reference Growth Case Scenario Forecasts
5.4. High Growth Case Scenario Forecasts
Chapter 6. Market Dynamics
6.1. Dry Mixes Market Drivers
6.2. Dry Mixes Market Challenges
6.6. Dry Mixes Market Opportunities
6.4. Dry Mixes Market Trends
Chapter 7. Global Dry Mixes Market Outlook Trends
7.1. Global Dry Mixes Revenue (USD Million) and CAGR (%) by Type (2021-2032)
7.2. Global Dry Mixes Revenue (USD Million) and CAGR (%) by Application (2021-2032)
7.3. Global Dry Mixes Revenue (USD Million) and CAGR (%) by Product (2021-2032)
By Product
Spices Mixes
Baking Mix
Curry Seasoning Mix
Others
By Type
Organic
Conventional
By End-User
Commercial
Residential
By Distribution Channel
Hypermarket/Supermarket
Convenience Stores
Departmental Stores
Specialty Stores
Online Sales Channels
Others
Chapter 8. Global Dry Mixes Regional Analysis and Outlook
8.1. Global Dry Mixes Revenue (USD Million) By Regions (2021- 2032)
8.2. North America Dry Mixes Revenue (USD Million) by Country (2021-2032)
8.2.1. United States Dry Mixes Regional Analysis and Outlook
8.2.2. Canada Dry Mixes Regional Analysis and Outlook
8.2.3. Mexico Dry Mixes Regional Analysis and Outlook
8.3. Europe Dry Mixes Revenue (USD Million), by Country (2021-2032)
8.3.1. Germany Dry Mixes Regional Analysis and Outlook
8.3.2. France Dry Mixes Regional Analysis and Outlook
8.3.3. United Kingdom Dry Mixes Regional Analysis and Outlook
8.3.4. Spain Dry Mixes Regional Analysis and Outlook
8.3.5. Italy Dry Mixes Regional Analysis and Outlook
8.3.6. Russia Dry Mixes Regional Analysis and Outlook
8.3.7. Rest of Europe Dry Mixes Regional Analysis and Outlook
8.4. Asia Pacific Dry Mixes Revenue (USD Million) by Country (2021-2032)
8.4.1. China Dry Mixes Regional Analysis and Outlook
8.4.2. Japan Dry Mixes Regional Analysis and Outlook
8.4.3. India Dry Mixes Regional Analysis and Outlook
8.4.4. South Korea Dry Mixes Regional Analysis and Outlook
8.4.5. Australia Dry Mixes Regional Analysis and Outlook
8.4.6. South East Asia Dry Mixes Regional Analysis and Outlook
8.4.7. Rest of Asia Pacific Dry Mixes Regional Analysis and Outlook
8.5. South America Dry Mixes Revenue (USD Million), by Country (2021-2032)
8.5.1. Brazil Dry Mixes Regional Analysis and Outlook
8.5.2. Argentina Dry Mixes Regional Analysis and Outlook
8.5.3. Rest of South America Dry Mixes Regional Analysis and Outlook
8.6. Middle East and Africa Dry Mixes Revenue (USD Million) by Country (2021-2032)
8.6.1. Middle East Dry Mixes Regional Analysis and Outlook
8.6.2. Africa Dry Mixes Regional Analysis and Outlook
Chapter 9. North America Dry Mixes Analysis and Outlook
9.1. North America Dry Mixes Revenue (USD Million) by Segments (2021-2032)
9.1.1. North America Dry Mixes Revenue (USD Million) by Type (2021-2032)
9.1.2. North America Dry Mixes Revenue (USD Million) by Application (2021-2032)
9.1.3. North America Dry Mixes Revenue (USD Million) by Product (2021-2032)
By Product
Spices Mixes
Baking Mix
Curry Seasoning Mix
Others
By Type
Organic
Conventional
By End-User
Commercial
Residential
By Distribution Channel
Hypermarket/Supermarket
Convenience Stores
Departmental Stores
Specialty Stores
Online Sales Channels
Others
Chapter 10. Europe Dry Mixes Analysis and Outlook
10.1. Europe Dry Mixes Revenue (USD Million), by Segments (USD Million) (2021-2032)
10.1.1. Europe Dry Mixes Revenue (USD Million) by Type (2021-2032)
10.1.2. Europe Dry Mixes Revenue (USD Million) by Application (2021-2032)
10.1.3. Europe Dry Mixes Revenue (USD Million) by Product (2021-2032)
By Product
Spices Mixes
Baking Mix
Curry Seasoning Mix
Others
By Type
Organic
Conventional
By End-User
Commercial
Residential
By Distribution Channel
Hypermarket/Supermarket
Convenience Stores
Departmental Stores
Specialty Stores
Online Sales Channels
Others
Chapter 11. Asia Pacific Dry Mixes Analysis and Outlook
11.1. Asia Pacific Dry Mixes Revenue (USD Million), and Revenue (USD Million) by Segments (2021-2032)
11.1.1. Asia Pacific Dry Mixes Revenue (USD Million) by Type (2021-2032)
11.1.2. Asia Pacific Dry Mixes Revenue (USD Million) by Application (2021-2032)
11.1.3. Asia Pacific Dry Mixes Revenue (USD Million) by Product (2021-2032)
By Product
Spices Mixes
Baking Mix
Curry Seasoning Mix
Others
By Type
Organic
Conventional
By End-User
Commercial
Residential
By Distribution Channel
Hypermarket/Supermarket
Convenience Stores
Departmental Stores
Specialty Stores
Online Sales Channels
Others
Chapter 12. South America Dry Mixes Analysis and Outlook
12.1. South America Dry Mixes Revenue (USD Million), by Segments (2021-2032)
12.1.1. South America Dry Mixes Revenue (USD Million) by Type (2021-2032)
12.1.2. South America Dry Mixes Revenue (USD Million) by Application (2021-2032)
12.1.3. South America Dry Mixes Revenue (USD Million) by Product (2021-2032)
By Product
Spices Mixes
Baking Mix
Curry Seasoning Mix
Others
By Type
Organic
Conventional
By End-User
Commercial
Residential
By Distribution Channel
Hypermarket/Supermarket
Convenience Stores
Departmental Stores
Specialty Stores
Online Sales Channels
Others
Chapter 13. Middle East and Africa Dry Mixes Analysis and Outlook
13.1. Middle East and Africa Dry Mixes Revenue (USD Million), by Segments (2021-2032)
13.1.1. Middle East and Africa Dry Mixes Revenue (USD Million) by Type (2021-2032)
13.1.2. Middle East and Africa Dry Mixes Revenue (USD Million) by Application (2021-2032)
13.1.3. Middle East and Africa Dry Mixes Revenue (USD Million) by Product (2021-2032)
By Product
Spices Mixes
Baking Mix
Curry Seasoning Mix
Others
By Type
Organic
Conventional
By End-User
Commercial
Residential
By Distribution Channel
Hypermarket/Supermarket
Convenience Stores
Departmental Stores
Specialty Stores
Online Sales Channels
Others
Chapter 14. Dry Mixes Company Profiles
14.1 Business Overview
14.2 Product Profiles
14.3 SWOT Profiles
14.5 Recent Developments
14.6 Financial Profile
List of Companies
Brady Enterprises Inc
General Mills Inc
Kosto Food Products Company
Latina Gourmet
Midas Foods
Mother Murphy’s Laboratories Inc
New Hope Mills Mfg. Inc
Saipro Biotech Private Ltmited
Senba USA Inc
Wendels True Foods
15. Methodology and Data Sources
15.1 Customization Offerings
15.2 Subscription Services
15.3 Related Reports
15.4 Publisher Expertise
LIST OF TABLES
Table 1 Market Segmentation Analysis
Table 2 Global Dry Mixes Market Share of Leading Companies, 2023
Table 3 Product Offerings of Leading Companies
Table 4 Low Growth Scenario Forecasts
Table 5 Reference Case Growth Scenario
Table 6 High Growth Case Scenario
Table 7 Global Dry Mixes Revenue (USD Million) And CAGR (%) By Type (2021-2032)
Table 8 Global Dry Mixes Revenue (USD Million) And CAGR (%) By Application (2021-2032)
Table 9 Global Dry Mixes Revenue (USD Million) And CAGR (%) By Product (2021-2032)
Table 10 Global Dry Mixes Market Revenue (USD Million) By Regions (2021-2032)
Table 11 Global Dry Mixes Market Share (%) By Regions (2021-2032)
Table 12 North America Dry Mixes Revenue (USD Million) By Country (2021-2032)
Table 13 Europe Dry Mixes Revenue (USD Million) By Country (2021-2032)
Table 14 Asia Pacific Dry Mixes Revenue (USD Million) By Country (2021-2032)
Table 15 South America Dry Mixes Revenue (USD Million) By Country (2021-2032)
Table 16 Middle East and Africa Dry Mixes Revenue (USD Million) By Region (2021-2032)
Table 17 North America Dry Mixes Revenue (USD Million) By Type (2021-2032)
Table 18 North America Dry Mixes Revenue (USD Million) By Application (2021-2032)
Table 19 North America Dry Mixes Revenue (USD Million) By Product (2021-2032)
Table 20 Europe Dry Mixes Revenue (USD Million) By Type (2021-2032)
Table 21 Europe Dry Mixes Revenue (USD Million) By Application (2021-2032)
Table 22 Europe Dry Mixes Revenue (USD Million) By Product (2021-2032)
Table 23 Asia Pacific Dry Mixes Revenue (USD Million) By Type (2021-2032)
Table 24 Asia Pacific Dry Mixes Revenue (USD Million) By Application (2021-2032)
Table 25 Asia Pacific Dry Mixes Revenue (USD Million) By Product (2021-2032)
Table 26 South America Dry Mixes Revenue (USD Million) By Type (2021-2032)
Table 27 South America Dry Mixes Revenue (USD Million) By Application (2021-2032)
Table 28 South America Dry Mixes Revenue (USD Million) By Product (2021-2032)
Table 29 Middle East and Africa Dry Mixes Revenue (USD Million) By Type (2021-2032)
Table 30 Middle East and Africa Dry Mixes Revenue (USD Million) By Application (2021-2032)
Table 31 Middle East and Africa Dry Mixes Revenue (USD Million) By Product (2021-2032)
LIST OF FIGURES
Figure 1. Market Scope
Figure 2. Pricing Forecasts Per Unit, 2023- 2032
Figure 3. Porter’s Five Forces
Figure 4. Global Dry Mixes Market Revenue (USD Million) By Regions (2021-2032)
Figure 5. Global Dry Mixes Market Share (%) By Regions (2023)
Figure 6. North America Dry Mixes Revenue (USD Million) By Country (2021-2032)
Figure 7. United States Dry Mixes Revenue (USD Million) By Country (2021-2032)
Figure 8. Canada Dry Mixes Revenue (USD Million) By Country (2021-2032)
Figure 9. Mexico Dry Mixes Revenue (USD Million) By Country (2021-2032)
Figure 10. Europe Dry Mixes Revenue (USD Million) By Country (2021-2032)
Figure 11. Germany Dry Mixes Revenue (USD Million) By Country (2021-2032)
Figure 12. France Dry Mixes Revenue (USD Million) By Country (2021-2032)
Figure 13. United Kingdom Dry Mixes Revenue (USD Million) By Country (2021-2032)
Figure 14. Spain Dry Mixes Revenue (USD Million) By Country (2021-2032)
Figure 15. Italy Dry Mixes Revenue (USD Million) By Country (2021-2032)
Figure 16. Russia Dry Mixes Revenue (USD Million) By Country (2021-2032)
Figure 17. Rest of Europe Dry Mixes Revenue (USD Million) By Country (2021-2032)
Figure 11. Asia Pacific Dry Mixes Revenue (USD Million) By Country (2021-2032)
Figure 12. China Dry Mixes Revenue (USD Million) By Country (2021-2032)
Figure 13. Japan Dry Mixes Revenue (USD Million) By Country (2021-2032)
Figure 14. India Dry Mixes Revenue (USD Million) By Country (2021-2032)
Figure 15. South Korea Dry Mixes Revenue (USD Million) By Country (2021-2032)
Figure 16. Australia Dry Mixes Revenue (USD Million) By Country (2021-2032)
Figure 17. South East Asia Dry Mixes Revenue (USD Million) By Country (2021-2032)
Figure 18. South America Dry Mixes Revenue (USD Million) By Country (2021-2032)
Figure 19. Brazil Dry Mixes Revenue (USD Million) By Country (2021-2032)
Figure 20. Argentina Dry Mixes Revenue (USD Million) By Country (2021-2032)
Figure 21. Rest of Asia Pacific Dry Mixes Revenue (USD Million) By Country (2021-2032)
Figure 22. Middle East and Africa Dry Mixes Revenue (USD Million) By Region (2021-2032)
Figure 23. Saudi Arabia Dry Mixes Revenue (USD Million) By Region (2021-2032)
Figure 24. The UAE Dry Mixes Revenue (USD Million) By Region (2021-2032)
Figure 25. Rest of Middle East Dry Mixes Revenue (USD Million) By Region (2021-2032)
Figure 26. South Africa Dry Mixes Revenue (USD Million) By Region (2021-2032)
Figure 27. Africa Dry Mixes Revenue (USD Million) By Region (2021-2032)
Figure 28. North America Dry Mixes Revenue (USD Million) By Type (2021-2032)
Figure 29. North America Dry Mixes Revenue (USD Million) By Application (2021-2032)
Figure 30. North America Dry Mixes Revenue (USD Million) By Product (2021-2032)
Figure 31. Europe Dry Mixes Revenue (USD Million) By Type (2021-2032)
Figure 32. Europe Dry Mixes Revenue (USD Million) By Application (2021-2032)
Figure 33. Europe Dry Mixes Revenue (USD Million) By Product (2021-2032)
Figure 34. Asia Pacific Dry Mixes Revenue (USD Million) By Type (2021-2032)
Figure 35. Asia Pacific Dry Mixes Revenue (USD Million) By Application (2021-2032)
Figure 36. Asia Pacific Dry Mixes Revenue (USD Million) By Product (2021-2032)
Figure 37. South America Dry Mixes Revenue (USD Million) By Type (2021-2032)
Figure 38. South America Dry Mixes Revenue (USD Million) By Application (2021-2032)
Figure 39. South America Dry Mixes Revenue (USD Million) By Product (2021-2032)
Figure 40. Middle East and Africa Dry Mixes Revenue (USD Million) By Type (2021-2032)
Figure 41. Middle East and Africa Dry Mixes Revenue (USD Million) By Application (2021-2032)
Figure 42. Middle East and Africa Dry Mixes Revenue (USD Million) By Product (2021-2032)
By Product
Spices Mixes
Baking Mix
Curry Seasoning Mix
Others
By Type
Organic
Conventional
By End-User
Commercial
Residential
By Distribution Channel
Hypermarket/Supermarket
Convenience Stores
Departmental Stores
Specialty Stores
Online Sales Channels
Others
Countries Analyzed
North America (US, Canada, Mexico)
Europe (Germany, UK, France, Spain, Italy, Russia, Rest of Europe)
Asia Pacific (China, India, Japan, South Korea, Australia, South East Asia, Rest of Asia)
South America (Brazil, Argentina, Rest of South America)
Middle East and Africa (Saudi Arabia, UAE, Rest of Middle East, South Africa, Egypt, Rest of Africa)
