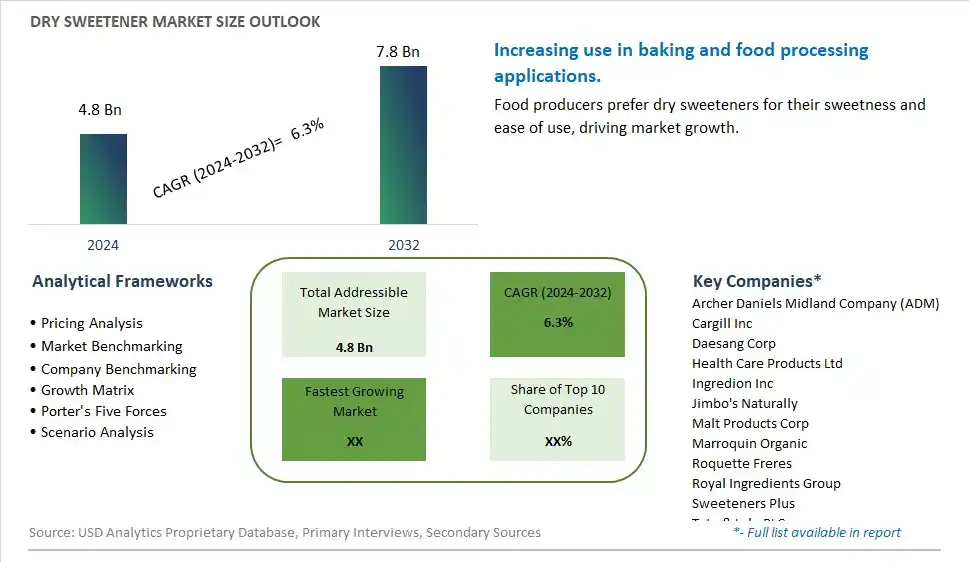
Global Dry Sweetener Market Size is valued at $4.8 Billion in 2024 and is forecast to register a growth rate (CAGR) of 6.3% to reach $7.8 Billion by 2032.
The global Dry Sweetener Market Comprehensive Study analyzes and forecasts the market size across 6 regions and 24 countries for diverse segments -By Product (Malt, Raisins, Dry honey, Fruit sugars, Molasses, Others), By Application (Confectionery, Bakery, Dairy), By Form (Powder, Crystal, Flakes)
An Introduction to Dry Sweetener Market
In 2024, the Dry Sweetener market is witnessing significant growth, driven by the increasing demand for natural and low-calorie sugar alternatives. Dry sweeteners, including stevia, monk fruit, and erythritol, are popular in the food and beverage industry for their versatility and health benefits. The market benefits from the rising trend of health-conscious eating, the growing demand for sugar reduction in food products, and the expansion of clean label and natural ingredients. Additionally, advancements in extraction and formulation technologies are enhancing product quality and taste.
Dry Sweetener Competitive Landscape
The market report analyses the leading companies in the industry including Archer Daniels Midland Company (ADM), Cargill Inc, Daesang Corp, Health Care Products Ltd, Ingredion Inc, Jimbo's Naturally, Malt Products Corp, Marroquin Organic, Roquette Freres, Royal Ingredients Group, Sweeteners Plus, Tate & Lyle PLC, Tereos Starch & Sweeteners s.a.s., and Others.
Dry Sweetener Market Dynamics
Dry Sweetener Market Trend: Rising Popularity of Natural and Low-Calorie Sweeteners
The dry sweetener market is experiencing a significant trend towards natural and low-calorie sweeteners. As consumers become more health-conscious and aware of the negative effects of excessive sugar consumption, there is a growing preference for alternatives that provide sweetness without the high calorie count. Natural sweeteners like stevia, monk fruit, and erythritol are gaining popularity due to their perceived health benefits and natural origins. This trend is further supported by the increasing demand for clean-label products, where consumers seek out ingredients that are minimally processed and free from artificial additives. The shift towards healthier eating habits continues to drive the growth of natural and low-calorie dry sweeteners.
Dry Sweetener Market Driver: Increasing Incidence of Lifestyle-Related Health Issues
A major driver for the dry sweetener market is the increasing incidence of lifestyle-related health issues such as obesity, diabetes, and cardiovascular diseases. As these health concerns become more prevalent, consumers are actively seeking ways to reduce their sugar intake and manage their weight and blood sugar levels. Dry sweeteners, which offer the sweetness of sugar without the associated health risks, are seen as a viable solution. Public health campaigns and initiatives that promote sugar reduction also contribute to the rising demand for alternative sweeteners. The growing awareness of the link between diet and health drives consumers to adopt healthier sweetening options in their daily diets.
Dry Sweetener Market Opportunity: Innovation in Product Formulation and Application
The dry sweetener market holds significant opportunities for innovation in product formulation and application. Companies can develop new sweetener blends that cater to specific dietary needs and preferences, such as keto-friendly, vegan, and organic options. There is also potential for creating sweeteners with enhanced functional properties, such as those fortified with vitamins or designed to improve gut health. Expanding the use of dry sweeteners in various food and beverage applications, including baking mixes, snack bars, and beverages, can attract a broader consumer base. Collaborations with food manufacturers to develop innovative products and leveraging digital marketing to educate consumers about the benefits and uses of dry sweeteners can further drive market growth and consumer engagement.
Dry Sweetener Market Share Analysis: Fruit Sugars segment generated the highest revenue share in the industry
The largest segment in the Dry Sweetener Market based on product type is "Fruit Sugars." Fruit sugars, derived from various fruits such as apples, grapes, and dates, are natural sweeteners known for their pleasant taste, nutritional benefits, and versatility in culinary applications. They are often used as alternatives to refined sugars and artificial sweeteners due to their perceived health benefits and natural origin. Fruit sugars find extensive use in the food and beverage industry, especially in products like juices, jams, desserts, and snacks. The growing consumer preference for natural and healthier sweetening options has significantly contributed to the dominance of fruit sugars in the dry sweetener market.
Dry Sweetener Market Share Analysis: Confectionery is the fastest growing segment over the forecast period to 2032
The fastest-growing segment in the Dry Sweetener Market based on application is "Confectionery." The confectionery industry, which includes products like candies, chocolates, and sweets, is experiencing rapid growth driven by factors such as increasing disposable incomes, changing consumer lifestyles, and the rising demand for indulgent and innovative sweet treats. Dry sweeteners, including fruit sugars and other natural alternatives, are being extensively used in confectionery formulations to cater to health-conscious consumers seeking reduced-sugar or sugar-free options without compromising on taste. The use of dry sweeteners in confectionery applications enables manufacturers to offer a wider range of products that appeal to health-conscious and discerning consumers, thereby fueling the growth of the segment in the dry sweetener market.
Dry Sweetener Market Segmentation
By Product
Malt
Raisins
Dry honey
Fruit sugars
Molasses
Others
By Application
Confectionery
Bakery
Dairy
By Form
Powder
Crystal
Flakes
Countries Analyzed
North America (US, Canada, Mexico)
Europe (Germany, UK, France, Spain, Italy, Russia, Rest of Europe)
Asia Pacific (China, India, Japan, South Korea, Australia, South East Asia, Rest of Asia)
South America (Brazil, Argentina, Rest of South America)
Middle East and Africa (Saudi Arabia, UAE, Rest of Middle East, South Africa, Egypt, Rest of Africa)
Dry Sweetener Companies Profiled in the Study
Archer Daniels Midland Company (ADM)
Cargill Inc
Daesang Corp
Health Care Products Ltd
Ingredion Inc
Jimbo's Naturally
Malt Products Corp
Marroquin Organic
Roquette Freres
Royal Ingredients Group
Sweeteners Plus
Tate & Lyle PLC
Tereos Starch & Sweeteners s.a.s.
*- List Not Exhaustive
Chapter 1. TABLE OF CONTENTS
Chapter 2. Introduction to Dry Sweetener Market
2.1. Market Overview
2.2. Key Statistics and Report Highlights
2.3. Scope of the Comprehensive Study
2.3.1. Market Definition
2.3.2 Countries and Regions Covered
2.3.3 Research Objective
2.3.4 Units, Currency, and Conversions
2.3.5 Industry Value Chain
2.4. Key Market Segments
2.5. Key Companies
2.6. Study Period
Chapter 3. Strategic Analysis Review
3.1. Dry Sweetener Pricing Analysis and Forecast
3.2. Porter’s Five Forces
3.3. Market Ecosystem
3.4. SWOT Analysis
3.5. Regulatory Scenario
3.3. Effects of Inflation, Russia-Ukraine War, moderating economic growth, and other macroeconomic factors
Chapter 4. Competitive Landscape
4.1. Market Share Analysis
4.1.1. Global Dry Sweetener Market Share by Company, 2023
4.1.2. Product Offerings of Leading Dry Sweetener Companies
4.2. Market Entropy
4.2.1. New Product Launches in the Industry
4.2.2. Mergers, Acquisitions, Joint ventures, and Partnerships
4.3. Key Strategies and Best Practices
Chapter 5. Global Market Projections: Best, Reference, and Low Case Scenarios
5.1. Growth Analysis- Case Scenario Definitions
5.2. Low Growth Case Scenario Forecasts
5.3. Reference Growth Case Scenario Forecasts
5.4. High Growth Case Scenario Forecasts
Chapter 6. Market Dynamics
6.1. Dry Sweetener Market Drivers
6.2. Dry Sweetener Market Challenges
6.6. Dry Sweetener Market Opportunities
6.4. Dry Sweetener Market Trends
Chapter 7. Global Dry Sweetener Market Outlook Trends
7.1. Global Dry Sweetener Revenue (USD Million) and CAGR (%) by Type (2021-2032)
7.2. Global Dry Sweetener Revenue (USD Million) and CAGR (%) by Application (2021-2032)
7.3. Global Dry Sweetener Revenue (USD Million) and CAGR (%) by Product (2021-2032)
By Product
Malt
Raisins
Dry honey
Fruit sugars
Molasses
Others
By Application
Confectionery
Bakery
Dairy
By Form
Powder
Crystal
Flakes
Chapter 8. Global Dry Sweetener Regional Analysis and Outlook
8.1. Global Dry Sweetener Revenue (USD Million) By Regions (2021- 2032)
8.2. North America Dry Sweetener Revenue (USD Million) by Country (2021-2032)
8.2.1. United States Dry Sweetener Regional Analysis and Outlook
8.2.2. Canada Dry Sweetener Regional Analysis and Outlook
8.2.3. Mexico Dry Sweetener Regional Analysis and Outlook
8.3. Europe Dry Sweetener Revenue (USD Million), by Country (2021-2032)
8.3.1. Germany Dry Sweetener Regional Analysis and Outlook
8.3.2. France Dry Sweetener Regional Analysis and Outlook
8.3.3. United Kingdom Dry Sweetener Regional Analysis and Outlook
8.3.4. Spain Dry Sweetener Regional Analysis and Outlook
8.3.5. Italy Dry Sweetener Regional Analysis and Outlook
8.3.6. Russia Dry Sweetener Regional Analysis and Outlook
8.3.7. Rest of Europe Dry Sweetener Regional Analysis and Outlook
8.4. Asia Pacific Dry Sweetener Revenue (USD Million) by Country (2021-2032)
8.4.1. China Dry Sweetener Regional Analysis and Outlook
8.4.2. Japan Dry Sweetener Regional Analysis and Outlook
8.4.3. India Dry Sweetener Regional Analysis and Outlook
8.4.4. South Korea Dry Sweetener Regional Analysis and Outlook
8.4.5. Australia Dry Sweetener Regional Analysis and Outlook
8.4.6. South East Asia Dry Sweetener Regional Analysis and Outlook
8.4.7. Rest of Asia Pacific Dry Sweetener Regional Analysis and Outlook
8.5. South America Dry Sweetener Revenue (USD Million), by Country (2021-2032)
8.5.1. Brazil Dry Sweetener Regional Analysis and Outlook
8.5.2. Argentina Dry Sweetener Regional Analysis and Outlook
8.5.3. Rest of South America Dry Sweetener Regional Analysis and Outlook
8.6. Middle East and Africa Dry Sweetener Revenue (USD Million) by Country (2021-2032)
8.6.1. Middle East Dry Sweetener Regional Analysis and Outlook
8.6.2. Africa Dry Sweetener Regional Analysis and Outlook
Chapter 9. North America Dry Sweetener Analysis and Outlook
9.1. North America Dry Sweetener Revenue (USD Million) by Segments (2021-2032)
9.1.1. North America Dry Sweetener Revenue (USD Million) by Type (2021-2032)
9.1.2. North America Dry Sweetener Revenue (USD Million) by Application (2021-2032)
9.1.3. North America Dry Sweetener Revenue (USD Million) by Product (2021-2032)
By Product
Malt
Raisins
Dry honey
Fruit sugars
Molasses
Others
By Application
Confectionery
Bakery
Dairy
By Form
Powder
Crystal
Flakes
Chapter 10. Europe Dry Sweetener Analysis and Outlook
10.1. Europe Dry Sweetener Revenue (USD Million), by Segments (USD Million) (2021-2032)
10.1.1. Europe Dry Sweetener Revenue (USD Million) by Type (2021-2032)
10.1.2. Europe Dry Sweetener Revenue (USD Million) by Application (2021-2032)
10.1.3. Europe Dry Sweetener Revenue (USD Million) by Product (2021-2032)
By Product
Malt
Raisins
Dry honey
Fruit sugars
Molasses
Others
By Application
Confectionery
Bakery
Dairy
By Form
Powder
Crystal
Flakes
Chapter 11. Asia Pacific Dry Sweetener Analysis and Outlook
11.1. Asia Pacific Dry Sweetener Revenue (USD Million), and Revenue (USD Million) by Segments (2021-2032)
11.1.1. Asia Pacific Dry Sweetener Revenue (USD Million) by Type (2021-2032)
11.1.2. Asia Pacific Dry Sweetener Revenue (USD Million) by Application (2021-2032)
11.1.3. Asia Pacific Dry Sweetener Revenue (USD Million) by Product (2021-2032)
By Product
Malt
Raisins
Dry honey
Fruit sugars
Molasses
Others
By Application
Confectionery
Bakery
Dairy
By Form
Powder
Crystal
Flakes
Chapter 12. South America Dry Sweetener Analysis and Outlook
12.1. South America Dry Sweetener Revenue (USD Million), by Segments (2021-2032)
12.1.1. South America Dry Sweetener Revenue (USD Million) by Type (2021-2032)
12.1.2. South America Dry Sweetener Revenue (USD Million) by Application (2021-2032)
12.1.3. South America Dry Sweetener Revenue (USD Million) by Product (2021-2032)
By Product
Malt
Raisins
Dry honey
Fruit sugars
Molasses
Others
By Application
Confectionery
Bakery
Dairy
By Form
Powder
Crystal
Flakes
Chapter 13. Middle East and Africa Dry Sweetener Analysis and Outlook
13.1. Middle East and Africa Dry Sweetener Revenue (USD Million), by Segments (2021-2032)
13.1.1. Middle East and Africa Dry Sweetener Revenue (USD Million) by Type (2021-2032)
13.1.2. Middle East and Africa Dry Sweetener Revenue (USD Million) by Application (2021-2032)
13.1.3. Middle East and Africa Dry Sweetener Revenue (USD Million) by Product (2021-2032)
By Product
Malt
Raisins
Dry honey
Fruit sugars
Molasses
Others
By Application
Confectionery
Bakery
Dairy
By Form
Powder
Crystal
Flakes
Chapter 14. Dry Sweetener Company Profiles
14.1 Business Overview
14.2 Product Profiles
14.3 SWOT Profiles
14.5 Recent Developments
14.6 Financial Profile
List of Companies
Archer Daniels Midland Company (ADM)
Cargill Inc
Daesang Corp
Health Care Products Ltd
Ingredion Inc
Jimbo's Naturally
Malt Products Corp
Marroquin Organic
Roquette Freres
Royal Ingredients Group
Sweeteners Plus
Tate & Lyle PLC
Tereos Starch & Sweeteners s.a.s.
15. Methodology and Data Sources
15.1 Customization Offerings
15.2 Subscription Services
15.3 Related Reports
15.4 Publisher Expertise
LIST OF TABLES
Table 1 Market Segmentation Analysis
Table 2 Global Dry Sweetener Market Share of Leading Companies, 2023
Table 3 Product Offerings of Leading Companies
Table 4 Low Growth Scenario Forecasts
Table 5 Reference Case Growth Scenario
Table 6 High Growth Case Scenario
Table 7 Global Dry Sweetener Revenue (USD Million) And CAGR (%) By Type (2021-2032)
Table 8 Global Dry Sweetener Revenue (USD Million) And CAGR (%) By Application (2021-2032)
Table 9 Global Dry Sweetener Revenue (USD Million) And CAGR (%) By Product (2021-2032)
Table 10 Global Dry Sweetener Market Revenue (USD Million) By Regions (2021-2032)
Table 11 Global Dry Sweetener Market Share (%) By Regions (2021-2032)
Table 12 North America Dry Sweetener Revenue (USD Million) By Country (2021-2032)
Table 13 Europe Dry Sweetener Revenue (USD Million) By Country (2021-2032)
Table 14 Asia Pacific Dry Sweetener Revenue (USD Million) By Country (2021-2032)
Table 15 South America Dry Sweetener Revenue (USD Million) By Country (2021-2032)
Table 16 Middle East and Africa Dry Sweetener Revenue (USD Million) By Region (2021-2032)
Table 17 North America Dry Sweetener Revenue (USD Million) By Type (2021-2032)
Table 18 North America Dry Sweetener Revenue (USD Million) By Application (2021-2032)
Table 19 North America Dry Sweetener Revenue (USD Million) By Product (2021-2032)
Table 20 Europe Dry Sweetener Revenue (USD Million) By Type (2021-2032)
Table 21 Europe Dry Sweetener Revenue (USD Million) By Application (2021-2032)
Table 22 Europe Dry Sweetener Revenue (USD Million) By Product (2021-2032)
Table 23 Asia Pacific Dry Sweetener Revenue (USD Million) By Type (2021-2032)
Table 24 Asia Pacific Dry Sweetener Revenue (USD Million) By Application (2021-2032)
Table 25 Asia Pacific Dry Sweetener Revenue (USD Million) By Product (2021-2032)
Table 26 South America Dry Sweetener Revenue (USD Million) By Type (2021-2032)
Table 27 South America Dry Sweetener Revenue (USD Million) By Application (2021-2032)
Table 28 South America Dry Sweetener Revenue (USD Million) By Product (2021-2032)
Table 29 Middle East and Africa Dry Sweetener Revenue (USD Million) By Type (2021-2032)
Table 30 Middle East and Africa Dry Sweetener Revenue (USD Million) By Application (2021-2032)
Table 31 Middle East and Africa Dry Sweetener Revenue (USD Million) By Product (2021-2032)
LIST OF FIGURES
Figure 1. Market Scope
Figure 2. Pricing Forecasts Per Unit, 2023- 2032
Figure 3. Porter’s Five Forces
Figure 4. Global Dry Sweetener Market Revenue (USD Million) By Regions (2021-2032)
Figure 5. Global Dry Sweetener Market Share (%) By Regions (2023)
Figure 6. North America Dry Sweetener Revenue (USD Million) By Country (2021-2032)
Figure 7. United States Dry Sweetener Revenue (USD Million) By Country (2021-2032)
Figure 8. Canada Dry Sweetener Revenue (USD Million) By Country (2021-2032)
Figure 9. Mexico Dry Sweetener Revenue (USD Million) By Country (2021-2032)
Figure 10. Europe Dry Sweetener Revenue (USD Million) By Country (2021-2032)
Figure 11. Germany Dry Sweetener Revenue (USD Million) By Country (2021-2032)
Figure 12. France Dry Sweetener Revenue (USD Million) By Country (2021-2032)
Figure 13. United Kingdom Dry Sweetener Revenue (USD Million) By Country (2021-2032)
Figure 14. Spain Dry Sweetener Revenue (USD Million) By Country (2021-2032)
Figure 15. Italy Dry Sweetener Revenue (USD Million) By Country (2021-2032)
Figure 16. Russia Dry Sweetener Revenue (USD Million) By Country (2021-2032)
Figure 17. Rest of Europe Dry Sweetener Revenue (USD Million) By Country (2021-2032)
Figure 11. Asia Pacific Dry Sweetener Revenue (USD Million) By Country (2021-2032)
Figure 12. China Dry Sweetener Revenue (USD Million) By Country (2021-2032)
Figure 13. Japan Dry Sweetener Revenue (USD Million) By Country (2021-2032)
Figure 14. India Dry Sweetener Revenue (USD Million) By Country (2021-2032)
Figure 15. South Korea Dry Sweetener Revenue (USD Million) By Country (2021-2032)
Figure 16. Australia Dry Sweetener Revenue (USD Million) By Country (2021-2032)
Figure 17. South East Asia Dry Sweetener Revenue (USD Million) By Country (2021-2032)
Figure 18. South America Dry Sweetener Revenue (USD Million) By Country (2021-2032)
Figure 19. Brazil Dry Sweetener Revenue (USD Million) By Country (2021-2032)
Figure 20. Argentina Dry Sweetener Revenue (USD Million) By Country (2021-2032)
Figure 21. Rest of Asia Pacific Dry Sweetener Revenue (USD Million) By Country (2021-2032)
Figure 22. Middle East and Africa Dry Sweetener Revenue (USD Million) By Region (2021-2032)
Figure 23. Saudi Arabia Dry Sweetener Revenue (USD Million) By Region (2021-2032)
Figure 24. The UAE Dry Sweetener Revenue (USD Million) By Region (2021-2032)
Figure 25. Rest of Middle East Dry Sweetener Revenue (USD Million) By Region (2021-2032)
Figure 26. South Africa Dry Sweetener Revenue (USD Million) By Region (2021-2032)
Figure 27. Africa Dry Sweetener Revenue (USD Million) By Region (2021-2032)
Figure 28. North America Dry Sweetener Revenue (USD Million) By Type (2021-2032)
Figure 29. North America Dry Sweetener Revenue (USD Million) By Application (2021-2032)
Figure 30. North America Dry Sweetener Revenue (USD Million) By Product (2021-2032)
Figure 31. Europe Dry Sweetener Revenue (USD Million) By Type (2021-2032)
Figure 32. Europe Dry Sweetener Revenue (USD Million) By Application (2021-2032)
Figure 33. Europe Dry Sweetener Revenue (USD Million) By Product (2021-2032)
Figure 34. Asia Pacific Dry Sweetener Revenue (USD Million) By Type (2021-2032)
Figure 35. Asia Pacific Dry Sweetener Revenue (USD Million) By Application (2021-2032)
Figure 36. Asia Pacific Dry Sweetener Revenue (USD Million) By Product (2021-2032)
Figure 37. South America Dry Sweetener Revenue (USD Million) By Type (2021-2032)
Figure 38. South America Dry Sweetener Revenue (USD Million) By Application (2021-2032)
Figure 39. South America Dry Sweetener Revenue (USD Million) By Product (2021-2032)
Figure 40. Middle East and Africa Dry Sweetener Revenue (USD Million) By Type (2021-2032)
Figure 41. Middle East and Africa Dry Sweetener Revenue (USD Million) By Application (2021-2032)
Figure 42. Middle East and Africa Dry Sweetener Revenue (USD Million) By Product (2021-2032)
By Product
Malt
Raisins
Dry honey
Fruit sugars
Molasses
Others
By Application
Confectionery
Bakery
Dairy
By Form
Powder
Crystal
Flakes
Countries Analyzed
North America (US, Canada, Mexico)
Europe (Germany, UK, France, Spain, Italy, Russia, Rest of Europe)
Asia Pacific (China, India, Japan, South Korea, Australia, South East Asia, Rest of Asia)
South America (Brazil, Argentina, Rest of South America)
Middle East and Africa (Saudi Arabia, UAE, Rest of Middle East, South Africa, Egypt, Rest of Africa)
