
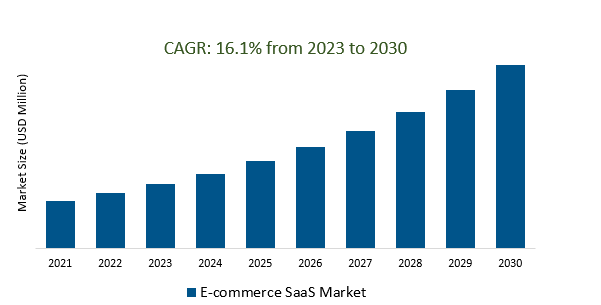
The Global E-commerce SaaS Market Size is estimated to register 16.1% growth over the forecast period from 2023 to 2030.
The market growth is driven by increasing E-commerce SaaS platforms are increasingly integrating AR and VR technologies to enhance the online shopping experience. This includes features such as virtual try-ons, 3D product visualization, and interactive product demonstrations. The trend is driven by the desire to bridge the gap between the online and offline shopping experience, providing customers with a more immersive and engaging way to explore products before making a purchase. Leading Companies focusing on Blockchain for Enhanced Security and Transparency, Voice Commerce Integration, Artificial Intelligence for Advanced Customer Insights, and others to boost market shares in the industry.
The E-commerce SaaS market is experiencing rapid global growth, driven by the increasing digitization of businesses and the expansion of online retail. These platforms offer end-to-end solutions, including website development, inventory management, and payment processing. Key characteristics include flexibility, scalability, and a focus on innovation, with AI and data analytics being integrated for enhanced personalization and user experience. Subscription-based models are prevalent, and security measures are prioritized to protect customer data. The market is competitive, prompting continuous advancements such as the adoption of headless commerce and the integration of AR/VR technologies.
In the mobile-first era, e-commerce success hinges on adept mobile optimization. This involves prioritizing responsive design for seamless user experiences on diverse devices, developing user-friendly mobile apps for enhanced engagement and retention, optimizing site speed through techniques like image compression, tailoring SEO strategies for mobile search, streamlining secure mobile payment options, integrating social commerce features, ensuring robust data security, leveraging AI for personalized experiences, adopting a culture of continuous testing and optimization, and exploring emerging technologies like AR and VR for innovative mobile interactions.
The E-commerce SaaS market is propelled by a growing demand for personalization and AI integration to elevate customer experiences and stimulate business growth. This involves employing AI-driven strategies for personalized product recommendations, dynamic pricing, and predictive analytics in inventory management. Additionally, AI is crucial for enhancing security measures, with applications in fraud detection, while tools like chatbots and virtual assistants contribute to efficient customer support. The adoption of adaptive user interfaces and the mapping of customer journeys further underscore the market's commitment to tailoring online interactions, optimizing user experiences, and ultimately driving enhanced business outcomes.
Subscription-based models are gaining traction in the E-commerce SaaS market, providing businesses with predictable and recurring revenue streams while fostering long-term customer relationships. This shift towards the subscription economy ensures financial stability, facilitates efficient resource allocation, and promotes customer loyalty. The model's scalability, reduced entry barriers, and adaptability to changing market conditions make it particularly appealing for businesses of all sizes. Furthermore, the subscription approach incentivizes continuous value delivery, with a focus on customer satisfaction and retention metrics, signaling a fundamental change in how E-commerce SaaS platforms engage with their user base.
The Global E-commerce SaaS Market is analyzed across Store Management, Express Service, Customer Service, and others. Store Management is poised to register the fastest growth. In the E-commerce SaaS market, store management solutions play a pivotal role by offering features such as inventory management, streamlined order processing, and fulfillment workflows. These platforms provide robust product information management (PIM), support multi-channel selling, integrate with point-of-sale (POS) systems, and include tools for creating promotions and discounts. Additionally, E-commerce SaaS solutions often incorporate customer relationship management (CRM) functionalities, analytics, and reporting tools to empower businesses with insights into sales performance and customer behavior.
The Global E-commerce SaaS Market is analyzed across various Organizations including Online Shopping platforms, Shipping Companies, E-retailers, Online Shopping Consumers, and others. Of these, Online Shopping Platforms held a significant market share in 2023. Online shopping platforms in the E-commerce SaaS market provide comprehensive solutions for creating and managing digital stores, offering features like customizable templates, secure payment processing, and inventory management. These platforms ensure a user-friendly experience with responsive designs and seamless integration with payment gateways and shipping providers. Marketing tools, including promotions and analytics, contribute to optimizing online presence and customer engagement. Continuously evolving, these platforms offer scalable solutions to meet the diverse needs of businesses in the digital retail landscape.
By Type
By Application
By Region
*List not exhaustive
E commerce SaaS Market Outlook 2023
1 Market Overview
1.1 Introduction to the E commerce SaaS Market
1.2 Scope of the Study
1.3 Research Objective
1.3.1 Key Market Scope and Segments
1.3.2 Players Covered
1.3.3 Years Considered
2 Executive Summary
2.1 2023 E commerce SaaS Industry- Market Statistics
3 Market Dynamics
3.1 Market Drivers
3.2 Market Challenges
3.3 Market Opportunities
3.4 Market Trends
4 Market Factor Analysis
4.1 Porter’s Five Forces
4.2 Market Entropy
4.2.1 Global E commerce SaaS Market Companies with Area Served
4.2.2 Products Offerings Global E commerce SaaS Market
5 COVID-19 Impact Analysis and Outlook Scenarios
5.1.1 Covid-19 Impact Analysis
5.1.2 post-COVID-19 Scenario- Low Growth Case
5.1.3 post-COVID-19 Scenario- Reference Growth Case
5.1.4 post-COVID-19 Scenario- Low Growth Case
6 Global E commerce SaaS Market Trends
6.1 Global E commerce SaaS Revenue (USD Million) and CAGR (%) by Type (2018-2030)
6.2 Global E commerce SaaS Revenue (USD Million) and CAGR (%) by Applications (2018-2030)
6.3 Global E commerce SaaS Revenue (USD Million) and CAGR (%) by regions (2018-2030)
7 Global E commerce SaaS Market Revenue (USD Million) by Type, and Applications (2018-2022)
7.1 Global E commerce SaaS Revenue (USD Million) by Type (2018-2022)
7.1.1 Global E commerce SaaS Revenue (USD Million), Market Share (%) by Type (2018-2022)
7.2 Global E commerce SaaS Revenue (USD Million) by Applications (2018-2022)
7.2.1 Global E commerce SaaS Revenue (USD Million), Market Share (%) by Applications (2018-2022)
8 Global E commerce SaaS Development Regional Status and Outlook
8.1 Global E commerce SaaS Revenue (USD Million) By Regions (2018-2022)
8.2 North America E commerce SaaS Revenue (USD Million) by Type, and Application (2018-2022)
8.2.1 North America E commerce SaaS Revenue (USD Million) by Country (2018-2022)
8.2.2 North America E commerce SaaS Revenue (USD Million) by Type (2018-2022)
8.2.3 North America E commerce SaaS Revenue (USD Million) by Applications (2018-2022)
8.3 Europe E commerce SaaS Revenue (USD Million), by Type, and Applications (USD Million) (2018-2022)
8.3.1 Europe E commerce SaaS Revenue (USD Million), by Country (2018-2022)
8.3.2 Europe E commerce SaaS Revenue (USD Million) by Type (2018-2022)
8.3.3 Europe E commerce SaaS Revenue (USD Million) by Applications (2018-2022)
8.4 Asia Pacific E commerce SaaS Revenue (USD Million), and Revenue (USD Million) by Type, and Applications (2018-2022)
8.4.1 Asia Pacific E commerce SaaS Revenue (USD Million) by Country (2018-2022)
8.4.2 Asia Pacific E commerce SaaS Revenue (USD Million) by Type (2018-2022)
8.4.3 Asia Pacific E commerce SaaS Revenue (USD Million) by Applications (2018-2022)
8.5 South America E commerce SaaS Revenue (USD Million), by Type, and Applications (2018-2022)
8.5.1 South America E commerce SaaS Revenue (USD Million), by Country (2018-2022)
8.5.2 South America E commerce SaaS Revenue (USD Million) by Type (2018-2022)
8.5.3 South America E commerce SaaS Revenue (USD Million) by Applications (2018-2022)
8.6 Middle East and Africa E commerce SaaS Revenue (USD Million), by Type, Technology, Application, Thickness (2018-2022)
8.6.1 Middle East and Africa E commerce SaaS Revenue (USD Million) by Country (2018-2022)
8.6.2 Middle East and Africa E commerce SaaS Revenue (USD Million) by Type (2018-2022)
8.6.3 Middle East and Africa E commerce SaaS Revenue (USD Million) by Applications (2018-2022)
9 Company Profiles
10 Global E commerce SaaS Market Revenue (USD Million), by Type, and Applications (2023-2030)
10.1 Global E commerce SaaS Revenue (USD Million) and Market Share (%) by Type (2023-2030)
10.1.1 Global E commerce SaaS Revenue (USD Million), and Market Share (%) by Type (2023-2030)
10.2 Global E commerce SaaS Revenue (USD Million) and Market Share (%) by Applications (2023-2030)
10.2.1 Global E commerce SaaS Revenue (USD Million), and Market Share (%) by Applications (2023-2030)
11 Global E commerce SaaS Development Regional Status and Outlook Forecast
11.1 Global E commerce SaaS Revenue (USD Million) By Regions (2023-2030)
11.2 North America E commerce SaaS Revenue (USD Million) by Type, and Applications (2023-2030)
11.2.1 North America E commerce SaaS Revenue (USD) Million by Country (2023-2030)
11.2.2 North America E commerce SaaS Revenue (USD Million), by Type (2023-2030)
11.2.3 North America E commerce SaaS Revenue (USD Million), Market Share (%) by Applications (2023-2030)
11.3 Europe E commerce SaaS Revenue (USD Million), by Type, and Applications (2023-2030)
11.3.1 Europe E commerce SaaS Revenue (USD Million), by Country (2023-2030)
11.3.2 Europe E commerce SaaS Revenue (USD Million), by Type (2023-2030)
11.3.3 Europe E commerce SaaS Revenue (USD Million), by Applications (2023-2030)
11.4 Asia Pacific E commerce SaaS Revenue (USD Million) by Type, and Applications (2023-2030)
11.4.1 Asia Pacific E commerce SaaS Revenue (USD Million), by Country (2023-2030)
11.4.2 Asia Pacific E commerce SaaS Revenue (USD Million), by Type (2023-2030)
11.4.3 Asia Pacific E commerce SaaS Revenue (USD Million), by Applications (2023-2030)
11.5 South America E commerce SaaS Revenue (USD Million), by Type, and Applications (2023-2030)
11.5.1 South America E commerce SaaS Revenue (USD Million), by Country (2023-2030)
11.5.2 South America E commerce SaaS Revenue (USD Million), by Type (2023-2030)
11.5.3 South America E commerce SaaS Revenue (USD Million), by Applications (2023-2030)
11.6 Middle East and Africa E commerce SaaS Revenue (USD Million), by Type, and Applications (2023-2030)
11.6.1 Middle East and Africa E commerce SaaS Revenue (USD Million), by region (2023-2030)
11.6.2 Middle East and Africa E commerce SaaS Revenue (USD Million), by Type (2023-2030)
11.6.3 Middle East and Africa E commerce SaaS Revenue (USD Million), by Applications (2023-2030)
12 Methodology and Data Sources
12.1 Methodology/Research Approach
12.1.1 Research Programs/Design
12.1.2 Market Size Estimation
12.1.3 Market Breakdown and Data Triangulation
12.2 Data Sources
12.2.1 Secondary Sources
12.2.2 Primary Sources
12.3 Disclaimer
List of Tables
Table 1 Market Segmentation Analysis
Table 2 Global E commerce SaaS Market Companies with Areas Served
Table 3 Products Offerings Global E commerce SaaS Market
Table 4 Low Growth Scenario Forecasts
Table 5 Reference Case Growth Scenario
Table 6 High Growth Case Scenario
Table 7 Global E commerce SaaS Revenue (USD Million) And CAGR (%) By Type (2018-2030)
Table 8 Global E commerce SaaS Revenue (USD Million) And CAGR (%) By Applications (2018-2030)
Table 9 Global E commerce SaaS Revenue (USD Million) And CAGR (%) By Regions (2018-2030)
Table 10 Global E commerce SaaS Revenue (USD Million) By Type (2018-2022)
Table 11 Global E commerce SaaS Revenue Market Share (%) By Type (2018-2022)
Table 12 Global E commerce SaaS Revenue (USD Million) By Applications (2018-2022)
Table 13 Global E commerce SaaS Revenue Market Share (%) By Applications (2018-2022)
Table 14 Global E commerce SaaS Market Revenue (USD Million) By Regions (2018-2022)
Table 15 Global E commerce SaaS Market Share (%) By Regions (2018-2022)
Table 16 North America E commerce SaaS Revenue (USD Million) By Country (2018-2022)
Table 17 North America E commerce SaaS Revenue (USD Million) By Type (2018-2022)
Table 18 North America E commerce SaaS Revenue (USD Million) By Applications (2018-2022)
Table 19 Europe E commerce SaaS Revenue (USD Million) By Country (2018-2022)
Table 20 Europe E commerce SaaS Revenue (USD Million) By Type (2018-2022)
Table 21 Europe E commerce SaaS Revenue (USD Million) By Applications (2018-2022)
Table 22 Asia Pacific E commerce SaaS Revenue (USD Million) By Country (2018-2022)
Table 23 Asia Pacific E commerce SaaS Revenue (USD Million) By Type (2018-2022)
Table 24 Asia Pacific E commerce SaaS Revenue (USD Million) By Applications (2018-2022)
Table 25 South America E commerce SaaS Revenue (USD Million) By Country (2018-2022)
Table 26 South America E commerce SaaS Revenue (USD Million) By Type (2018-2022)
Table 27 South America E commerce SaaS Revenue (USD Million) By Applications (2018-2022)
Table 28 Middle East and Africa E commerce SaaS Revenue (USD Million) By Region (2018-2022)
Table 29 Middle East and Africa E commerce SaaS Revenue (USD Million) By Type (2018-2022)
Table 30 Middle East and Africa E commerce SaaS Revenue (USD Million) By Applications (2018-2022)
Table 31 Financial Analysis
Table 32 Global E commerce SaaS Revenue (USD Million) By Type (2023-2030)
Table 33 Global E commerce SaaS Revenue Market Share (%) By Type (2023-2030)
Table 34 Global E commerce SaaS Revenue (USD Million) By Applications (2023-2030)
Table 35 Global E commerce SaaS Revenue Market Share (%) By Applications (2023-2030)
Table 36 Global E commerce SaaS Market Revenue (USD Million), And Revenue (USD Million) By Regions (2023-2030)
Table 37 North America E commerce SaaS Revenue (USD)By Country (2023-2030)
Table 38 North America E commerce SaaS Revenue (USD Million) By Type (2023-2030)
Table 39 North America E commerce SaaS Revenue (USD Million) By Applications (2023-2030)
Table 40 Europe E commerce SaaS Revenue (USD Million) By Country (2023-2030)
Table 41 Europe E commerce SaaS Revenue (USD Million) By Type (2023-2030)
Table 42 Europe E commerce SaaS Revenue (USD Million) By Applications (2023-2030)
Table 43 Asia Pacific E commerce SaaS Revenue (USD Million) By Country (2023-2030)
Table 44 Asia Pacific E commerce SaaS Revenue (USD Million) By Type (2023-2030)
Table 45 Asia Pacific E commerce SaaS Revenue (USD Million) By Applications (2023-2030)
Table 46 South America E commerce SaaS Revenue (USD Million) By Country (2023-2030)
Table 47 South America E commerce SaaS Revenue (USD Million) By Type (2023-2030)
Table 48 South America E commerce SaaS Revenue (USD Million) By Applications (2023-2030)
Table 49 Middle East and Africa E commerce SaaS Revenue (USD Million) By Region (2023-2030)
Table 50 Middle East and Africa E commerce SaaS Revenue (USD Million) By Region (2023-2030)
Table 51 Middle East and Africa E commerce SaaS Revenue (USD Million) By Type (2023-2030)
Table 52 Middle East and Africa E commerce SaaS Revenue (USD Million) By Applications (2023-2030)
Table 53 Research Programs/Design for This Report
Table 54 Key Data Information from Secondary Sources
Table 55 Key Data Information from Primary Sources
List of Figures
Figure 1 Market Scope
Figure 2 Porter’s Five Forces
Figure 3 Global E commerce SaaS Revenue (USD Million) By Type (2018-2022)
Figure 4 Global E commerce SaaS Revenue Market Share (%) By Type (2022)
Figure 5 Global E commerce SaaS Revenue (USD Million) By Applications (2018-2022)
Figure 6 Global E commerce SaaS Revenue Market Share (%) By Applications (2022)
Figure 7 Global E commerce SaaS Market Revenue (USD Million) By Regions (2018-2022)
Figure 8 Global E commerce SaaS Market Share (%) By Regions (2022)
Figure 9 North America E commerce SaaS Revenue (USD Million) By Country (2018-2022)
Figure 10 North America E commerce SaaS Revenue (USD Million) By Type (2018-2022)
Figure 11 North America E commerce SaaS Revenue (USD Million) By Applications (2018-2022)
Figure 12 Europe E commerce SaaS Revenue (USD Million) By Country (2018-2022)
Figure 13 Europe E commerce SaaS Revenue (USD Million) By Type (2018-2022)
Figure 14 Europe E commerce SaaS Revenue (USD Million) By Applications (2018-2022)
Figure 15 Asia Pacific E commerce SaaS Revenue (USD Million) By Country (2018-2022)
Figure 16 Asia Pacific E commerce SaaS Revenue (USD Million) By Type (2018-2022)
Figure 17 Asia Pacific E commerce SaaS Revenue (USD Million) By Applications (2018-2022)
Figure 18 South America E commerce SaaS Revenue (USD Million) By Country (2018-2022)
Figure 19 South America E commerce SaaS Revenue (USD Million) By Type (2018-2022)
Figure 20 South America E commerce SaaS Revenue (USD Million) By Applications (2018-2022)
Figure 21 Middle East and Africa E commerce SaaS Revenue (USD Million) By Region (2018-2022)
Figure 22 Middle East and Africa E commerce SaaS Revenue (USD Million) By Type (2018-2022)
Figure 23 Middle East and Africa E commerce SaaS Revenue (USD Million) By Applications (2018-2022)
Figure 24 Global E commerce SaaS Revenue (USD Million) By Type (2023-2030)
Figure 25 Global E commerce SaaS Revenue Market Share (%) By Type (2030)
Figure 26 Global E commerce SaaS Revenue (USD Million) By Applications (2023-2030)
Figure 27 Global E commerce SaaS Revenue Market Share (%) By Applications (2030)
Figure 28 Global E commerce SaaS Market Revenue (USD Million) By Regions (2023-2030)
Figure 29 North America E commerce SaaS Revenue (USD Million) By Country (2023-2030)
Figure 30 North America E commerce SaaS Revenue (USD Million) By Type (2023-2030)
Figure 31 North America E commerce SaaS Revenue (USD Million) By Applications (2023-2030)
Figure 32 Europe E commerce SaaS Revenue (USD Million) By Country (2023-2030)
Figure 33 Europe E commerce SaaS Revenue (USD Million) By Type (2023-2030)
Figure 34 Europe E commerce SaaS Revenue (USD Million) By Applications (2023-2030)
Figure 35 Asia Pacific E commerce SaaS Revenue (USD Million) By Country (2023-2030)
Figure 36 Asia Pacific E commerce SaaS Revenue (USD Million) By Type (2023-2030)
Figure 37 Asia Pacific E commerce SaaS Revenue (USD Million) By Applications (2023-2030)
Figure 38 South America E commerce SaaS Revenue (USD Million) By Country (2023-2030)
Figure 39 South America E commerce SaaS Revenue (USD Million) By Type (2023-2030)
Figure 40 South America E commerce SaaS Revenue (USD Million) By Applications (2023-2030)
Figure 41 Middle East and Africa E commerce SaaS Revenue (USD Million) By Region (2023-2030)
Figure 42 Middle East and Africa E commerce SaaS Revenue (USD Million) By Region (2023-2030)
Figure 43 Middle East and Africa E commerce SaaS Revenue (USD Million) By Type (2023-2030)
Figure 44 Middle East and Africa E commerce SaaS Revenue (USD Million) By Applications (2023-2030)
Figure 45 Bottom-Up and Top-Down Approaches for This Report
Figure 46 Data Triangulation
By Type
By Application
By Region