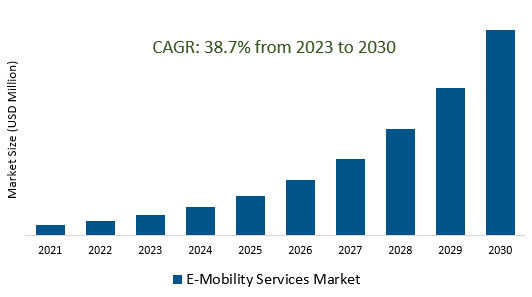
The Global E-Mobility Services Market Size is estimated to register 38.7% growth over the forecast period from 2023 to 2030.
E-Mobility Services Market overview
E-mobility service market is driven by the expansion of electric vehicle models and growing consumer interest towards comfortable mobility with cost effectiveness. Additionally, E-mobility service providers are integrating smart technologies and offering diverse models such as ride-sharing and car-sharing to enhance user experience. Ongoing investments from companies and governments in expanding charging networks is enabling rapid uptake of electric vehicles, thereby supporting the market growth prospects. Further, R&D investments in the integration of self-driving technology further fuels the market outlook for e-mobility services.
Market dynamics:
Increasing range of Electric Vehicles (EVs) is driving the market for E-mobility services
Experiencing a groundswell of interest, consumers are increasingly opting for electric vehicles, not only for personal use but also in the commercial sector. In the personal transportation sector, consumers are drawn to the cost savings associated with electric vehicles, given their lower operational costs. Moreover, the expanding variety of electric vehicle models, ranging from compact cars to luxury SUVs, provides consumers with diverse choices.
Growing environmental awareness has a significant positive impact on the e-mobility service market.
The drive to reduce carbon footprints is a key driving force behind the surge in demand for electric vehicles (EVs). This shift is reshaping the automotive market landscape, with manufacturers increasingly focusing on the development and production of eco-friendly vehicles to meet this growing demand. In response to this trend, governments and regulatory bodies are implementing policies and incentives that further propel the adoption of sustainable transportation option.Top of Form
In battery technology are making electric vehicles more practical and attractive to consumers
Advancements in battery technology often leads to cost reductions in manufacturing and maintenance. E-mobility services benefit from the enhanced acceleration, responsiveness, and durability of EVs with advanced batteries. This, in turn, contributes to a more satisfying and reliable experience for users of electric shared mobility. Features such as real-time battery monitoring, predictive maintenance, and optimized route planning contribute to a seamless and intelligent user experience
Market share analysis:
Electric scooters stand out as the leading market segment in the realm of e-mobility-services.
Electric scooters represent the largest market segment in e-mobility services among Electric Bikes, Electric Scooters, Electric Motorized Scooters, and Electric Motorcycles, accounting for over 50% of the global market. Electric scooters are typically more affordable than other types of electric vehicles, such as electric bikes and motorcycles. They are portable and can be easily folded up and carried onto public transportation. Electric scooters are easy to learn to ride and do not require any special skills or training. They have become increasingly popular in recent years, due in part to their affordability, convenience, and ease of use.
Li-ion batteries hold the biggest market share in today's e-mobility services landscape
Lithium-ion (Li-ion) batteries currently hold the largest market share across Lead-acid battery, Lithium-ion (Li-ion) batteries and others in e-mobility services, accounting for over 80% of the global market. Li-ion batteries have a higher energy density than lead-acid batteries, enabling them to store more energy in a smaller and lighter package. This characteristic is crucial for electric vehicles, providing them with a longer range and higher payload capacity. Additionally, Li-ion batteries boast a longer lifespan compared to lead-acid batteries, resulting in less frequent replacements. This not only saves money in the long run but also reduces environmental impact. Moreover, Li-ion batteries are generally considered safer than lead-acid batteries, as they are less likely to explode or leak. This is important for the safety of both passengers and the environment.
Hub drives currently occupy the largest market share in the e-mobility services sector.
Hub drives currently hold the largest market share in the e-mobility services sector, surpassing belt drives and chain drives, and account for over 70% of the global market. Hub drives are integrated within the wheel hub, making them compact and lightweight, contributing to the overall weight reduction of electric vehicles. Moreover, hub drives operate with minimal noise and vibration, enhancing the overall driving experience and reducing noise pollution. Additionally, hub drives require minimal maintenance, making them a cost-effective and hassle-free option for e-mobility service providers. Furthermore, hub drives are well-suited for low-speed applications, which is the primary use case for e-mobility services like electric scooters and bikes.
The market share is currently dominated by commercial end users.
Commercial end users currently hold the largest market share, accounting for over 60% of the global market across personal and commercial end users. This is attributed to reasons such as businesses increasingly seeking ways to reduce their environmental impact and improve efficiency. E-mobility services provide a convenient and affordable means to achieve these goals. Additionally, businesses need reliable transportation to ensure the efficient movement of their employees and products. E-mobility services offer a dependable and accessible option. Moreover, many governments are providing incentives to businesses adopting e-mobility services, making these services more affordable and accessible to businesses.
The title of the largest e-mobility service market is currently held by Asia-Pacific.
Asia-Pacific currently holds the title of the largest e-mobility service market, surpassing North America (United States, Canada, Mexico), Europe (Germany, France, United Kingdom, Spain, Italy, Others), Latin America (Brazil, Argentina, Others), and the Middle East and Africa (Saudi Arabia, UAE, Kuwait, Other Middle East, South Africa, Nigeria, Other Africa). This is due to reasons such as Asia-Pacific being the most populous region globally, with its cities experiencing rapid growth. This growth has resulted in increased congestion and air pollution, thereby driving the demand for cleaner and more sustainable transportation options. Additionally, many governments in Asia-Pacific are offering incentives for the adoption of e-mobility services, including subsidies and tax breaks. These measures contribute to making e-mobility services more affordable and accessible to both consumers and businesses.
E-Mobility Services Market Segmentation
By Type
- Electric Bikes
- Electric Scooters
- Electric Motorized Scooters
- Electric Motorcycles
By Battery
- Lead Acid Battery
- Li-Ion Battery
- Others
By Drive
- Belt Drive
- Chain Drive
- Hub Drive
By End User
By Region
- North America (United States, Canada, Mexico)
- Europe (Germany, France, United Kingdom, Spain, Italy, Others)
- Asia Pacific (China, India, Japan, South Korea, Australia, Others)
- Latin America (Brazil, Argentina, Others)
- Middle East and Africa (Saudi Arabia, UAE, Kuwait, Other Middle East, South Africa, Nigeria, Other Africa)
E-Mobility Services Market Companies
- Tier Mobility (Germany)
- Voi Technology (Sweden)
- Dott (France)
- Lime (Germany)
- Circ (Germany)
- Free Now (Germany)
- Cityscoot (France)
- Wind Mobility (Spain)
- Bolt (Estonia)
- Daimler Mobility Services (Germany)
- Spin (United States)
- Vogo (India)
- Gogoro (Taiwan)
- Revel (United States)
- Didi Chuxing (China)
- BlueSG (Singapore)
*List not exhaustive
E-Mobility Services Market Outlook 2023
1 Market Overview
1.1 Introduction to the E-Mobility Services Market
1.2 Scope of the Study
1.3 Research Objective
1.3.1 Key Market Scope and Segments
1.3.2 Players Covered
1.3.3 Years Considered
2 Executive Summary
2.1 2023 E-Mobility Services Industry- Market Statistics
3 Market Dynamics
3.1 Market Drivers
3.2 Market Challenges
3.3 Market Opportunities
3.4 Market Trends
4 Market Factor Analysis
4.1 Porter’s Five Forces
4.2 Market Entropy
4.2.1 Global E-Mobility Services Market Companies with Area Served
4.2.2 Products Offerings Global E-Mobility Services Market
5 COVID-19 Impact Analysis and Outlook Scenarios
5.1.1 Covid-19 Impact Analysis
5.1.2 post-COVID-19 Scenario- Low Growth Case
5.1.3 post-COVID-19 Scenario- Reference Growth Case
5.1.4 post-COVID-19 Scenario- Low Growth Case
6 Global E-Mobility Services Market Trends
6.1 Global E-Mobility Services Revenue (USD Million) and CAGR (%) by Type (2018-2030)
6.2 Global E-Mobility Services Revenue (USD Million) and CAGR (%) by Applications (2018-2030)
6.3 Global E-Mobility Services Revenue (USD Million) and CAGR (%) by regions (2018-2030)
7 Global E-Mobility Services Market Revenue (USD Million) by Type, and Applications (2018-2022)
7.1 Global E-Mobility Services Revenue (USD Million) by Type (2018-2022)
7.1.1 Global E-Mobility Services Revenue (USD Million), Market Share (%) by Type (2018-2022)
7.2 Global E-Mobility Services Revenue (USD Million) by Applications (2018-2022)
7.2.1 Global E-Mobility Services Revenue (USD Million), Market Share (%) by Applications (2018-2022)
8 Global E-Mobility Services Development Regional Status and Outlook
8.1 Global E-Mobility Services Revenue (USD Million) By Regions (2018-2022)
8.2 North America E-Mobility Services Revenue (USD Million) by Type, and Application (2018-2022)
8.2.1 North America E-Mobility Services Revenue (USD Million) by Country (2018-2022)
8.2.2 North America E-Mobility Services Revenue (USD Million) by Type (2018-2022)
8.2.3 North America E-Mobility Services Revenue (USD Million) by Applications (2018-2022)
8.3 Europe E-Mobility Services Revenue (USD Million), by Type, and Applications (USD Million) (2018-2022)
8.3.1 Europe E-Mobility Services Revenue (USD Million), by Country (2018-2022)
8.3.2 Europe E-Mobility Services Revenue (USD Million) by Type (2018-2022)
8.3.3 Europe E-Mobility Services Revenue (USD Million) by Applications (2018-2022)
8.4 Asia Pacific E-Mobility Services Revenue (USD Million), and Revenue (USD Million) by Type, and Applications (2018-2022)
8.4.1 Asia Pacific E-Mobility Services Revenue (USD Million) by Country (2018-2022)
8.4.2 Asia Pacific E-Mobility Services Revenue (USD Million) by Type (2018-2022)
8.4.3 Asia Pacific E-Mobility Services Revenue (USD Million) by Applications (2018-2022)
8.5 South America E-Mobility Services Revenue (USD Million), by Type, and Applications (2018-2022)
8.5.1 South America E-Mobility Services Revenue (USD Million), by Country (2018-2022)
8.5.2 South America E-Mobility Services Revenue (USD Million) by Type (2018-2022)
8.5.3 South America E-Mobility Services Revenue (USD Million) by Applications (2018-2022)
8.6 Middle East and Africa E-Mobility Services Revenue (USD Million), by Type, Technology, Application, Thickness (2018-2022)
8.6.1 Middle East and Africa E-Mobility Services Revenue (USD Million) by Country (2018-2022)
8.6.2 Middle East and Africa E-Mobility Services Revenue (USD Million) by Type (2018-2022)
8.6.3 Middle East and Africa E-Mobility Services Revenue (USD Million) by Applications (2018-2022)
9 Company Profiles
10 Global E-Mobility Services Market Revenue (USD Million), by Type, and Applications (2023-2030)
10.1 Global E-Mobility Services Revenue (USD Million) and Market Share (%) by Type (2023-2030)
10.1.1 Global E-Mobility Services Revenue (USD Million), and Market Share (%) by Type (2023-2030)
10.2 Global E-Mobility Services Revenue (USD Million) and Market Share (%) by Applications (2023-2030)
10.2.1 Global E-Mobility Services Revenue (USD Million), and Market Share (%) by Applications (2023-2030)
11 Global E-Mobility Services Development Regional Status and Outlook Forecast
11.1 Global E-Mobility Services Revenue (USD Million) By Regions (2023-2030)
11.2 North America E-Mobility Services Revenue (USD Million) by Type, and Applications (2023-2030)
11.2.1 North America E-Mobility Services Revenue (USD) Million by Country (2023-2030)
11.2.2 North America E-Mobility Services Revenue (USD Million), by Type (2023-2030)
11.2.3 North America E-Mobility Services Revenue (USD Million), Market Share (%) by Applications (2023-2030)
11.3 Europe E-Mobility Services Revenue (USD Million), by Type, and Applications (2023-2030)
11.3.1 Europe E-Mobility Services Revenue (USD Million), by Country (2023-2030)
11.3.2 Europe E-Mobility Services Revenue (USD Million), by Type (2023-2030)
11.3.3 Europe E-Mobility Services Revenue (USD Million), by Applications (2023-2030)
11.4 Asia Pacific E-Mobility Services Revenue (USD Million) by Type, and Applications (2023-2030)
11.4.1 Asia Pacific E-Mobility Services Revenue (USD Million), by Country (2023-2030)
11.4.2 Asia Pacific E-Mobility Services Revenue (USD Million), by Type (2023-2030)
11.4.3 Asia Pacific E-Mobility Services Revenue (USD Million), by Applications (2023-2030)
11.5 South America E-Mobility Services Revenue (USD Million), by Type, and Applications (2023-2030)
11.5.1 South America E-Mobility Services Revenue (USD Million), by Country (2023-2030)
11.5.2 South America E-Mobility Services Revenue (USD Million), by Type (2023-2030)
11.5.3 South America E-Mobility Services Revenue (USD Million), by Applications (2023-2030)
11.6 Middle East and Africa E-Mobility Services Revenue (USD Million), by Type, and Applications (2023-2030)
11.6.1 Middle East and Africa E-Mobility Services Revenue (USD Million), by region (2023-2030)
11.6.2 Middle East and Africa E-Mobility Services Revenue (USD Million), by Type (2023-2030)
11.6.3 Middle East and Africa E-Mobility Services Revenue (USD Million), by Applications (2023-2030)
12 Methodology and Data Sources
12.1 Methodology/Research Approach
12.1.1 Research Programs/Design
12.1.2 Market Size Estimation
12.1.3 Market Breakdown and Data Triangulation
12.2 Data Sources
12.2.1 Secondary Sources
12.2.2 Primary Sources
12.3 Disclaimer
List of Tables
Table 1 Market Segmentation Analysis
Table 2 Global E-Mobility Services Market Companies with Areas Served
Table 3 Products Offerings Global E-Mobility Services Market
Table 4 Low Growth Scenario Forecasts
Table 5 Reference Case Growth Scenario
Table 6 High Growth Case Scenario
Table 7 Global E-Mobility Services Revenue (USD Million) And CAGR (%) By Type (2018-2030)
Table 8 Global E-Mobility Services Revenue (USD Million) And CAGR (%) By Applications (2018-2030)
Table 9 Global E-Mobility Services Revenue (USD Million) And CAGR (%) By Regions (2018-2030)
Table 10 Global E-Mobility Services Revenue (USD Million) By Type (2018-2022)
Table 11 Global E-Mobility Services Revenue Market Share (%) By Type (2018-2022)
Table 12 Global E-Mobility Services Revenue (USD Million) By Applications (2018-2022)
Table 13 Global E-Mobility Services Revenue Market Share (%) By Applications (2018-2022)
Table 14 Global E-Mobility Services Market Revenue (USD Million) By Regions (2018-2022)
Table 15 Global E-Mobility Services Market Share (%) By Regions (2018-2022)
Table 16 North America E-Mobility Services Revenue (USD Million) By Country (2018-2022)
Table 17 North America E-Mobility Services Revenue (USD Million) By Type (2018-2022)
Table 18 North America E-Mobility Services Revenue (USD Million) By Applications (2018-2022)
Table 19 Europe E-Mobility Services Revenue (USD Million) By Country (2018-2022)
Table 20 Europe E-Mobility Services Revenue (USD Million) By Type (2018-2022)
Table 21 Europe E-Mobility Services Revenue (USD Million) By Applications (2018-2022)
Table 22 Asia Pacific E-Mobility Services Revenue (USD Million) By Country (2018-2022)
Table 23 Asia Pacific E-Mobility Services Revenue (USD Million) By Type (2018-2022)
Table 24 Asia Pacific E-Mobility Services Revenue (USD Million) By Applications (2018-2022)
Table 25 South America E-Mobility Services Revenue (USD Million) By Country (2018-2022)
Table 26 South America E-Mobility Services Revenue (USD Million) By Type (2018-2022)
Table 27 South America E-Mobility Services Revenue (USD Million) By Applications (2018-2022)
Table 28 Middle East and Africa E-Mobility Services Revenue (USD Million) By Region (2018-2022)
Table 29 Middle East and Africa E-Mobility Services Revenue (USD Million) By Type (2018-2022)
Table 30 Middle East and Africa E-Mobility Services Revenue (USD Million) By Applications (2018-2022)
Table 31 Financial Analysis
Table 32 Global E-Mobility Services Revenue (USD Million) By Type (2023-2030)
Table 33 Global E-Mobility Services Revenue Market Share (%) By Type (2023-2030)
Table 34 Global E-Mobility Services Revenue (USD Million) By Applications (2023-2030)
Table 35 Global E-Mobility Services Revenue Market Share (%) By Applications (2023-2030)
Table 36 Global E-Mobility Services Market Revenue (USD Million), And Revenue (USD Million) By Regions (2023-2030)
Table 37 North America E-Mobility Services Revenue (USD)By Country (2023-2030)
Table 38 North America E-Mobility Services Revenue (USD Million) By Type (2023-2030)
Table 39 North America E-Mobility Services Revenue (USD Million) By Applications (2023-2030)
Table 40 Europe E-Mobility Services Revenue (USD Million) By Country (2023-2030)
Table 41 Europe E-Mobility Services Revenue (USD Million) By Type (2023-2030)
Table 42 Europe E-Mobility Services Revenue (USD Million) By Applications (2023-2030)
Table 43 Asia Pacific E-Mobility Services Revenue (USD Million) By Country (2023-2030)
Table 44 Asia Pacific E-Mobility Services Revenue (USD Million) By Type (2023-2030)
Table 45 Asia Pacific E-Mobility Services Revenue (USD Million) By Applications (2023-2030)
Table 46 South America E-Mobility Services Revenue (USD Million) By Country (2023-2030)
Table 47 South America E-Mobility Services Revenue (USD Million) By Type (2023-2030)
Table 48 South America E-Mobility Services Revenue (USD Million) By Applications (2023-2030)
Table 49 Middle East and Africa E-Mobility Services Revenue (USD Million) By Region (2023-2030)
Table 50 Middle East and Africa E-Mobility Services Revenue (USD Million) By Region (2023-2030)
Table 51 Middle East and Africa E-Mobility Services Revenue (USD Million) By Type (2023-2030)
Table 52 Middle East and Africa E-Mobility Services Revenue (USD Million) By Applications (2023-2030)
Table 53 Research Programs/Design for This Report
Table 54 Key Data Information from Secondary Sources
Table 55 Key Data Information from Primary Sources
List of Figures
Figure 1 Market Scope
Figure 2 Porter’s Five Forces
Figure 3 Global E-Mobility Services Revenue (USD Million) By Type (2018-2022)
Figure 4 Global E-Mobility Services Revenue Market Share (%) By Type (2022)
Figure 5 Global E-Mobility Services Revenue (USD Million) By Applications (2018-2022)
Figure 6 Global E-Mobility Services Revenue Market Share (%) By Applications (2022)
Figure 7 Global E-Mobility Services Market Revenue (USD Million) By Regions (2018-2022)
Figure 8 Global E-Mobility Services Market Share (%) By Regions (2022)
Figure 9 North America E-Mobility Services Revenue (USD Million) By Country (2018-2022)
Figure 10 North America E-Mobility Services Revenue (USD Million) By Type (2018-2022)
Figure 11 North America E-Mobility Services Revenue (USD Million) By Applications (2018-2022)
Figure 12 Europe E-Mobility Services Revenue (USD Million) By Country (2018-2022)
Figure 13 Europe E-Mobility Services Revenue (USD Million) By Type (2018-2022)
Figure 14 Europe E-Mobility Services Revenue (USD Million) By Applications (2018-2022)
Figure 15 Asia Pacific E-Mobility Services Revenue (USD Million) By Country (2018-2022)
Figure 16 Asia Pacific E-Mobility Services Revenue (USD Million) By Type (2018-2022)
Figure 17 Asia Pacific E-Mobility Services Revenue (USD Million) By Applications (2018-2022)
Figure 18 South America E-Mobility Services Revenue (USD Million) By Country (2018-2022)
Figure 19 South America E-Mobility Services Revenue (USD Million) By Type (2018-2022)
Figure 20 South America E-Mobility Services Revenue (USD Million) By Applications (2018-2022)
Figure 21 Middle East and Africa E-Mobility Services Revenue (USD Million) By Region (2018-2022)
Figure 22 Middle East and Africa E-Mobility Services Revenue (USD Million) By Type (2018-2022)
Figure 23 Middle East and Africa E-Mobility Services Revenue (USD Million) By Applications (2018-2022)
Figure 24 Global E-Mobility Services Revenue (USD Million) By Type (2023-2030)
Figure 25 Global E-Mobility Services Revenue Market Share (%) By Type (2030)
Figure 26 Global E-Mobility Services Revenue (USD Million) By Applications (2023-2030)
Figure 27 Global E-Mobility Services Revenue Market Share (%) By Applications (2030)
Figure 28 Global E-Mobility Services Market Revenue (USD Million) By Regions (2023-2030)
Figure 29 North America E-Mobility Services Revenue (USD Million) By Country (2023-2030)
Figure 30 North America E-Mobility Services Revenue (USD Million) By Type (2023-2030)
Figure 31 North America E-Mobility Services Revenue (USD Million) By Applications (2023-2030)
Figure 32 Europe E-Mobility Services Revenue (USD Million) By Country (2023-2030)
Figure 33 Europe E-Mobility Services Revenue (USD Million) By Type (2023-2030)
Figure 34 Europe E-Mobility Services Revenue (USD Million) By Applications (2023-2030)
Figure 35 Asia Pacific E-Mobility Services Revenue (USD Million) By Country (2023-2030)
Figure 36 Asia Pacific E-Mobility Services Revenue (USD Million) By Type (2023-2030)
Figure 37 Asia Pacific E-Mobility Services Revenue (USD Million) By Applications (2023-2030)
Figure 38 South America E-Mobility Services Revenue (USD Million) By Country (2023-2030)
Figure 39 South America E-Mobility Services Revenue (USD Million) By Type (2023-2030)
Figure 40 South America E-Mobility Services Revenue (USD Million) By Applications (2023-2030)
Figure 41 Middle East and Africa E-Mobility Services Revenue (USD Million) By Region (2023-2030)
Figure 42 Middle East and Africa E-Mobility Services Revenue (USD Million) By Region (2023-2030)
Figure 43 Middle East and Africa E-Mobility Services Revenue (USD Million) By Type (2023-2030)
Figure 44 Middle East and Africa E-Mobility Services Revenue (USD Million) By Applications (2023-2030)
Figure 45 Bottom-Up and Top-Down Approaches for This Report
Figure 46 Data Triangulation
