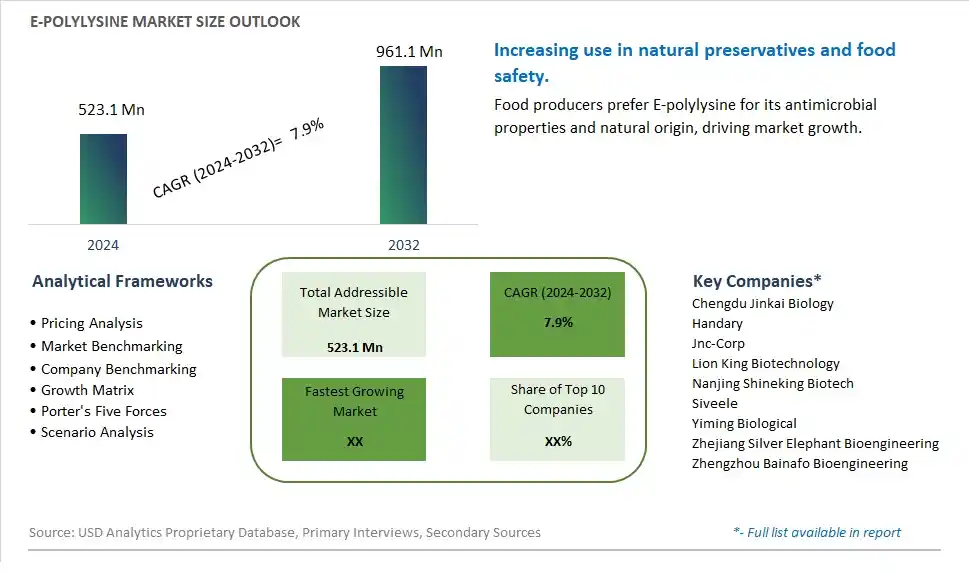
Global E-Polylysine Market Size is valued at $523.1 Million in 2024 and is forecast to register a growth rate (CAGR) of 7.9% to reach $961.1 Million by 2032.
The global E-Polylysine Market Comprehensive Study analyzes and forecasts the market size across 6 regions and 24 countries for diverse segments -By Type (Below 95% Content, Above 95% Content), By Application (Rice, Beverage, Meat, Prepared Foods, Seafood)
An Introduction to E-Polylysine Market
The E-Polylysine Market involves the production and sale of polylysine, a natural antimicrobial peptide used as a preservative in food and beverage products. E-polylysine is effective in inhibiting the growth of bacteria, yeasts, and molds. The market is driven by increasing demand for natural and clean label preservatives, rising awareness about food safety and shelf life, and growing applications in the food and beverage industry. Additionally, advancements in polylysine production technologies and the expansion of product applications support market growth.
E Polylysine Competitive Landscape
The market report analyses the leading companies in the industry including Chengdu Jinkai Biology, Handary, Jnc-Corp, Lion King Biotechnology, Nanjing Shineking Biotech, Siveele, Yiming Biological, Zhejiang Silver Elephant Bioengineering, Zhengzhou Bainafo Bioengineering, and Others.
E Polylysine Market Dynamics
Market Trend: Increasing Demand for Natural Preservatives
The E polylysine market is witnessing a significant trend towards the increasing demand for natural preservatives. As consumers become more health-conscious and wary of synthetic additives, there is a growing preference for natural and clean-label ingredients in food and beverage products. E polylysine, a naturally occurring antimicrobial agent, fits this trend perfectly by offering an effective and safe alternative to synthetic preservatives. This trend is particularly strong in the organic and natural food segments, where the emphasis on natural ingredients is paramount. The move towards cleaner labels and fewer artificial ingredients continues to drive the demand for E polylysine as a natural preservative.
Market Driver: Growing Awareness of Food Safety and Shelf Life Extension
A major driver for the E polylysine market is the growing awareness of food safety and the need to extend the shelf life of perishable products. Food manufacturers are increasingly seeking effective preservatives to ensure product safety and longevity, reduce food waste, and comply with stringent food safety regulations. E polylysine's ability to inhibit the growth of a wide range of microorganisms, including bacteria, molds, and yeasts, makes it an attractive solution for maintaining the freshness and safety of food products. The rising consumer demand for minimally processed foods that remain safe and fresh over extended periods further drives the adoption of E polylysine in the food industry.
Market Opportunity: Expansion into New Applications and Markets
The E polylysine market presents significant opportunities for expansion into new applications and markets. Beyond its traditional use in food preservation, there is potential for E polylysine to be utilized in other sectors such as cosmetics, pharmaceuticals, and agriculture. For instance, its antimicrobial properties can be leveraged in skincare products to enhance shelf life and safety. Additionally, exploring new geographical markets where the demand for natural preservatives is growing can drive market growth. Developing innovative product formulations and collaborating with industry stakeholders to educate them on the benefits and versatility of E polylysine can further enhance its market penetration and application scope.
E-Polylysine Market Share Analysis- Largest Segment by Type
The Above 95% Content segment is the largest in the E-Polylysine Market by type. This dominance is due to the high efficacy and wide range of applications of high-purity e-polylysine as a natural preservative. With a purity level above 95%, e-polylysine is highly effective in inhibiting the growth of a broad spectrum of microorganisms, making it an ideal choice for extending the shelf life of various food products. Its natural and safe profile aligns with the growing consumer demand for clean-label and preservative-free food products. The extensive use of high-purity e-polylysine in baked goods, dairy products, meat, seafood, and ready-to-eat meals supports its significant market share. Additionally, the continuous research and development in food preservation technologies and the increasing regulatory approvals for the use of e-polylysine further enhance the prominence of the above 95% content segment.
E-Polylysine Market Share Analysis- Fastest Growing Segment by Application
The Prepared Foods segment is poised to grow the fastest in the E-Polylysine Market by application over the next five years. This rapid growth is driven by the increasing consumer demand for convenient and ready-to-eat food options that maintain freshness and safety. E-polylysine is widely used in prepared foods to extend shelf life and prevent microbial spoilage without compromising on taste or quality. The growing trend of busy lifestyles and the rising popularity of meal kits, ready-to-eat meals, and convenience foods support the demand for effective natural preservatives like e-polylysine. Additionally, the continuous innovation in prepared food formulations, including the development of healthier and clean-label options, further drives the growth of this segment. The influence of food safety regulations and the need to reduce food waste also contribute to the fast growth of e-polylysine in the prepared foods market.
E Polylysine Market Segmentation
By Type
Below 95% Content
Above 95% Content
By Application
Rice
Beverage
Meat
Prepared Foods
Seafood
Countries Analyzed
North America (US, Canada, Mexico)
Europe (Germany, UK, France, Spain, Italy, Russia, Rest of Europe)
Asia Pacific (China, India, Japan, South Korea, Australia, South East Asia, Rest of Asia)
South America (Brazil, Argentina, Rest of South America)
Middle East and Africa (Saudi Arabia, UAE, Rest of Middle East, South Africa, Egypt, Rest of Africa)
E Polylysine Companies Profiled in the Study
Chengdu Jinkai Biology
Handary
Jnc-Corp
Lion King Biotechnology
Nanjing Shineking Biotech
Siveele
Yiming Biological
Zhejiang Silver Elephant Bioengineering
Zhengzhou Bainafo Bioengineering
*- List Not Exhaustive
Chapter 1. TABLE OF CONTENTS
Chapter 2. Introduction to E Polylysine Market
2.1. Market Overview
2.2. Key Statistics and Report Highlights
2.3. Scope of the Comprehensive Study
2.3.1. Market Definition
2.3.2 Countries and Regions Covered
2.3.3 Research Objective
2.3.4 Units, Currency, and Conversions
2.3.5 Industry Value Chain
2.4. Key Market Segments
2.5. Key Companies
2.6. Study Period
Chapter 3. Strategic Analysis Review
3.1. E Polylysine Pricing Analysis and Forecast
3.2. Porter’s Five Forces
3.3. Market Ecosystem
3.4. SWOT Analysis
3.5. Regulatory Scenario
3.3. Effects of Inflation, Russia-Ukraine War, moderating economic growth, and other macroeconomic factors
Chapter 4. Competitive Landscape
4.1. Market Share Analysis
4.1.1. Global E Polylysine Market Share by Company, 2023
4.1.2. Product Offerings of Leading E Polylysine Companies
4.2. Market Entropy
4.2.1. New Product Launches in the Industry
4.2.2. Mergers, Acquisitions, Joint ventures, and Partnerships
4.3. Key Strategies and Best Practices
Chapter 5. Global Market Projections: Best, Reference, and Low Case Scenarios
5.1. Growth Analysis- Case Scenario Definitions
5.2. Low Growth Case Scenario Forecasts
5.3. Reference Growth Case Scenario Forecasts
5.4. High Growth Case Scenario Forecasts
Chapter 6. Market Dynamics
6.1. E Polylysine Market Drivers
6.2. E Polylysine Market Challenges
6.6. E Polylysine Market Opportunities
6.4. E Polylysine Market Trends
Chapter 7. Global E Polylysine Market Outlook Trends
7.1. Global E Polylysine Revenue (USD Million) and CAGR (%) by Type (2021-2032)
7.2. Global E Polylysine Revenue (USD Million) and CAGR (%) by Application (2021-2032)
7.3. Global E Polylysine Revenue (USD Million) and CAGR (%) by Product (2021-2032)
By Type
Below 95% Content
Above 95% Content
By Application
Rice
Beverage
Meat
Prepared Foods
Seafood
Chapter 8. Global E Polylysine Regional Analysis and Outlook
8.1. Global E Polylysine Revenue (USD Million) By Regions (2021- 2032)
8.2. North America E Polylysine Revenue (USD Million) by Country (2021-2032)
8.2.1. United States E Polylysine Regional Analysis and Outlook
8.2.2. Canada E Polylysine Regional Analysis and Outlook
8.2.3. Mexico E Polylysine Regional Analysis and Outlook
8.3. Europe E Polylysine Revenue (USD Million), by Country (2021-2032)
8.3.1. Germany E Polylysine Regional Analysis and Outlook
8.3.2. France E Polylysine Regional Analysis and Outlook
8.3.3. United Kingdom E Polylysine Regional Analysis and Outlook
8.3.4. Spain E Polylysine Regional Analysis and Outlook
8.3.5. Italy E Polylysine Regional Analysis and Outlook
8.3.6. Russia E Polylysine Regional Analysis and Outlook
8.3.7. Rest of Europe E Polylysine Regional Analysis and Outlook
8.4. Asia Pacific E Polylysine Revenue (USD Million) by Country (2021-2032)
8.4.1. China E Polylysine Regional Analysis and Outlook
8.4.2. Japan E Polylysine Regional Analysis and Outlook
8.4.3. India E Polylysine Regional Analysis and Outlook
8.4.4. South Korea E Polylysine Regional Analysis and Outlook
8.4.5. Australia E Polylysine Regional Analysis and Outlook
8.4.6. South East Asia E Polylysine Regional Analysis and Outlook
8.4.7. Rest of Asia Pacific E Polylysine Regional Analysis and Outlook
8.5. South America E Polylysine Revenue (USD Million), by Country (2021-2032)
8.5.1. Brazil E Polylysine Regional Analysis and Outlook
8.5.2. Argentina E Polylysine Regional Analysis and Outlook
8.5.3. Rest of South America E Polylysine Regional Analysis and Outlook
8.6. Middle East and Africa E Polylysine Revenue (USD Million) by Country (2021-2032)
8.6.1. Middle East E Polylysine Regional Analysis and Outlook
8.6.2. Africa E Polylysine Regional Analysis and Outlook
Chapter 9. North America E Polylysine Analysis and Outlook
9.1. North America E Polylysine Revenue (USD Million) by Segments (2021-2032)
9.1.1. North America E Polylysine Revenue (USD Million) by Type (2021-2032)
9.1.2. North America E Polylysine Revenue (USD Million) by Application (2021-2032)
9.1.3. North America E Polylysine Revenue (USD Million) by Product (2021-2032)
By Type
Below 95% Content
Above 95% Content
By Application
Rice
Beverage
Meat
Prepared Foods
Seafood
Chapter 10. Europe E Polylysine Analysis and Outlook
10.1. Europe E Polylysine Revenue (USD Million), by Segments (USD Million) (2021-2032)
10.1.1. Europe E Polylysine Revenue (USD Million) by Type (2021-2032)
10.1.2. Europe E Polylysine Revenue (USD Million) by Application (2021-2032)
10.1.3. Europe E Polylysine Revenue (USD Million) by Product (2021-2032)
By Type
Below 95% Content
Above 95% Content
By Application
Rice
Beverage
Meat
Prepared Foods
Seafood
Chapter 11. Asia Pacific E Polylysine Analysis and Outlook
11.1. Asia Pacific E Polylysine Revenue (USD Million), and Revenue (USD Million) by Segments (2021-2032)
11.1.1. Asia Pacific E Polylysine Revenue (USD Million) by Type (2021-2032)
11.1.2. Asia Pacific E Polylysine Revenue (USD Million) by Application (2021-2032)
11.1.3. Asia Pacific E Polylysine Revenue (USD Million) by Product (2021-2032)
By Type
Below 95% Content
Above 95% Content
By Application
Rice
Beverage
Meat
Prepared Foods
Seafood
Chapter 12. South America E Polylysine Analysis and Outlook
12.1. South America E Polylysine Revenue (USD Million), by Segments (2021-2032)
12.1.1. South America E Polylysine Revenue (USD Million) by Type (2021-2032)
12.1.2. South America E Polylysine Revenue (USD Million) by Application (2021-2032)
12.1.3. South America E Polylysine Revenue (USD Million) by Product (2021-2032)
By Type
Below 95% Content
Above 95% Content
By Application
Rice
Beverage
Meat
Prepared Foods
Seafood
Chapter 13. Middle East and Africa E Polylysine Analysis and Outlook
13.1. Middle East and Africa E Polylysine Revenue (USD Million), by Segments (2021-2032)
13.1.1. Middle East and Africa E Polylysine Revenue (USD Million) by Type (2021-2032)
13.1.2. Middle East and Africa E Polylysine Revenue (USD Million) by Application (2021-2032)
13.1.3. Middle East and Africa E Polylysine Revenue (USD Million) by Product (2021-2032)
By Type
Below 95% Content
Above 95% Content
By Application
Rice
Beverage
Meat
Prepared Foods
Seafood
Chapter 14. E Polylysine Company Profiles
14.1 Business Overview
14.2 Product Profiles
14.3 SWOT Profiles
14.5 Recent Developments
14.6 Financial Profile
List of Companies
Chengdu Jinkai Biology
Handary
Jnc-Corp
Lion King Biotechnology
Nanjing Shineking Biotech
Siveele
Yiming Biological
Zhejiang Silver Elephant Bioengineering
Zhengzhou Bainafo Bioengineering
15. Methodology and Data Sources
15.1 Customization Offerings
15.2 Subscription Services
15.3 Related Reports
15.4 Publisher Expertise
LIST OF TABLES
Table 1 Market Segmentation Analysis
Table 2 Global E Polylysine Market Share of Leading Companies, 2023
Table 3 Product Offerings of Leading Companies
Table 4 Low Growth Scenario Forecasts
Table 5 Reference Case Growth Scenario
Table 6 High Growth Case Scenario
Table 7 Global E Polylysine Revenue (USD Million) And CAGR (%) By Type (2021-2032)
Table 8 Global E Polylysine Revenue (USD Million) And CAGR (%) By Application (2021-2032)
Table 9 Global E Polylysine Revenue (USD Million) And CAGR (%) By Product (2021-2032)
Table 10 Global E Polylysine Market Revenue (USD Million) By Regions (2021-2032)
Table 11 Global E Polylysine Market Share (%) By Regions (2021-2032)
Table 12 North America E Polylysine Revenue (USD Million) By Country (2021-2032)
Table 13 Europe E Polylysine Revenue (USD Million) By Country (2021-2032)
Table 14 Asia Pacific E Polylysine Revenue (USD Million) By Country (2021-2032)
Table 15 South America E Polylysine Revenue (USD Million) By Country (2021-2032)
Table 16 Middle East and Africa E Polylysine Revenue (USD Million) By Region (2021-2032)
Table 17 North America E Polylysine Revenue (USD Million) By Type (2021-2032)
Table 18 North America E Polylysine Revenue (USD Million) By Application (2021-2032)
Table 19 North America E Polylysine Revenue (USD Million) By Product (2021-2032)
Table 20 Europe E Polylysine Revenue (USD Million) By Type (2021-2032)
Table 21 Europe E Polylysine Revenue (USD Million) By Application (2021-2032)
Table 22 Europe E Polylysine Revenue (USD Million) By Product (2021-2032)
Table 23 Asia Pacific E Polylysine Revenue (USD Million) By Type (2021-2032)
Table 24 Asia Pacific E Polylysine Revenue (USD Million) By Application (2021-2032)
Table 25 Asia Pacific E Polylysine Revenue (USD Million) By Product (2021-2032)
Table 26 South America E Polylysine Revenue (USD Million) By Type (2021-2032)
Table 27 South America E Polylysine Revenue (USD Million) By Application (2021-2032)
Table 28 South America E Polylysine Revenue (USD Million) By Product (2021-2032)
Table 29 Middle East and Africa E Polylysine Revenue (USD Million) By Type (2021-2032)
Table 30 Middle East and Africa E Polylysine Revenue (USD Million) By Application (2021-2032)
Table 31 Middle East and Africa E Polylysine Revenue (USD Million) By Product (2021-2032)
LIST OF FIGURES
Figure 1. Market Scope
Figure 2. Pricing Forecasts Per Unit, 2023- 2032
Figure 3. Porter’s Five Forces
Figure 4. Global E Polylysine Market Revenue (USD Million) By Regions (2021-2032)
Figure 5. Global E Polylysine Market Share (%) By Regions (2023)
Figure 6. North America E Polylysine Revenue (USD Million) By Country (2021-2032)
Figure 7. United States E Polylysine Revenue (USD Million) By Country (2021-2032)
Figure 8. Canada E Polylysine Revenue (USD Million) By Country (2021-2032)
Figure 9. Mexico E Polylysine Revenue (USD Million) By Country (2021-2032)
Figure 10. Europe E Polylysine Revenue (USD Million) By Country (2021-2032)
Figure 11. Germany E Polylysine Revenue (USD Million) By Country (2021-2032)
Figure 12. France E Polylysine Revenue (USD Million) By Country (2021-2032)
Figure 13. United Kingdom E Polylysine Revenue (USD Million) By Country (2021-2032)
Figure 14. Spain E Polylysine Revenue (USD Million) By Country (2021-2032)
Figure 15. Italy E Polylysine Revenue (USD Million) By Country (2021-2032)
Figure 16. Russia E Polylysine Revenue (USD Million) By Country (2021-2032)
Figure 17. Rest of Europe E Polylysine Revenue (USD Million) By Country (2021-2032)
Figure 11. Asia Pacific E Polylysine Revenue (USD Million) By Country (2021-2032)
Figure 12. China E Polylysine Revenue (USD Million) By Country (2021-2032)
Figure 13. Japan E Polylysine Revenue (USD Million) By Country (2021-2032)
Figure 14. India E Polylysine Revenue (USD Million) By Country (2021-2032)
Figure 15. South Korea E Polylysine Revenue (USD Million) By Country (2021-2032)
Figure 16. Australia E Polylysine Revenue (USD Million) By Country (2021-2032)
Figure 17. South East Asia E Polylysine Revenue (USD Million) By Country (2021-2032)
Figure 18. South America E Polylysine Revenue (USD Million) By Country (2021-2032)
Figure 19. Brazil E Polylysine Revenue (USD Million) By Country (2021-2032)
Figure 20. Argentina E Polylysine Revenue (USD Million) By Country (2021-2032)
Figure 21. Rest of Asia Pacific E Polylysine Revenue (USD Million) By Country (2021-2032)
Figure 22. Middle East and Africa E Polylysine Revenue (USD Million) By Region (2021-2032)
Figure 23. Saudi Arabia E Polylysine Revenue (USD Million) By Region (2021-2032)
Figure 24. The UAE E Polylysine Revenue (USD Million) By Region (2021-2032)
Figure 25. Rest of Middle East E Polylysine Revenue (USD Million) By Region (2021-2032)
Figure 26. South Africa E Polylysine Revenue (USD Million) By Region (2021-2032)
Figure 27. Africa E Polylysine Revenue (USD Million) By Region (2021-2032)
Figure 28. North America E Polylysine Revenue (USD Million) By Type (2021-2032)
Figure 29. North America E Polylysine Revenue (USD Million) By Application (2021-2032)
Figure 30. North America E Polylysine Revenue (USD Million) By Product (2021-2032)
Figure 31. Europe E Polylysine Revenue (USD Million) By Type (2021-2032)
Figure 32. Europe E Polylysine Revenue (USD Million) By Application (2021-2032)
Figure 33. Europe E Polylysine Revenue (USD Million) By Product (2021-2032)
Figure 34. Asia Pacific E Polylysine Revenue (USD Million) By Type (2021-2032)
Figure 35. Asia Pacific E Polylysine Revenue (USD Million) By Application (2021-2032)
Figure 36. Asia Pacific E Polylysine Revenue (USD Million) By Product (2021-2032)
Figure 37. South America E Polylysine Revenue (USD Million) By Type (2021-2032)
Figure 38. South America E Polylysine Revenue (USD Million) By Application (2021-2032)
Figure 39. South America E Polylysine Revenue (USD Million) By Product (2021-2032)
Figure 40. Middle East and Africa E Polylysine Revenue (USD Million) By Type (2021-2032)
Figure 41. Middle East and Africa E Polylysine Revenue (USD Million) By Application (2021-2032)
Figure 42. Middle East and Africa E Polylysine Revenue (USD Million) By Product (2021-2032)
By Type
Below 95% Content
Above 95% Content
By Application
Rice
Beverage
Meat
Prepared Foods
Seafood
Countries Analyzed
North America (US, Canada, Mexico)
Europe (Germany, UK, France, Spain, Italy, Russia, Rest of Europe)
Asia Pacific (China, India, Japan, South Korea, Australia, South East Asia, Rest of Asia)
South America (Brazil, Argentina, Rest of South America)
Middle East and Africa (Saudi Arabia, UAE, Rest of Middle East, South Africa, Egypt, Rest of Africa)
