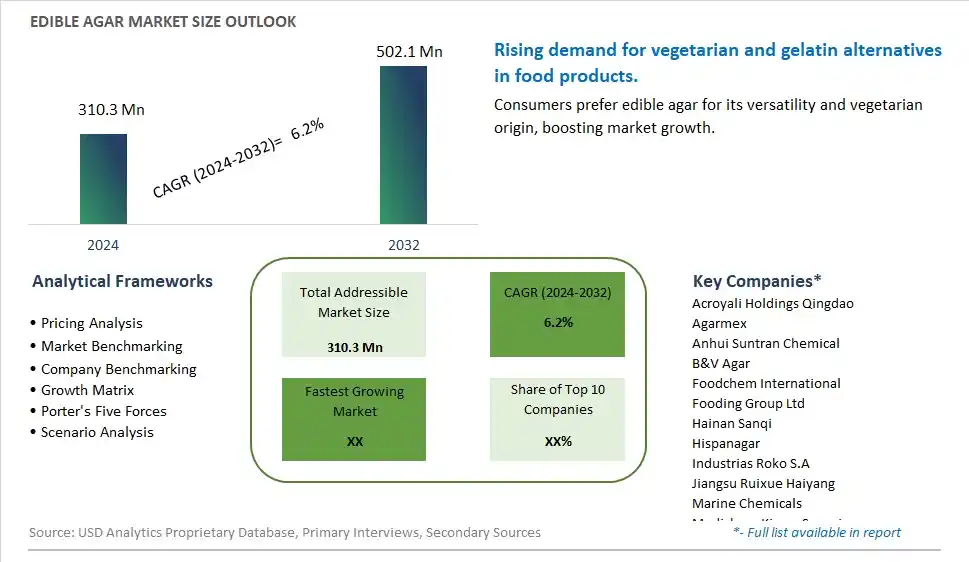
Global Edible Agar Market Size is valued at $310.3 Million in 2024 and is forecast to register a growth rate (CAGR) of 6.2% to reach $502.1 Million by 2032.
The global Edible Agar Market Comprehensive Study analyzes and forecasts the market size across 6 regions and 24 countries for diverse segments -By Type (Sugar-Free, Sugar), By Application (Drinks, Jelly, Canned Meat, Others)
An Introduction to Edible Agar Market
In 2024, the edible agar market is thriving, fueled by the demand for natural gelling agents used in food and confectionery products. Edible agar, derived from seaweed, offers excellent gelling, thickening, and stabilizing properties. The market benefits from advancements in seaweed cultivation and agar extraction technologies that enhance product purity and functionality. The trend towards clean label and natural ingredients is influencing product development. Increasing consumer interest in plant-based and vegetarian-friendly ingredients, supported by the popularity of innovative desserts and confectionery products, is further supporting market growth.
Edible Agar Competitive Landscape
The market report analyses the leading companies in the industry including Acroyali Holdings Qingdao, Agarmex, Anhui Suntran Chemical, B&V Agar, Foodchem International, Fooding Group Ltd, Hainan Sanqi, Hispanagar, Industrias Roko S.A, Jiangsu Ruixue Haiyang, Marine Chemicals, Medichem Kimya Sanayi, Wako, and Others.
Edible Agar Market Dynamics
Edible Agar Market Trend: Increasing Demand for Plant-Based Ingredients
The most prominent trend in the Edible Agar Market is the increasing demand for plant-based ingredients. Consumers are seeking vegetarian and vegan alternatives to gelatin, and agar, derived from seaweed, is becoming a popular choice. This trend is driven by the growing interest in plant-based diets and the desire for sustainable food options.
Edible Agar Market Driver: Health Consciousness and Functional Benefits
A key driver in the Edible Agar Market is health consciousness and the functional benefits of agar. As more individuals focus on improving their diet and incorporating natural ingredients, there is a rising demand for edible agar that offers dietary fiber and low-calorie content. This demand supports market growth as consumers seek health-enhancing and functional food ingredients.
Edible Agar Market Opportunity: Innovation in Food and Beverage Applications
One significant opportunity in the Edible Agar Market lies in innovation in food and beverage applications. Companies can develop new products that utilize agar in various formulations, such as desserts, jellies, and dairy alternatives, offering consumers versatile and health-focused options. By highlighting the benefits and versatility of edible agar, manufacturers can attract a broader consumer base and drive market growth.
Edible Agar Market Share Analysis- Largest Segment by Type
In the Edible Agar Market, the Sugar-Free type is the largest segment. Sugar-free agar is preferred for its versatility and suitability for various dietary needs, including low-sugar and diabetic diets. Agar, derived from seaweed, is a gelatinous substance used as a thickening agent and gelling agent in food products. The growing trend towards healthier eating and the demand for low-sugar alternatives drive the popularity of sugar-free agar. Its application in a wide range of products, from desserts to health supplements, highlights its significant role in meeting consumer preferences for sugar-free options.
Edible Agar Market Share Analysis- Poised to Grow Fastest Over the Next Five Years by Application
The Drinks application segment in the Edible Agar Market is poised to grow the fastest over the next five years. This anticipated growth is fueled by the increasing popularity of beverages that utilize agar as a thickening and stabilizing agent. Agar is used in various drink formulations, including smoothies, flavored waters, and health drinks, due to its ability to enhance texture and consistency without adding calories or sugars. The rise in health-conscious consumer behavior and the demand for innovative beverage products contribute to the rapid expansion of the drinks application segment.
Edible Agar Market Segmentation
By Type
Sugar-Free
Sugar
By Application
Drinks
Jelly
Canned Meat
Others
Countries Analyzed
North America (US, Canada, Mexico)
Europe (Germany, UK, France, Spain, Italy, Russia, Rest of Europe)
Asia Pacific (China, India, Japan, South Korea, Australia, South East Asia, Rest of Asia)
South America (Brazil, Argentina, Rest of South America)
Middle East and Africa (Saudi Arabia, UAE, Rest of Middle East, South Africa, Egypt, Rest of Africa)
Edible Agar Companies Profiled in the Study
Acroyali Holdings Qingdao
Agarmex
Anhui Suntran Chemical
B&V Agar
Foodchem International
Fooding Group Ltd
Hainan Sanqi
Hispanagar
Industrias Roko S.A
Jiangsu Ruixue Haiyang
Marine Chemicals
Medichem Kimya Sanayi
Wako
*- List Not Exhaustive
Chapter 1. TABLE OF CONTENTS
Chapter 2. Introduction to Edible Agar Market
2.1. Market Overview
2.2. Key Statistics and Report Highlights
2.3. Scope of the Comprehensive Study
2.3.1. Market Definition
2.3.2 Countries and Regions Covered
2.3.3 Research Objective
2.3.4 Units, Currency, and Conversions
2.3.5 Industry Value Chain
2.4. Key Market Segments
2.5. Key Companies
2.6. Study Period
Chapter 3. Strategic Analysis Review
3.1. Edible Agar Pricing Analysis and Forecast
3.2. Porter’s Five Forces
3.3. Market Ecosystem
3.4. SWOT Analysis
3.5. Regulatory Scenario
3.3. Effects of Inflation, Russia-Ukraine War, moderating economic growth, and other macroeconomic factors
Chapter 4. Competitive Landscape
4.1. Market Share Analysis
4.1.1. Global Edible Agar Market Share by Company, 2023
4.1.2. Product Offerings of Leading Edible Agar Companies
4.2. Market Entropy
4.2.1. New Product Launches in the Industry
4.2.2. Mergers, Acquisitions, Joint ventures, and Partnerships
4.3. Key Strategies and Best Practices
Chapter 5. Global Market Projections: Best, Reference, and Low Case Scenarios
5.1. Growth Analysis- Case Scenario Definitions
5.2. Low Growth Case Scenario Forecasts
5.3. Reference Growth Case Scenario Forecasts
5.4. High Growth Case Scenario Forecasts
Chapter 6. Market Dynamics
6.1. Edible Agar Market Drivers
6.2. Edible Agar Market Challenges
6.6. Edible Agar Market Opportunities
6.4. Edible Agar Market Trends
Chapter 7. Global Edible Agar Market Outlook Trends
7.1. Global Edible Agar Revenue (USD Million) and CAGR (%) by Type (2021-2032)
7.2. Global Edible Agar Revenue (USD Million) and CAGR (%) by Application (2021-2032)
7.3. Global Edible Agar Revenue (USD Million) and CAGR (%) by Product (2021-2032)
By Type
Sugar-Free
Sugar
By Application
Drinks
Jelly
Canned Meat
Others
Chapter 8. Global Edible Agar Regional Analysis and Outlook
8.1. Global Edible Agar Revenue (USD Million) By Regions (2021- 2032)
8.2. North America Edible Agar Revenue (USD Million) by Country (2021-2032)
8.2.1. United States Edible Agar Regional Analysis and Outlook
8.2.2. Canada Edible Agar Regional Analysis and Outlook
8.2.3. Mexico Edible Agar Regional Analysis and Outlook
8.3. Europe Edible Agar Revenue (USD Million), by Country (2021-2032)
8.3.1. Germany Edible Agar Regional Analysis and Outlook
8.3.2. France Edible Agar Regional Analysis and Outlook
8.3.3. United Kingdom Edible Agar Regional Analysis and Outlook
8.3.4. Spain Edible Agar Regional Analysis and Outlook
8.3.5. Italy Edible Agar Regional Analysis and Outlook
8.3.6. Russia Edible Agar Regional Analysis and Outlook
8.3.7. Rest of Europe Edible Agar Regional Analysis and Outlook
8.4. Asia Pacific Edible Agar Revenue (USD Million) by Country (2021-2032)
8.4.1. China Edible Agar Regional Analysis and Outlook
8.4.2. Japan Edible Agar Regional Analysis and Outlook
8.4.3. India Edible Agar Regional Analysis and Outlook
8.4.4. South Korea Edible Agar Regional Analysis and Outlook
8.4.5. Australia Edible Agar Regional Analysis and Outlook
8.4.6. South East Asia Edible Agar Regional Analysis and Outlook
8.4.7. Rest of Asia Pacific Edible Agar Regional Analysis and Outlook
8.5. South America Edible Agar Revenue (USD Million), by Country (2021-2032)
8.5.1. Brazil Edible Agar Regional Analysis and Outlook
8.5.2. Argentina Edible Agar Regional Analysis and Outlook
8.5.3. Rest of South America Edible Agar Regional Analysis and Outlook
8.6. Middle East and Africa Edible Agar Revenue (USD Million) by Country (2021-2032)
8.6.1. Middle East Edible Agar Regional Analysis and Outlook
8.6.2. Africa Edible Agar Regional Analysis and Outlook
Chapter 9. North America Edible Agar Analysis and Outlook
9.1. North America Edible Agar Revenue (USD Million) by Segments (2021-2032)
9.1.1. North America Edible Agar Revenue (USD Million) by Type (2021-2032)
9.1.2. North America Edible Agar Revenue (USD Million) by Application (2021-2032)
9.1.3. North America Edible Agar Revenue (USD Million) by Product (2021-2032)
By Type
Sugar-Free
Sugar
By Application
Drinks
Jelly
Canned Meat
Others
Chapter 10. Europe Edible Agar Analysis and Outlook
10.1. Europe Edible Agar Revenue (USD Million), by Segments (USD Million) (2021-2032)
10.1.1. Europe Edible Agar Revenue (USD Million) by Type (2021-2032)
10.1.2. Europe Edible Agar Revenue (USD Million) by Application (2021-2032)
10.1.3. Europe Edible Agar Revenue (USD Million) by Product (2021-2032)
By Type
Sugar-Free
Sugar
By Application
Drinks
Jelly
Canned Meat
Others
Chapter 11. Asia Pacific Edible Agar Analysis and Outlook
11.1. Asia Pacific Edible Agar Revenue (USD Million), and Revenue (USD Million) by Segments (2021-2032)
11.1.1. Asia Pacific Edible Agar Revenue (USD Million) by Type (2021-2032)
11.1.2. Asia Pacific Edible Agar Revenue (USD Million) by Application (2021-2032)
11.1.3. Asia Pacific Edible Agar Revenue (USD Million) by Product (2021-2032)
By Type
Sugar-Free
Sugar
By Application
Drinks
Jelly
Canned Meat
Others
Chapter 12. South America Edible Agar Analysis and Outlook
12.1. South America Edible Agar Revenue (USD Million), by Segments (2021-2032)
12.1.1. South America Edible Agar Revenue (USD Million) by Type (2021-2032)
12.1.2. South America Edible Agar Revenue (USD Million) by Application (2021-2032)
12.1.3. South America Edible Agar Revenue (USD Million) by Product (2021-2032)
By Type
Sugar-Free
Sugar
By Application
Drinks
Jelly
Canned Meat
Others
Chapter 13. Middle East and Africa Edible Agar Analysis and Outlook
13.1. Middle East and Africa Edible Agar Revenue (USD Million), by Segments (2021-2032)
13.1.1. Middle East and Africa Edible Agar Revenue (USD Million) by Type (2021-2032)
13.1.2. Middle East and Africa Edible Agar Revenue (USD Million) by Application (2021-2032)
13.1.3. Middle East and Africa Edible Agar Revenue (USD Million) by Product (2021-2032)
By Type
Sugar-Free
Sugar
By Application
Drinks
Jelly
Canned Meat
Others
Chapter 14. Edible Agar Company Profiles
14.1 Business Overview
14.2 Product Profiles
14.3 SWOT Profiles
14.5 Recent Developments
14.6 Financial Profile
List of Companies
Acroyali Holdings Qingdao
Agarmex
Anhui Suntran Chemical
B&V Agar
Foodchem International
Fooding Group Ltd
Hainan Sanqi
Hispanagar
Industrias Roko S.A
Jiangsu Ruixue Haiyang
Marine Chemicals
Medichem Kimya Sanayi
Wako
15. Methodology and Data Sources
15.1 Customization Offerings
15.2 Subscription Services
15.3 Related Reports
15.4 Publisher Expertise
LIST OF TABLES
Table 1 Market Segmentation Analysis
Table 2 Global Edible Agar Market Share of Leading Companies, 2023
Table 3 Product Offerings of Leading Companies
Table 4 Low Growth Scenario Forecasts
Table 5 Reference Case Growth Scenario
Table 6 High Growth Case Scenario
Table 7 Global Edible Agar Revenue (USD Million) And CAGR (%) By Type (2021-2032)
Table 8 Global Edible Agar Revenue (USD Million) And CAGR (%) By Application (2021-2032)
Table 9 Global Edible Agar Revenue (USD Million) And CAGR (%) By Product (2021-2032)
Table 10 Global Edible Agar Market Revenue (USD Million) By Regions (2021-2032)
Table 11 Global Edible Agar Market Share (%) By Regions (2021-2032)
Table 12 North America Edible Agar Revenue (USD Million) By Country (2021-2032)
Table 13 Europe Edible Agar Revenue (USD Million) By Country (2021-2032)
Table 14 Asia Pacific Edible Agar Revenue (USD Million) By Country (2021-2032)
Table 15 South America Edible Agar Revenue (USD Million) By Country (2021-2032)
Table 16 Middle East and Africa Edible Agar Revenue (USD Million) By Region (2021-2032)
Table 17 North America Edible Agar Revenue (USD Million) By Type (2021-2032)
Table 18 North America Edible Agar Revenue (USD Million) By Application (2021-2032)
Table 19 North America Edible Agar Revenue (USD Million) By Product (2021-2032)
Table 20 Europe Edible Agar Revenue (USD Million) By Type (2021-2032)
Table 21 Europe Edible Agar Revenue (USD Million) By Application (2021-2032)
Table 22 Europe Edible Agar Revenue (USD Million) By Product (2021-2032)
Table 23 Asia Pacific Edible Agar Revenue (USD Million) By Type (2021-2032)
Table 24 Asia Pacific Edible Agar Revenue (USD Million) By Application (2021-2032)
Table 25 Asia Pacific Edible Agar Revenue (USD Million) By Product (2021-2032)
Table 26 South America Edible Agar Revenue (USD Million) By Type (2021-2032)
Table 27 South America Edible Agar Revenue (USD Million) By Application (2021-2032)
Table 28 South America Edible Agar Revenue (USD Million) By Product (2021-2032)
Table 29 Middle East and Africa Edible Agar Revenue (USD Million) By Type (2021-2032)
Table 30 Middle East and Africa Edible Agar Revenue (USD Million) By Application (2021-2032)
Table 31 Middle East and Africa Edible Agar Revenue (USD Million) By Product (2021-2032)
LIST OF FIGURES
Figure 1. Market Scope
Figure 2. Pricing Forecasts Per Unit, 2023- 2032
Figure 3. Porter’s Five Forces
Figure 4. Global Edible Agar Market Revenue (USD Million) By Regions (2021-2032)
Figure 5. Global Edible Agar Market Share (%) By Regions (2023)
Figure 6. North America Edible Agar Revenue (USD Million) By Country (2021-2032)
Figure 7. United States Edible Agar Revenue (USD Million) By Country (2021-2032)
Figure 8. Canada Edible Agar Revenue (USD Million) By Country (2021-2032)
Figure 9. Mexico Edible Agar Revenue (USD Million) By Country (2021-2032)
Figure 10. Europe Edible Agar Revenue (USD Million) By Country (2021-2032)
Figure 11. Germany Edible Agar Revenue (USD Million) By Country (2021-2032)
Figure 12. France Edible Agar Revenue (USD Million) By Country (2021-2032)
Figure 13. United Kingdom Edible Agar Revenue (USD Million) By Country (2021-2032)
Figure 14. Spain Edible Agar Revenue (USD Million) By Country (2021-2032)
Figure 15. Italy Edible Agar Revenue (USD Million) By Country (2021-2032)
Figure 16. Russia Edible Agar Revenue (USD Million) By Country (2021-2032)
Figure 17. Rest of Europe Edible Agar Revenue (USD Million) By Country (2021-2032)
Figure 11. Asia Pacific Edible Agar Revenue (USD Million) By Country (2021-2032)
Figure 12. China Edible Agar Revenue (USD Million) By Country (2021-2032)
Figure 13. Japan Edible Agar Revenue (USD Million) By Country (2021-2032)
Figure 14. India Edible Agar Revenue (USD Million) By Country (2021-2032)
Figure 15. South Korea Edible Agar Revenue (USD Million) By Country (2021-2032)
Figure 16. Australia Edible Agar Revenue (USD Million) By Country (2021-2032)
Figure 17. South East Asia Edible Agar Revenue (USD Million) By Country (2021-2032)
Figure 18. South America Edible Agar Revenue (USD Million) By Country (2021-2032)
Figure 19. Brazil Edible Agar Revenue (USD Million) By Country (2021-2032)
Figure 20. Argentina Edible Agar Revenue (USD Million) By Country (2021-2032)
Figure 21. Rest of Asia Pacific Edible Agar Revenue (USD Million) By Country (2021-2032)
Figure 22. Middle East and Africa Edible Agar Revenue (USD Million) By Region (2021-2032)
Figure 23. Saudi Arabia Edible Agar Revenue (USD Million) By Region (2021-2032)
Figure 24. The UAE Edible Agar Revenue (USD Million) By Region (2021-2032)
Figure 25. Rest of Middle East Edible Agar Revenue (USD Million) By Region (2021-2032)
Figure 26. South Africa Edible Agar Revenue (USD Million) By Region (2021-2032)
Figure 27. Africa Edible Agar Revenue (USD Million) By Region (2021-2032)
Figure 28. North America Edible Agar Revenue (USD Million) By Type (2021-2032)
Figure 29. North America Edible Agar Revenue (USD Million) By Application (2021-2032)
Figure 30. North America Edible Agar Revenue (USD Million) By Product (2021-2032)
Figure 31. Europe Edible Agar Revenue (USD Million) By Type (2021-2032)
Figure 32. Europe Edible Agar Revenue (USD Million) By Application (2021-2032)
Figure 33. Europe Edible Agar Revenue (USD Million) By Product (2021-2032)
Figure 34. Asia Pacific Edible Agar Revenue (USD Million) By Type (2021-2032)
Figure 35. Asia Pacific Edible Agar Revenue (USD Million) By Application (2021-2032)
Figure 36. Asia Pacific Edible Agar Revenue (USD Million) By Product (2021-2032)
Figure 37. South America Edible Agar Revenue (USD Million) By Type (2021-2032)
Figure 38. South America Edible Agar Revenue (USD Million) By Application (2021-2032)
Figure 39. South America Edible Agar Revenue (USD Million) By Product (2021-2032)
Figure 40. Middle East and Africa Edible Agar Revenue (USD Million) By Type (2021-2032)
Figure 41. Middle East and Africa Edible Agar Revenue (USD Million) By Application (2021-2032)
Figure 42. Middle East and Africa Edible Agar Revenue (USD Million) By Product (2021-2032)
By Type
Sugar-Free
Sugar
By Application
Drinks
Jelly
Canned Meat
Others
Countries Analyzed
North America (US, Canada, Mexico)
Europe (Germany, UK, France, Spain, Italy, Russia, Rest of Europe)
Asia Pacific (China, India, Japan, South Korea, Australia, South East Asia, Rest of Asia)
South America (Brazil, Argentina, Rest of South America)
Middle East and Africa (Saudi Arabia, UAE, Rest of Middle East, South Africa, Egypt, Rest of Africa)
