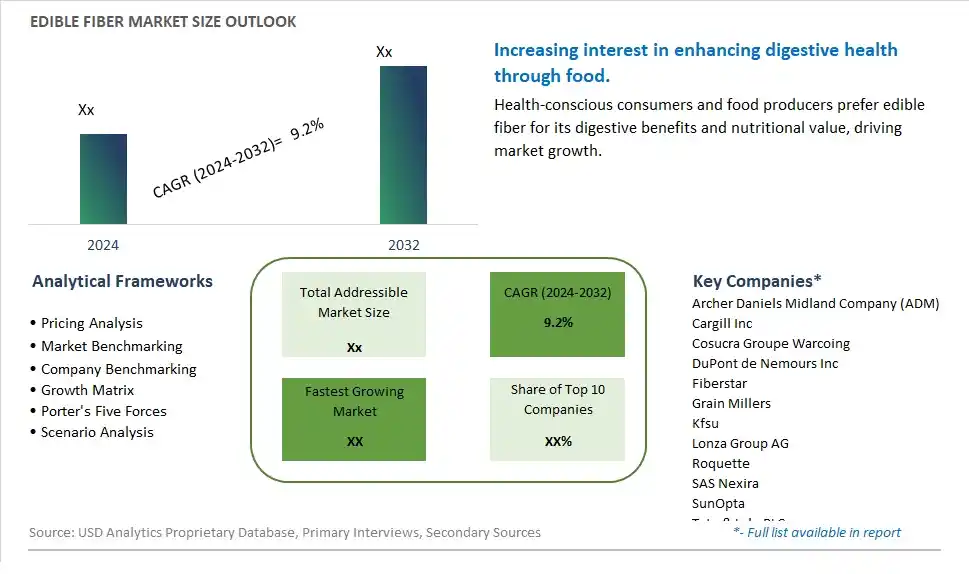
Global Edible Fiber Market Size is valued at $XX Million in 2024 and is forecast to register a growth rate (CAGR) of 9.2% to reach $XX Million by 2032.
The global Edible Fiber Market Comprehensive Study analyzes and forecasts the market size across 6 regions and 24 countries for diverse segments -By Type (Soluble Fiber, Insoluble Fiber), By Application (Food & Beverage, Bakery & Confectionery, Others)
An Introduction to Edible Fiber Market
The Edible Fiber market in 2024 is thriving, fueled by the rising consumer awareness of the health benefits of dietary fiber. Edible fibers, sourced from fruits, vegetables, grains, and legumes, are incorporated into various food products to enhance their nutritional profile. The market benefits from the growing trend of functional foods, the increasing demand for digestive health products, and the expansion of plant-based diets. Additionally, advancements in food technology and the development of innovative fiber-enriched products are driving market growth.
Edible Fiber Competitive Landscape
The market report analyses the leading companies in the industry including Archer Daniels Midland Company (ADM), Cargill Inc, Cosucra Groupe Warcoing, DuPont de Nemours Inc, Fiberstar, Grain Millers, Kfsu, Lonza Group AG, Roquette, SAS Nexira, SunOpta, Tate & Lyle PLC, VDF Futureceuticals, Z-Trim Holdings, and Others.
Edible Fiber Market Dynamics
Edible Fiber Market Trend: Rising Popularity of Functional Foods and Nutritional Supplements
The edible fiber market is experiencing a significant trend towards functional foods and nutritional supplements. Consumers are increasingly looking for foods that provide additional health benefits beyond basic nutrition, and edible fibers fit this demand perfectly. This trend is driven by a growing awareness of the role dietary fiber plays in promoting digestive health, weight management, and reducing the risk of chronic diseases. The incorporation of edible fiber into a wide range of products, from cereals and snacks to beverages and supplements, reflects this trend. As consumers seek out functional ingredients to enhance their overall well-being, the demand for edible fiber continues to rise.
Edible Fiber Market Driver: Increasing Health Consciousness and Dietary Awareness
A major driver for the edible fiber market is the increasing health consciousness and dietary awareness among consumers. As more people recognize the importance of a balanced diet rich in fiber, there is a growing demand for products that help meet daily fiber requirements. This is particularly driven by the rising prevalence of lifestyle-related health issues such as obesity, diabetes, and digestive disorders. Public health campaigns and educational initiatives that emphasize the benefits of fiber intake have further heightened consumer awareness. As a result, food manufacturers are incorporating higher fiber content into their products to cater to this health-driven demand.
Edible Fiber Market Opportunity: Innovation in Fiber-Enriched Products
The edible fiber market holds significant opportunities for innovation in fiber-enriched products. Companies can develop new and appealing fiber-rich foods and beverages, such as fiber-fortified snacks, drinks, and meal replacements, to attract health-conscious consumers. There is also potential for creating specialized products targeting specific health benefits, such as prebiotic fibers for gut health or soluble fibers for heart health. Expanding the range of fiber sources, including plant-based and exotic fibers, can further diversify product offerings. Leveraging digital marketing to educate consumers about the benefits of fiber and collaborating with nutritionists and health influencers can enhance market penetration and drive growth in the edible fiber segment.
Edible Fiber Market Share Analysis: Soluble Fiber segment generated the highest revenue share in the industry
The largest segment in the Edible Fiber Market is Soluble Fiber. Soluble fiber is renowned for its ability to dissolve in water, forming a gel-like substance that aids in digestion and offers various health benefits. It is commonly found in foods like oats, barley, legumes, fruits, and vegetables. Due to its soluble nature, this type of fiber helps regulate blood sugar levels, lower cholesterol, and promote a healthy gut environment by feeding beneficial gut bacteria. These qualities make soluble fiber a popular choice among consumers looking to improve their digestive health and manage conditions like diabetes and heart disease.
Edible Fiber Market Share Analysis: Food & Beverage is the fastest growing segment over the forecast period to 2032
The fastest-growing segment in the Edible Fiber Market is the Food & Beverage application sector. With increasing awareness of the importance of dietary fiber in maintaining overall health and wellness, food and beverage manufacturers are incorporating edible fibers into a wide range of products. These include functional foods, beverages, bakery items, snacks, and more. Consumers are actively seeking fiber-enriched products to support digestive health, weight management, and overall well-being. As a result, the demand for edible fibers in the food and beverage industry is rapidly increasing, driving significant growth in this market segment.
Edible Fiber Market Segmentation
By Type
Soluble Fiber
Insoluble Fiber
By Application
Food & Beverage
Bakery & Confectionery
Others
Countries Analyzed
North America (US, Canada, Mexico)
Europe (Germany, UK, France, Spain, Italy, Russia, Rest of Europe)
Asia Pacific (China, India, Japan, South Korea, Australia, South East Asia, Rest of Asia)
South America (Brazil, Argentina, Rest of South America)
Middle East and Africa (Saudi Arabia, UAE, Rest of Middle East, South Africa, Egypt, Rest of Africa)
Edible Fiber Companies Profiled in the Study
Archer Daniels Midland Company (ADM)
Cargill Inc
Cosucra Groupe Warcoing
DuPont de Nemours Inc
Fiberstar
Grain Millers
Kfsu
Lonza Group AG
Roquette
SAS Nexira
SunOpta
Tate & Lyle PLC
VDF Futureceuticals
Z-Trim Holdings
*- List Not Exhaustive
Chapter 1. TABLE OF CONTENTS
Chapter 2. Introduction to Edible Fiber Market
2.1. Market Overview
2.2. Key Statistics and Report Highlights
2.3. Scope of the Comprehensive Study
2.3.1. Market Definition
2.3.2 Countries and Regions Covered
2.3.3 Research Objective
2.3.4 Units, Currency, and Conversions
2.3.5 Industry Value Chain
2.4. Key Market Segments
2.5. Key Companies
2.6. Study Period
Chapter 3. Strategic Analysis Review
3.1. Edible Fiber Pricing Analysis and Forecast
3.2. Porter’s Five Forces
3.3. Market Ecosystem
3.4. SWOT Analysis
3.5. Regulatory Scenario
3.3. Effects of Inflation, Russia-Ukraine War, moderating economic growth, and other macroeconomic factors
Chapter 4. Competitive Landscape
4.1. Market Share Analysis
4.1.1. Global Edible Fiber Market Share by Company, 2023
4.1.2. Product Offerings of Leading Edible Fiber Companies
4.2. Market Entropy
4.2.1. New Product Launches in the Industry
4.2.2. Mergers, Acquisitions, Joint ventures, and Partnerships
4.3. Key Strategies and Best Practices
Chapter 5. Global Market Projections: Best, Reference, and Low Case Scenarios
5.1. Growth Analysis- Case Scenario Definitions
5.2. Low Growth Case Scenario Forecasts
5.3. Reference Growth Case Scenario Forecasts
5.4. High Growth Case Scenario Forecasts
Chapter 6. Market Dynamics
6.1. Edible Fiber Market Drivers
6.2. Edible Fiber Market Challenges
6.6. Edible Fiber Market Opportunities
6.4. Edible Fiber Market Trends
Chapter 7. Global Edible Fiber Market Outlook Trends
7.1. Global Edible Fiber Revenue (USD Million) and CAGR (%) by Type (2021-2032)
7.2. Global Edible Fiber Revenue (USD Million) and CAGR (%) by Application (2021-2032)
7.3. Global Edible Fiber Revenue (USD Million) and CAGR (%) by Product (2021-2032)
By Type
Soluble Fiber
Insoluble Fiber
By Application
Food & Beverage
Bakery & Confectionery
Others
Chapter 8. Global Edible Fiber Regional Analysis and Outlook
8.1. Global Edible Fiber Revenue (USD Million) By Regions (2021- 2032)
8.2. North America Edible Fiber Revenue (USD Million) by Country (2021-2032)
8.2.1. United States Edible Fiber Regional Analysis and Outlook
8.2.2. Canada Edible Fiber Regional Analysis and Outlook
8.2.3. Mexico Edible Fiber Regional Analysis and Outlook
8.3. Europe Edible Fiber Revenue (USD Million), by Country (2021-2032)
8.3.1. Germany Edible Fiber Regional Analysis and Outlook
8.3.2. France Edible Fiber Regional Analysis and Outlook
8.3.3. United Kingdom Edible Fiber Regional Analysis and Outlook
8.3.4. Spain Edible Fiber Regional Analysis and Outlook
8.3.5. Italy Edible Fiber Regional Analysis and Outlook
8.3.6. Russia Edible Fiber Regional Analysis and Outlook
8.3.7. Rest of Europe Edible Fiber Regional Analysis and Outlook
8.4. Asia Pacific Edible Fiber Revenue (USD Million) by Country (2021-2032)
8.4.1. China Edible Fiber Regional Analysis and Outlook
8.4.2. Japan Edible Fiber Regional Analysis and Outlook
8.4.3. India Edible Fiber Regional Analysis and Outlook
8.4.4. South Korea Edible Fiber Regional Analysis and Outlook
8.4.5. Australia Edible Fiber Regional Analysis and Outlook
8.4.6. South East Asia Edible Fiber Regional Analysis and Outlook
8.4.7. Rest of Asia Pacific Edible Fiber Regional Analysis and Outlook
8.5. South America Edible Fiber Revenue (USD Million), by Country (2021-2032)
8.5.1. Brazil Edible Fiber Regional Analysis and Outlook
8.5.2. Argentina Edible Fiber Regional Analysis and Outlook
8.5.3. Rest of South America Edible Fiber Regional Analysis and Outlook
8.6. Middle East and Africa Edible Fiber Revenue (USD Million) by Country (2021-2032)
8.6.1. Middle East Edible Fiber Regional Analysis and Outlook
8.6.2. Africa Edible Fiber Regional Analysis and Outlook
Chapter 9. North America Edible Fiber Analysis and Outlook
9.1. North America Edible Fiber Revenue (USD Million) by Segments (2021-2032)
9.1.1. North America Edible Fiber Revenue (USD Million) by Type (2021-2032)
9.1.2. North America Edible Fiber Revenue (USD Million) by Application (2021-2032)
9.1.3. North America Edible Fiber Revenue (USD Million) by Product (2021-2032)
By Type
Soluble Fiber
Insoluble Fiber
By Application
Food & Beverage
Bakery & Confectionery
Others
Chapter 10. Europe Edible Fiber Analysis and Outlook
10.1. Europe Edible Fiber Revenue (USD Million), by Segments (USD Million) (2021-2032)
10.1.1. Europe Edible Fiber Revenue (USD Million) by Type (2021-2032)
10.1.2. Europe Edible Fiber Revenue (USD Million) by Application (2021-2032)
10.1.3. Europe Edible Fiber Revenue (USD Million) by Product (2021-2032)
By Type
Soluble Fiber
Insoluble Fiber
By Application
Food & Beverage
Bakery & Confectionery
Others
Chapter 11. Asia Pacific Edible Fiber Analysis and Outlook
11.1. Asia Pacific Edible Fiber Revenue (USD Million), and Revenue (USD Million) by Segments (2021-2032)
11.1.1. Asia Pacific Edible Fiber Revenue (USD Million) by Type (2021-2032)
11.1.2. Asia Pacific Edible Fiber Revenue (USD Million) by Application (2021-2032)
11.1.3. Asia Pacific Edible Fiber Revenue (USD Million) by Product (2021-2032)
By Type
Soluble Fiber
Insoluble Fiber
By Application
Food & Beverage
Bakery & Confectionery
Others
Chapter 12. South America Edible Fiber Analysis and Outlook
12.1. South America Edible Fiber Revenue (USD Million), by Segments (2021-2032)
12.1.1. South America Edible Fiber Revenue (USD Million) by Type (2021-2032)
12.1.2. South America Edible Fiber Revenue (USD Million) by Application (2021-2032)
12.1.3. South America Edible Fiber Revenue (USD Million) by Product (2021-2032)
By Type
Soluble Fiber
Insoluble Fiber
By Application
Food & Beverage
Bakery & Confectionery
Others
Chapter 13. Middle East and Africa Edible Fiber Analysis and Outlook
13.1. Middle East and Africa Edible Fiber Revenue (USD Million), by Segments (2021-2032)
13.1.1. Middle East and Africa Edible Fiber Revenue (USD Million) by Type (2021-2032)
13.1.2. Middle East and Africa Edible Fiber Revenue (USD Million) by Application (2021-2032)
13.1.3. Middle East and Africa Edible Fiber Revenue (USD Million) by Product (2021-2032)
By Type
Soluble Fiber
Insoluble Fiber
By Application
Food & Beverage
Bakery & Confectionery
Others
Chapter 14. Edible Fiber Company Profiles
14.1 Business Overview
14.2 Product Profiles
14.3 SWOT Profiles
14.5 Recent Developments
14.6 Financial Profile
List of Companies
Archer Daniels Midland Company (ADM)
Cargill Inc
Cosucra Groupe Warcoing
DuPont de Nemours Inc
Fiberstar
Grain Millers
Kfsu
Lonza Group AG
Roquette
SAS Nexira
SunOpta
Tate & Lyle PLC
VDF Futureceuticals
Z-Trim Holdings
15. Methodology and Data Sources
15.1 Customization Offerings
15.2 Subscription Services
15.3 Related Reports
15.4 Publisher Expertise
LIST OF TABLES
Table 1 Market Segmentation Analysis
Table 2 Global Edible Fiber Market Share of Leading Companies, 2023
Table 3 Product Offerings of Leading Companies
Table 4 Low Growth Scenario Forecasts
Table 5 Reference Case Growth Scenario
Table 6 High Growth Case Scenario
Table 7 Global Edible Fiber Revenue (USD Million) And CAGR (%) By Type (2021-2032)
Table 8 Global Edible Fiber Revenue (USD Million) And CAGR (%) By Application (2021-2032)
Table 9 Global Edible Fiber Revenue (USD Million) And CAGR (%) By Product (2021-2032)
Table 10 Global Edible Fiber Market Revenue (USD Million) By Regions (2021-2032)
Table 11 Global Edible Fiber Market Share (%) By Regions (2021-2032)
Table 12 North America Edible Fiber Revenue (USD Million) By Country (2021-2032)
Table 13 Europe Edible Fiber Revenue (USD Million) By Country (2021-2032)
Table 14 Asia Pacific Edible Fiber Revenue (USD Million) By Country (2021-2032)
Table 15 South America Edible Fiber Revenue (USD Million) By Country (2021-2032)
Table 16 Middle East and Africa Edible Fiber Revenue (USD Million) By Region (2021-2032)
Table 17 North America Edible Fiber Revenue (USD Million) By Type (2021-2032)
Table 18 North America Edible Fiber Revenue (USD Million) By Application (2021-2032)
Table 19 North America Edible Fiber Revenue (USD Million) By Product (2021-2032)
Table 20 Europe Edible Fiber Revenue (USD Million) By Type (2021-2032)
Table 21 Europe Edible Fiber Revenue (USD Million) By Application (2021-2032)
Table 22 Europe Edible Fiber Revenue (USD Million) By Product (2021-2032)
Table 23 Asia Pacific Edible Fiber Revenue (USD Million) By Type (2021-2032)
Table 24 Asia Pacific Edible Fiber Revenue (USD Million) By Application (2021-2032)
Table 25 Asia Pacific Edible Fiber Revenue (USD Million) By Product (2021-2032)
Table 26 South America Edible Fiber Revenue (USD Million) By Type (2021-2032)
Table 27 South America Edible Fiber Revenue (USD Million) By Application (2021-2032)
Table 28 South America Edible Fiber Revenue (USD Million) By Product (2021-2032)
Table 29 Middle East and Africa Edible Fiber Revenue (USD Million) By Type (2021-2032)
Table 30 Middle East and Africa Edible Fiber Revenue (USD Million) By Application (2021-2032)
Table 31 Middle East and Africa Edible Fiber Revenue (USD Million) By Product (2021-2032)
LIST OF FIGURES
Figure 1. Market Scope
Figure 2. Pricing Forecasts Per Unit, 2023- 2032
Figure 3. Porter’s Five Forces
Figure 4. Global Edible Fiber Market Revenue (USD Million) By Regions (2021-2032)
Figure 5. Global Edible Fiber Market Share (%) By Regions (2023)
Figure 6. North America Edible Fiber Revenue (USD Million) By Country (2021-2032)
Figure 7. United States Edible Fiber Revenue (USD Million) By Country (2021-2032)
Figure 8. Canada Edible Fiber Revenue (USD Million) By Country (2021-2032)
Figure 9. Mexico Edible Fiber Revenue (USD Million) By Country (2021-2032)
Figure 10. Europe Edible Fiber Revenue (USD Million) By Country (2021-2032)
Figure 11. Germany Edible Fiber Revenue (USD Million) By Country (2021-2032)
Figure 12. France Edible Fiber Revenue (USD Million) By Country (2021-2032)
Figure 13. United Kingdom Edible Fiber Revenue (USD Million) By Country (2021-2032)
Figure 14. Spain Edible Fiber Revenue (USD Million) By Country (2021-2032)
Figure 15. Italy Edible Fiber Revenue (USD Million) By Country (2021-2032)
Figure 16. Russia Edible Fiber Revenue (USD Million) By Country (2021-2032)
Figure 17. Rest of Europe Edible Fiber Revenue (USD Million) By Country (2021-2032)
Figure 11. Asia Pacific Edible Fiber Revenue (USD Million) By Country (2021-2032)
Figure 12. China Edible Fiber Revenue (USD Million) By Country (2021-2032)
Figure 13. Japan Edible Fiber Revenue (USD Million) By Country (2021-2032)
Figure 14. India Edible Fiber Revenue (USD Million) By Country (2021-2032)
Figure 15. South Korea Edible Fiber Revenue (USD Million) By Country (2021-2032)
Figure 16. Australia Edible Fiber Revenue (USD Million) By Country (2021-2032)
Figure 17. South East Asia Edible Fiber Revenue (USD Million) By Country (2021-2032)
Figure 18. South America Edible Fiber Revenue (USD Million) By Country (2021-2032)
Figure 19. Brazil Edible Fiber Revenue (USD Million) By Country (2021-2032)
Figure 20. Argentina Edible Fiber Revenue (USD Million) By Country (2021-2032)
Figure 21. Rest of Asia Pacific Edible Fiber Revenue (USD Million) By Country (2021-2032)
Figure 22. Middle East and Africa Edible Fiber Revenue (USD Million) By Region (2021-2032)
Figure 23. Saudi Arabia Edible Fiber Revenue (USD Million) By Region (2021-2032)
Figure 24. The UAE Edible Fiber Revenue (USD Million) By Region (2021-2032)
Figure 25. Rest of Middle East Edible Fiber Revenue (USD Million) By Region (2021-2032)
Figure 26. South Africa Edible Fiber Revenue (USD Million) By Region (2021-2032)
Figure 27. Africa Edible Fiber Revenue (USD Million) By Region (2021-2032)
Figure 28. North America Edible Fiber Revenue (USD Million) By Type (2021-2032)
Figure 29. North America Edible Fiber Revenue (USD Million) By Application (2021-2032)
Figure 30. North America Edible Fiber Revenue (USD Million) By Product (2021-2032)
Figure 31. Europe Edible Fiber Revenue (USD Million) By Type (2021-2032)
Figure 32. Europe Edible Fiber Revenue (USD Million) By Application (2021-2032)
Figure 33. Europe Edible Fiber Revenue (USD Million) By Product (2021-2032)
Figure 34. Asia Pacific Edible Fiber Revenue (USD Million) By Type (2021-2032)
Figure 35. Asia Pacific Edible Fiber Revenue (USD Million) By Application (2021-2032)
Figure 36. Asia Pacific Edible Fiber Revenue (USD Million) By Product (2021-2032)
Figure 37. South America Edible Fiber Revenue (USD Million) By Type (2021-2032)
Figure 38. South America Edible Fiber Revenue (USD Million) By Application (2021-2032)
Figure 39. South America Edible Fiber Revenue (USD Million) By Product (2021-2032)
Figure 40. Middle East and Africa Edible Fiber Revenue (USD Million) By Type (2021-2032)
Figure 41. Middle East and Africa Edible Fiber Revenue (USD Million) By Application (2021-2032)
Figure 42. Middle East and Africa Edible Fiber Revenue (USD Million) By Product (2021-2032)
By Type
Soluble Fiber
Insoluble Fiber
By Application
Food & Beverage
Bakery & Confectionery
Others
Countries Analyzed
North America (US, Canada, Mexico)
Europe (Germany, UK, France, Spain, Italy, Russia, Rest of Europe)
Asia Pacific (China, India, Japan, South Korea, Australia, South East Asia, Rest of Asia)
South America (Brazil, Argentina, Rest of South America)
Middle East and Africa (Saudi Arabia, UAE, Rest of Middle East, South Africa, Egypt, Rest of Africa)
