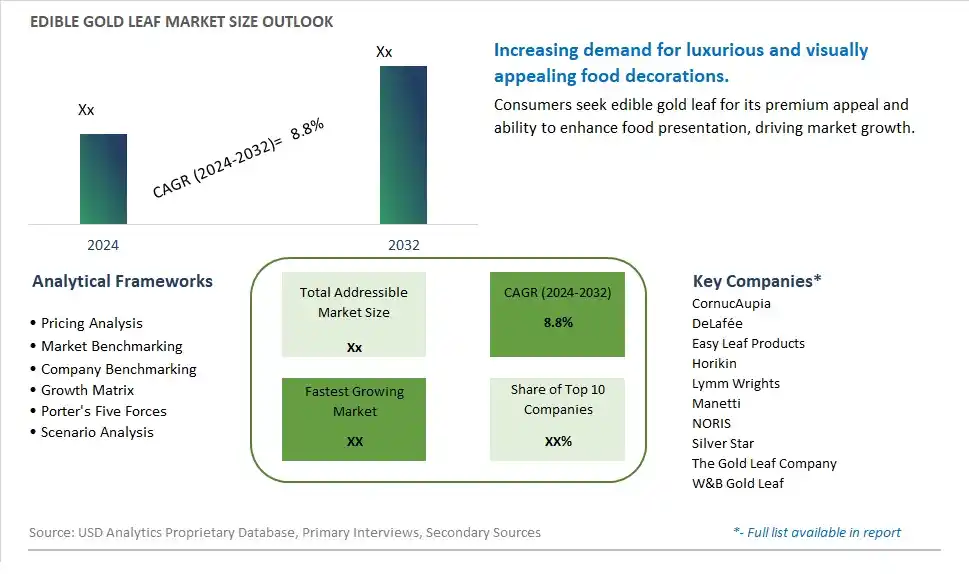
Global Edible Gold Leaf Market Size is valued at $XX Million in 2024 and is forecast to register a growth rate (CAGR) of 8.8% to reach $XX Million by 2032.
The global Edible Gold Leaf Market Comprehensive Study analyzes and forecasts the market size across 6 regions and 24 countries for diverse segments -By Purity (Below 95%, 95 to 97%, Above 97%), By Application (Food, Drinks, Cosmetics, Others)
An Introduction to Edible Gold Leaf Market
In 2024, the Edible Gold Leaf market is thriving, fueled by the rising demand for luxury and premium food decorations. Edible gold leaf, used to garnish desserts, chocolates, and gourmet dishes, is popular for its opulent appearance and safe consumption. The market benefits from the growing trend of high-end culinary experiences, the increasing popularity of luxury food items, and the expansion of the fine dining and confectionery sectors. Additionally, advancements in food decoration techniques and the rising use of edible gold in beverages and cosmetics are driving market growth.
Edible Gold Leaf Competitive Landscape
The market report analyses the leading companies in the industry including CornucAupia, DeLafée, Easy Leaf Products, Horikin, Lymm Wrights, Manetti, NORIS, Silver Star, The Gold Leaf Company, W&B Gold Leaf, and Others.
Edible Gold Leaf Market Dynamics
Edible Gold Leaf Market Trend: Growing Popularity of Luxury and Extravagant Food Presentation
The edible gold leaf market is experiencing a significant trend towards luxury and extravagant food presentation. As consumers seek unique and opulent dining experiences, the use of edible gold leaf in culinary creations has become increasingly popular. This trend is particularly prominent in high-end restaurants, patisseries, and among home chefs looking to add a touch of elegance and sophistication to their dishes. Edible gold leaf, known for its visual appeal and association with luxury, is used to decorate everything from gourmet desserts and chocolates to cocktails and fine dining plates. The trend is further fueled by the influence of social media, where visually stunning and extravagant food presentations attract significant attention and admiration.
Edible Gold Leaf Market Driver: Increasing Demand for Unique and High-End Culinary Experiences
A major driver for the edible gold leaf market is the increasing demand for unique and high-end culinary experiences. As consumers become more adventurous and discerning in their food choices, there is a growing desire for exclusive and memorable dining experiences. Edible gold leaf, with its luxurious and glamorous appeal, enhances the sensory experience of dining, making it a sought-after ingredient for special occasions, celebrations, and high-end events. The desire to create standout moments and impress guests with visually striking dishes drives the demand for edible gold leaf in both professional kitchens and home settings.
Edible Gold Leaf Market Opportunity: Expansion into Confectionery and Beverage Sectors
The edible gold leaf market holds significant opportunities for expansion into the confectionery and beverage sectors. Companies can innovate by incorporating edible gold leaf into a wide range of products, such as chocolates, candies, pastries, and luxury cocktails. Creating ready-to-use gold leaf kits for home bakers and mixologists can attract a broader audience interested in adding a touch of luxury to their homemade creations. Additionally, leveraging e-commerce platforms and premium food retailers can enhance product visibility and accessibility. Collaborations with pastry chefs, bartenders, and food influencers to showcase creative uses of edible gold leaf can further drive market growth and consumer engagement, positioning it as a must-have ingredient for upscale culinary and beverage presentations.
Edible Gold Leaf Market Share Analysis: Food is the fastest growing segment over the forecast period to 2032
The fastest growing segment in the Edible Gold Leaf Market is the Food application category. Edible gold leaf has gained significant popularity in the culinary world, especially in high-end restaurants and gourmet food industries. Its luxurious appearance and the perception of exclusivity make it a sought-after ingredient for enhancing the visual appeal of various food items, including desserts, chocolates, pastries, and beverages. As consumers increasingly seek unique and premium dining experiences, the demand for edible gold leaf in food applications has surged. Further, the growing trend of social media food influencers and aesthetically pleasing food presentations has further propelled the use of edible gold leaf as a decorative element. This segment's rapid growth is expected to continue as chefs, bakers, and food artisans explore innovative ways to elevate the visual appeal of their culinary creations, driving the Edible Gold Leaf Market towards a promising future up to 2032.
Edible Gold Leaf Market Segmentation
By Purity
Below 95%
95 to 97%
Above 97%
By Application
Food
Drinks
Cosmetics
Others
Countries Analyzed
North America (US, Canada, Mexico)
Europe (Germany, UK, France, Spain, Italy, Russia, Rest of Europe)
Asia Pacific (China, India, Japan, South Korea, Australia, South East Asia, Rest of Asia)
South America (Brazil, Argentina, Rest of South America)
Middle East and Africa (Saudi Arabia, UAE, Rest of Middle East, South Africa, Egypt, Rest of Africa)
Edible Gold Leaf Companies Profiled in the Study
CornucAupia
DeLafée
Easy Leaf Products
Horikin
Lymm Wrights
Manetti
NORIS
Silver Star
The Gold Leaf Company
W&B Gold Leaf
*- List Not Exhaustive
Chapter 1. TABLE OF CONTENTS
Chapter 2. Introduction to Edible Gold Leaf Market
2.1. Market Overview
2.2. Key Statistics and Report Highlights
2.3. Scope of the Comprehensive Study
2.3.1. Market Definition
2.3.2 Countries and Regions Covered
2.3.3 Research Objective
2.3.4 Units, Currency, and Conversions
2.3.5 Industry Value Chain
2.4. Key Market Segments
2.5. Key Companies
2.6. Study Period
Chapter 3. Strategic Analysis Review
3.1. Edible Gold Leaf Pricing Analysis and Forecast
3.2. Porter’s Five Forces
3.3. Market Ecosystem
3.4. SWOT Analysis
3.5. Regulatory Scenario
3.3. Effects of Inflation, Russia-Ukraine War, moderating economic growth, and other macroeconomic factors
Chapter 4. Competitive Landscape
4.1. Market Share Analysis
4.1.1. Global Edible Gold Leaf Market Share by Company, 2023
4.1.2. Product Offerings of Leading Edible Gold Leaf Companies
4.2. Market Entropy
4.2.1. New Product Launches in the Industry
4.2.2. Mergers, Acquisitions, Joint ventures, and Partnerships
4.3. Key Strategies and Best Practices
Chapter 5. Global Market Projections: Best, Reference, and Low Case Scenarios
5.1. Growth Analysis- Case Scenario Definitions
5.2. Low Growth Case Scenario Forecasts
5.3. Reference Growth Case Scenario Forecasts
5.4. High Growth Case Scenario Forecasts
Chapter 6. Market Dynamics
6.1. Edible Gold Leaf Market Drivers
6.2. Edible Gold Leaf Market Challenges
6.6. Edible Gold Leaf Market Opportunities
6.4. Edible Gold Leaf Market Trends
Chapter 7. Global Edible Gold Leaf Market Outlook Trends
7.1. Global Edible Gold Leaf Revenue (USD Million) and CAGR (%) by Type (2021-2032)
7.2. Global Edible Gold Leaf Revenue (USD Million) and CAGR (%) by Application (2021-2032)
7.3. Global Edible Gold Leaf Revenue (USD Million) and CAGR (%) by Product (2021-2032)
By Purity
Below 95%
95 to 97%
Above 97%
By Application
Food
Drinks
Cosmetics
Others
Chapter 8. Global Edible Gold Leaf Regional Analysis and Outlook
8.1. Global Edible Gold Leaf Revenue (USD Million) By Regions (2021- 2032)
8.2. North America Edible Gold Leaf Revenue (USD Million) by Country (2021-2032)
8.2.1. United States Edible Gold Leaf Regional Analysis and Outlook
8.2.2. Canada Edible Gold Leaf Regional Analysis and Outlook
8.2.3. Mexico Edible Gold Leaf Regional Analysis and Outlook
8.3. Europe Edible Gold Leaf Revenue (USD Million), by Country (2021-2032)
8.3.1. Germany Edible Gold Leaf Regional Analysis and Outlook
8.3.2. France Edible Gold Leaf Regional Analysis and Outlook
8.3.3. United Kingdom Edible Gold Leaf Regional Analysis and Outlook
8.3.4. Spain Edible Gold Leaf Regional Analysis and Outlook
8.3.5. Italy Edible Gold Leaf Regional Analysis and Outlook
8.3.6. Russia Edible Gold Leaf Regional Analysis and Outlook
8.3.7. Rest of Europe Edible Gold Leaf Regional Analysis and Outlook
8.4. Asia Pacific Edible Gold Leaf Revenue (USD Million) by Country (2021-2032)
8.4.1. China Edible Gold Leaf Regional Analysis and Outlook
8.4.2. Japan Edible Gold Leaf Regional Analysis and Outlook
8.4.3. India Edible Gold Leaf Regional Analysis and Outlook
8.4.4. South Korea Edible Gold Leaf Regional Analysis and Outlook
8.4.5. Australia Edible Gold Leaf Regional Analysis and Outlook
8.4.6. South East Asia Edible Gold Leaf Regional Analysis and Outlook
8.4.7. Rest of Asia Pacific Edible Gold Leaf Regional Analysis and Outlook
8.5. South America Edible Gold Leaf Revenue (USD Million), by Country (2021-2032)
8.5.1. Brazil Edible Gold Leaf Regional Analysis and Outlook
8.5.2. Argentina Edible Gold Leaf Regional Analysis and Outlook
8.5.3. Rest of South America Edible Gold Leaf Regional Analysis and Outlook
8.6. Middle East and Africa Edible Gold Leaf Revenue (USD Million) by Country (2021-2032)
8.6.1. Middle East Edible Gold Leaf Regional Analysis and Outlook
8.6.2. Africa Edible Gold Leaf Regional Analysis and Outlook
Chapter 9. North America Edible Gold Leaf Analysis and Outlook
9.1. North America Edible Gold Leaf Revenue (USD Million) by Segments (2021-2032)
9.1.1. North America Edible Gold Leaf Revenue (USD Million) by Type (2021-2032)
9.1.2. North America Edible Gold Leaf Revenue (USD Million) by Application (2021-2032)
9.1.3. North America Edible Gold Leaf Revenue (USD Million) by Product (2021-2032)
By Purity
Below 95%
95 to 97%
Above 97%
By Application
Food
Drinks
Cosmetics
Others
Chapter 10. Europe Edible Gold Leaf Analysis and Outlook
10.1. Europe Edible Gold Leaf Revenue (USD Million), by Segments (USD Million) (2021-2032)
10.1.1. Europe Edible Gold Leaf Revenue (USD Million) by Type (2021-2032)
10.1.2. Europe Edible Gold Leaf Revenue (USD Million) by Application (2021-2032)
10.1.3. Europe Edible Gold Leaf Revenue (USD Million) by Product (2021-2032)
By Purity
Below 95%
95 to 97%
Above 97%
By Application
Food
Drinks
Cosmetics
Others
Chapter 11. Asia Pacific Edible Gold Leaf Analysis and Outlook
11.1. Asia Pacific Edible Gold Leaf Revenue (USD Million), and Revenue (USD Million) by Segments (2021-2032)
11.1.1. Asia Pacific Edible Gold Leaf Revenue (USD Million) by Type (2021-2032)
11.1.2. Asia Pacific Edible Gold Leaf Revenue (USD Million) by Application (2021-2032)
11.1.3. Asia Pacific Edible Gold Leaf Revenue (USD Million) by Product (2021-2032)
By Purity
Below 95%
95 to 97%
Above 97%
By Application
Food
Drinks
Cosmetics
Others
Chapter 12. South America Edible Gold Leaf Analysis and Outlook
12.1. South America Edible Gold Leaf Revenue (USD Million), by Segments (2021-2032)
12.1.1. South America Edible Gold Leaf Revenue (USD Million) by Type (2021-2032)
12.1.2. South America Edible Gold Leaf Revenue (USD Million) by Application (2021-2032)
12.1.3. South America Edible Gold Leaf Revenue (USD Million) by Product (2021-2032)
By Purity
Below 95%
95 to 97%
Above 97%
By Application
Food
Drinks
Cosmetics
Others
Chapter 13. Middle East and Africa Edible Gold Leaf Analysis and Outlook
13.1. Middle East and Africa Edible Gold Leaf Revenue (USD Million), by Segments (2021-2032)
13.1.1. Middle East and Africa Edible Gold Leaf Revenue (USD Million) by Type (2021-2032)
13.1.2. Middle East and Africa Edible Gold Leaf Revenue (USD Million) by Application (2021-2032)
13.1.3. Middle East and Africa Edible Gold Leaf Revenue (USD Million) by Product (2021-2032)
By Purity
Below 95%
95 to 97%
Above 97%
By Application
Food
Drinks
Cosmetics
Others
Chapter 14. Edible Gold Leaf Company Profiles
14.1 Business Overview
14.2 Product Profiles
14.3 SWOT Profiles
14.5 Recent Developments
14.6 Financial Profile
List of Companies
CornucAupia
DeLafée
Easy Leaf Products
Horikin
Lymm Wrights
Manetti
NORIS
Silver Star
The Gold Leaf Company
W&B Gold Leaf
15. Methodology and Data Sources
15.1 Customization Offerings
15.2 Subscription Services
15.3 Related Reports
15.4 Publisher Expertise
LIST OF TABLES
Table 1 Market Segmentation Analysis
Table 2 Global Edible Gold Leaf Market Share of Leading Companies, 2023
Table 3 Product Offerings of Leading Companies
Table 4 Low Growth Scenario Forecasts
Table 5 Reference Case Growth Scenario
Table 6 High Growth Case Scenario
Table 7 Global Edible Gold Leaf Revenue (USD Million) And CAGR (%) By Type (2021-2032)
Table 8 Global Edible Gold Leaf Revenue (USD Million) And CAGR (%) By Application (2021-2032)
Table 9 Global Edible Gold Leaf Revenue (USD Million) And CAGR (%) By Product (2021-2032)
Table 10 Global Edible Gold Leaf Market Revenue (USD Million) By Regions (2021-2032)
Table 11 Global Edible Gold Leaf Market Share (%) By Regions (2021-2032)
Table 12 North America Edible Gold Leaf Revenue (USD Million) By Country (2021-2032)
Table 13 Europe Edible Gold Leaf Revenue (USD Million) By Country (2021-2032)
Table 14 Asia Pacific Edible Gold Leaf Revenue (USD Million) By Country (2021-2032)
Table 15 South America Edible Gold Leaf Revenue (USD Million) By Country (2021-2032)
Table 16 Middle East and Africa Edible Gold Leaf Revenue (USD Million) By Region (2021-2032)
Table 17 North America Edible Gold Leaf Revenue (USD Million) By Type (2021-2032)
Table 18 North America Edible Gold Leaf Revenue (USD Million) By Application (2021-2032)
Table 19 North America Edible Gold Leaf Revenue (USD Million) By Product (2021-2032)
Table 20 Europe Edible Gold Leaf Revenue (USD Million) By Type (2021-2032)
Table 21 Europe Edible Gold Leaf Revenue (USD Million) By Application (2021-2032)
Table 22 Europe Edible Gold Leaf Revenue (USD Million) By Product (2021-2032)
Table 23 Asia Pacific Edible Gold Leaf Revenue (USD Million) By Type (2021-2032)
Table 24 Asia Pacific Edible Gold Leaf Revenue (USD Million) By Application (2021-2032)
Table 25 Asia Pacific Edible Gold Leaf Revenue (USD Million) By Product (2021-2032)
Table 26 South America Edible Gold Leaf Revenue (USD Million) By Type (2021-2032)
Table 27 South America Edible Gold Leaf Revenue (USD Million) By Application (2021-2032)
Table 28 South America Edible Gold Leaf Revenue (USD Million) By Product (2021-2032)
Table 29 Middle East and Africa Edible Gold Leaf Revenue (USD Million) By Type (2021-2032)
Table 30 Middle East and Africa Edible Gold Leaf Revenue (USD Million) By Application (2021-2032)
Table 31 Middle East and Africa Edible Gold Leaf Revenue (USD Million) By Product (2021-2032)
LIST OF FIGURES
Figure 1. Market Scope
Figure 2. Pricing Forecasts Per Unit, 2023- 2032
Figure 3. Porter’s Five Forces
Figure 4. Global Edible Gold Leaf Market Revenue (USD Million) By Regions (2021-2032)
Figure 5. Global Edible Gold Leaf Market Share (%) By Regions (2023)
Figure 6. North America Edible Gold Leaf Revenue (USD Million) By Country (2021-2032)
Figure 7. United States Edible Gold Leaf Revenue (USD Million) By Country (2021-2032)
Figure 8. Canada Edible Gold Leaf Revenue (USD Million) By Country (2021-2032)
Figure 9. Mexico Edible Gold Leaf Revenue (USD Million) By Country (2021-2032)
Figure 10. Europe Edible Gold Leaf Revenue (USD Million) By Country (2021-2032)
Figure 11. Germany Edible Gold Leaf Revenue (USD Million) By Country (2021-2032)
Figure 12. France Edible Gold Leaf Revenue (USD Million) By Country (2021-2032)
Figure 13. United Kingdom Edible Gold Leaf Revenue (USD Million) By Country (2021-2032)
Figure 14. Spain Edible Gold Leaf Revenue (USD Million) By Country (2021-2032)
Figure 15. Italy Edible Gold Leaf Revenue (USD Million) By Country (2021-2032)
Figure 16. Russia Edible Gold Leaf Revenue (USD Million) By Country (2021-2032)
Figure 17. Rest of Europe Edible Gold Leaf Revenue (USD Million) By Country (2021-2032)
Figure 11. Asia Pacific Edible Gold Leaf Revenue (USD Million) By Country (2021-2032)
Figure 12. China Edible Gold Leaf Revenue (USD Million) By Country (2021-2032)
Figure 13. Japan Edible Gold Leaf Revenue (USD Million) By Country (2021-2032)
Figure 14. India Edible Gold Leaf Revenue (USD Million) By Country (2021-2032)
Figure 15. South Korea Edible Gold Leaf Revenue (USD Million) By Country (2021-2032)
Figure 16. Australia Edible Gold Leaf Revenue (USD Million) By Country (2021-2032)
Figure 17. South East Asia Edible Gold Leaf Revenue (USD Million) By Country (2021-2032)
Figure 18. South America Edible Gold Leaf Revenue (USD Million) By Country (2021-2032)
Figure 19. Brazil Edible Gold Leaf Revenue (USD Million) By Country (2021-2032)
Figure 20. Argentina Edible Gold Leaf Revenue (USD Million) By Country (2021-2032)
Figure 21. Rest of Asia Pacific Edible Gold Leaf Revenue (USD Million) By Country (2021-2032)
Figure 22. Middle East and Africa Edible Gold Leaf Revenue (USD Million) By Region (2021-2032)
Figure 23. Saudi Arabia Edible Gold Leaf Revenue (USD Million) By Region (2021-2032)
Figure 24. The UAE Edible Gold Leaf Revenue (USD Million) By Region (2021-2032)
Figure 25. Rest of Middle East Edible Gold Leaf Revenue (USD Million) By Region (2021-2032)
Figure 26. South Africa Edible Gold Leaf Revenue (USD Million) By Region (2021-2032)
Figure 27. Africa Edible Gold Leaf Revenue (USD Million) By Region (2021-2032)
Figure 28. North America Edible Gold Leaf Revenue (USD Million) By Type (2021-2032)
Figure 29. North America Edible Gold Leaf Revenue (USD Million) By Application (2021-2032)
Figure 30. North America Edible Gold Leaf Revenue (USD Million) By Product (2021-2032)
Figure 31. Europe Edible Gold Leaf Revenue (USD Million) By Type (2021-2032)
Figure 32. Europe Edible Gold Leaf Revenue (USD Million) By Application (2021-2032)
Figure 33. Europe Edible Gold Leaf Revenue (USD Million) By Product (2021-2032)
Figure 34. Asia Pacific Edible Gold Leaf Revenue (USD Million) By Type (2021-2032)
Figure 35. Asia Pacific Edible Gold Leaf Revenue (USD Million) By Application (2021-2032)
Figure 36. Asia Pacific Edible Gold Leaf Revenue (USD Million) By Product (2021-2032)
Figure 37. South America Edible Gold Leaf Revenue (USD Million) By Type (2021-2032)
Figure 38. South America Edible Gold Leaf Revenue (USD Million) By Application (2021-2032)
Figure 39. South America Edible Gold Leaf Revenue (USD Million) By Product (2021-2032)
Figure 40. Middle East and Africa Edible Gold Leaf Revenue (USD Million) By Type (2021-2032)
Figure 41. Middle East and Africa Edible Gold Leaf Revenue (USD Million) By Application (2021-2032)
Figure 42. Middle East and Africa Edible Gold Leaf Revenue (USD Million) By Product (2021-2032)
By Purity
Below 95%
95 to 97%
Above 97%
By Application
Food
Drinks
Cosmetics
Others
Countries Analyzed
North America (US, Canada, Mexico)
Europe (Germany, UK, France, Spain, Italy, Russia, Rest of Europe)
Asia Pacific (China, India, Japan, South Korea, Australia, South East Asia, Rest of Asia)
South America (Brazil, Argentina, Rest of South America)
Middle East and Africa (Saudi Arabia, UAE, Rest of Middle East, South Africa, Egypt, Rest of Africa)
