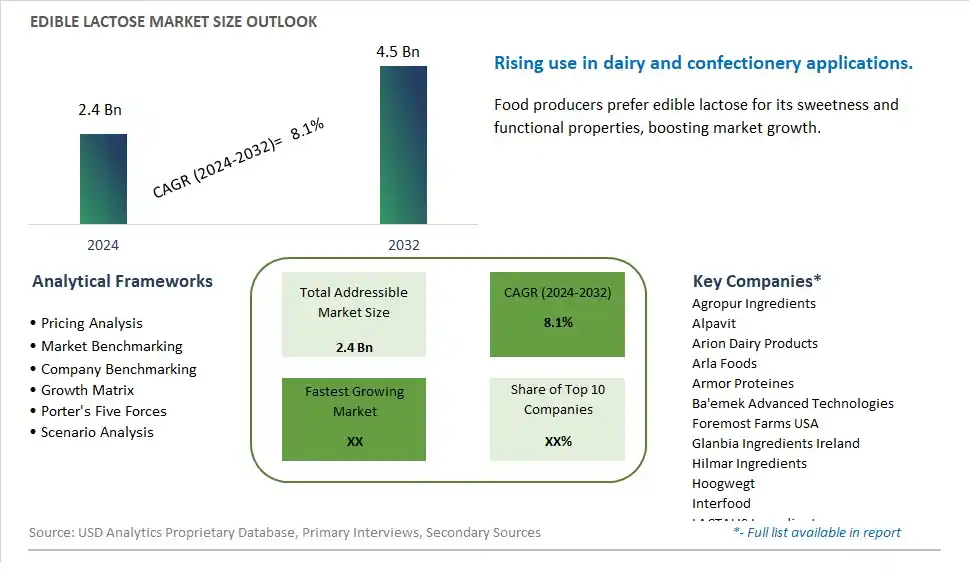
Global Edible Lactose Market Size is valued at $2.4 Billion in 2024 and is forecast to register a growth rate (CAGR) of 8.1% to reach $4.5 Billion by 2032.
The global Edible Lactose Market Comprehensive Study analyzes and forecasts the market size across 6 regions and 24 countries for diverse segments -By Mesh Size (60 to 120, 160 to 200), By Application (Chocolate, Infant Nutrition, Seasonings, Bakery, Confectionary)
An Introduction to Edible Lactose Market
The Edible Lactose market in 2024 is witnessing steady growth, driven by its widespread use as a functional ingredient in the food and pharmaceutical industries. Edible lactose, derived from milk, is valued for its mild sweetness, solubility, and nutritional benefits, making it a key ingredient in bakery products, confectioneries, and dairy products. The market benefits from the increasing demand for lactose as a filler and stabilizer in pharmaceuticals, the growing popularity of dairy products, and advancements in lactose extraction and processing technologies. Additionally, the rising trend of health and wellness is contributing to market expansion.
Edible Lactose Competitive Landscape
The market report analyses the leading companies in the industry including Agropur Ingredients, Alpavit, Arion Dairy Products, Arla Foods, Armor Proteines, Ba'emek Advanced Technologies, Foremost Farms USA, Glanbia Ingredients Ireland, Hilmar Ingredients, Hoogwegt, Interfood, LACTALIS Ingredients, Leprino Foods, NZMP, PARAS, Polmlek Group, Volac, Wisconsin Whey Protein, and Others.
Edible Lactose Market Dynamics
Edible Lactose Market Trend: Increasing Demand for Lactose-Free and Digestive Health Products
The edible lactose market is experiencing a significant trend towards lactose-free and digestive health products. As awareness about lactose intolerance and digestive health issues grows, consumers are increasingly seeking lactose-free alternatives and products that support gut health. This trend is driving innovation in the food and beverage industry, with manufacturers developing a variety of lactose-free dairy products, including milk, cheese, yogurt, and ice cream. Additionally, there is a rising interest in products fortified with probiotics and other ingredients that promote digestive health, further boosting the demand for edible lactose in various formulations.
Edible Lactose Market Driver: Rising Incidence of Lactose Intolerance
A major driver for the edible lactose market is the rising incidence of lactose intolerance worldwide. A significant portion of the global population experiences discomfort or adverse reactions when consuming lactose, the natural sugar found in milk and dairy products. This has led to an increased demand for lactose-free products, as consumers seek alternatives that allow them to enjoy dairy without the associated digestive issues. The growing awareness of lactose intolerance, coupled with the availability of lactose-free options in supermarkets and restaurants, is driving the market for edible lactose, particularly in regions with high prevalence rates of lactose intolerance.
Edible Lactose Market Opportunity: Innovation in Lactose-Free Product Development
The edible lactose market holds significant opportunities for innovation in lactose-free product development. Companies can capitalize on this by creating new and improved lactose-free dairy products that cater to a variety of tastes and dietary needs. Innovations could include developing lactose-free versions of traditionally lactose-containing foods, such as bakery items, desserts, and snacks. Additionally, there is potential for expanding into non-dairy alternatives that use lactose-free formulations, appealing to both lactose-intolerant consumers and those who prefer plant-based options. Leveraging digital marketing and e-commerce platforms to reach health-conscious consumers and providing educational content about the benefits of lactose-free products can further drive market growth and consumer engagement.
Edible Lactose Market Share Analysis: 160 to 200 is the fastest growing segment over the forecast period to 2032
The fastest growing segment in the Edible Lactose Market is the 160 to 200 mesh size category. Edible lactose, a widely used ingredient in the food and pharmaceutical industries, is processed into different mesh sizes for various applications. The 160 to 200 mesh size range is particularly witnessing rapid growth due to its versatility and suitability for a wide range of products. This finer mesh size is often preferred in food formulations for its excellent solubility, which makes it ideal for use in beverages, dairy products, confectionery, and nutritional supplements. Additionally, pharmaceutical companies utilize this mesh size for creating tablets, capsules, and powdered medications. The increased demand for lactose in these sectors, driven by factors such as growing health awareness, dietary supplement consumption, and innovations in food and pharmaceutical formulations, is driving the fast growth of the 160 to 200 mesh size segment within the Edible Lactose Market.
Edible Lactose Market Share Analysis: Infant Nutrition is the fastest growing segment over the forecast period to 2032
The fastest growing segment in the Edible Lactose Market is the application in infant nutrition. Edible lactose plays a crucial role in infant formula and baby food products, where it serves as a primary source of carbohydrate and energy for growing infants. The demand for infant nutrition products containing lactose is witnessing rapid growth due to several factors. Firstly, there is a growing awareness among parents and caregivers regarding the nutritional benefits of lactose for infants, including its role in promoting healthy gut flora and aiding in digestion. Further, with the increasing focus on natural and wholesome ingredients in baby food formulations, lactose, being a naturally occurring sugar found in milk, is preferred over artificial sweeteners or substitutes. Additionally, advancements in infant formula technology and the introduction of specialized products catering to specific nutritional needs of infants further contribute to the growth of the edible lactose market in infant nutrition applications. This segment's fast growth is expected to continue until 2032, driven by ongoing research and development efforts aimed at enhancing the nutritional profile of infant nutrition products containing lactose.
Edible Lactose Market Segmentation
By Mesh Size
60 to 120
160 to 200
By Application
Chocolate
Infant Nutrition
Seasonings
Bakery
Confectionary
Countries Analyzed
North America (US, Canada, Mexico)
Europe (Germany, UK, France, Spain, Italy, Russia, Rest of Europe)
Asia Pacific (China, India, Japan, South Korea, Australia, South East Asia, Rest of Asia)
South America (Brazil, Argentina, Rest of South America)
Middle East and Africa (Saudi Arabia, UAE, Rest of Middle East, South Africa, Egypt, Rest of Africa)
Edible Lactose Companies Profiled in the Study
Agropur Ingredients
Alpavit
Arion Dairy Products
Arla Foods
Armor Proteines
Ba'emek Advanced Technologies
Foremost Farms USA
Glanbia Ingredients Ireland
Hilmar Ingredients
Hoogwegt
Interfood
LACTALIS Ingredients
Leprino Foods
NZMP
PARAS
Polmlek Group
Volac
Wisconsin Whey Protein
*- List Not Exhaustive
Chapter 1. TABLE OF CONTENTS
Chapter 2. Introduction to Edible Lactose Market
2.1. Market Overview
2.2. Key Statistics and Report Highlights
2.3. Scope of the Comprehensive Study
2.3.1. Market Definition
2.3.2 Countries and Regions Covered
2.3.3 Research Objective
2.3.4 Units, Currency, and Conversions
2.3.5 Industry Value Chain
2.4. Key Market Segments
2.5. Key Companies
2.6. Study Period
Chapter 3. Strategic Analysis Review
3.1. Edible Lactose Pricing Analysis and Forecast
3.2. Porter’s Five Forces
3.3. Market Ecosystem
3.4. SWOT Analysis
3.5. Regulatory Scenario
3.3. Effects of Inflation, Russia-Ukraine War, moderating economic growth, and other macroeconomic factors
Chapter 4. Competitive Landscape
4.1. Market Share Analysis
4.1.1. Global Edible Lactose Market Share by Company, 2023
4.1.2. Product Offerings of Leading Edible Lactose Companies
4.2. Market Entropy
4.2.1. New Product Launches in the Industry
4.2.2. Mergers, Acquisitions, Joint ventures, and Partnerships
4.3. Key Strategies and Best Practices
Chapter 5. Global Market Projections: Best, Reference, and Low Case Scenarios
5.1. Growth Analysis- Case Scenario Definitions
5.2. Low Growth Case Scenario Forecasts
5.3. Reference Growth Case Scenario Forecasts
5.4. High Growth Case Scenario Forecasts
Chapter 6. Market Dynamics
6.1. Edible Lactose Market Drivers
6.2. Edible Lactose Market Challenges
6.6. Edible Lactose Market Opportunities
6.4. Edible Lactose Market Trends
Chapter 7. Global Edible Lactose Market Outlook Trends
7.1. Global Edible Lactose Revenue (USD Million) and CAGR (%) by Type (2021-2032)
7.2. Global Edible Lactose Revenue (USD Million) and CAGR (%) by Application (2021-2032)
7.3. Global Edible Lactose Revenue (USD Million) and CAGR (%) by Product (2021-2032)
By Mesh Size
60 to 120
160 to 200
By Application
Chocolate
Infant Nutrition
Seasonings
Bakery
Confectionary
Chapter 8. Global Edible Lactose Regional Analysis and Outlook
8.1. Global Edible Lactose Revenue (USD Million) By Regions (2021- 2032)
8.2. North America Edible Lactose Revenue (USD Million) by Country (2021-2032)
8.2.1. United States Edible Lactose Regional Analysis and Outlook
8.2.2. Canada Edible Lactose Regional Analysis and Outlook
8.2.3. Mexico Edible Lactose Regional Analysis and Outlook
8.3. Europe Edible Lactose Revenue (USD Million), by Country (2021-2032)
8.3.1. Germany Edible Lactose Regional Analysis and Outlook
8.3.2. France Edible Lactose Regional Analysis and Outlook
8.3.3. United Kingdom Edible Lactose Regional Analysis and Outlook
8.3.4. Spain Edible Lactose Regional Analysis and Outlook
8.3.5. Italy Edible Lactose Regional Analysis and Outlook
8.3.6. Russia Edible Lactose Regional Analysis and Outlook
8.3.7. Rest of Europe Edible Lactose Regional Analysis and Outlook
8.4. Asia Pacific Edible Lactose Revenue (USD Million) by Country (2021-2032)
8.4.1. China Edible Lactose Regional Analysis and Outlook
8.4.2. Japan Edible Lactose Regional Analysis and Outlook
8.4.3. India Edible Lactose Regional Analysis and Outlook
8.4.4. South Korea Edible Lactose Regional Analysis and Outlook
8.4.5. Australia Edible Lactose Regional Analysis and Outlook
8.4.6. South East Asia Edible Lactose Regional Analysis and Outlook
8.4.7. Rest of Asia Pacific Edible Lactose Regional Analysis and Outlook
8.5. South America Edible Lactose Revenue (USD Million), by Country (2021-2032)
8.5.1. Brazil Edible Lactose Regional Analysis and Outlook
8.5.2. Argentina Edible Lactose Regional Analysis and Outlook
8.5.3. Rest of South America Edible Lactose Regional Analysis and Outlook
8.6. Middle East and Africa Edible Lactose Revenue (USD Million) by Country (2021-2032)
8.6.1. Middle East Edible Lactose Regional Analysis and Outlook
8.6.2. Africa Edible Lactose Regional Analysis and Outlook
Chapter 9. North America Edible Lactose Analysis and Outlook
9.1. North America Edible Lactose Revenue (USD Million) by Segments (2021-2032)
9.1.1. North America Edible Lactose Revenue (USD Million) by Type (2021-2032)
9.1.2. North America Edible Lactose Revenue (USD Million) by Application (2021-2032)
9.1.3. North America Edible Lactose Revenue (USD Million) by Product (2021-2032)
By Mesh Size
60 to 120
160 to 200
By Application
Chocolate
Infant Nutrition
Seasonings
Bakery
Confectionary
Chapter 10. Europe Edible Lactose Analysis and Outlook
10.1. Europe Edible Lactose Revenue (USD Million), by Segments (USD Million) (2021-2032)
10.1.1. Europe Edible Lactose Revenue (USD Million) by Type (2021-2032)
10.1.2. Europe Edible Lactose Revenue (USD Million) by Application (2021-2032)
10.1.3. Europe Edible Lactose Revenue (USD Million) by Product (2021-2032)
By Mesh Size
60 to 120
160 to 200
By Application
Chocolate
Infant Nutrition
Seasonings
Bakery
Confectionary
Chapter 11. Asia Pacific Edible Lactose Analysis and Outlook
11.1. Asia Pacific Edible Lactose Revenue (USD Million), and Revenue (USD Million) by Segments (2021-2032)
11.1.1. Asia Pacific Edible Lactose Revenue (USD Million) by Type (2021-2032)
11.1.2. Asia Pacific Edible Lactose Revenue (USD Million) by Application (2021-2032)
11.1.3. Asia Pacific Edible Lactose Revenue (USD Million) by Product (2021-2032)
By Mesh Size
60 to 120
160 to 200
By Application
Chocolate
Infant Nutrition
Seasonings
Bakery
Confectionary
Chapter 12. South America Edible Lactose Analysis and Outlook
12.1. South America Edible Lactose Revenue (USD Million), by Segments (2021-2032)
12.1.1. South America Edible Lactose Revenue (USD Million) by Type (2021-2032)
12.1.2. South America Edible Lactose Revenue (USD Million) by Application (2021-2032)
12.1.3. South America Edible Lactose Revenue (USD Million) by Product (2021-2032)
By Mesh Size
60 to 120
160 to 200
By Application
Chocolate
Infant Nutrition
Seasonings
Bakery
Confectionary
Chapter 13. Middle East and Africa Edible Lactose Analysis and Outlook
13.1. Middle East and Africa Edible Lactose Revenue (USD Million), by Segments (2021-2032)
13.1.1. Middle East and Africa Edible Lactose Revenue (USD Million) by Type (2021-2032)
13.1.2. Middle East and Africa Edible Lactose Revenue (USD Million) by Application (2021-2032)
13.1.3. Middle East and Africa Edible Lactose Revenue (USD Million) by Product (2021-2032)
By Mesh Size
60 to 120
160 to 200
By Application
Chocolate
Infant Nutrition
Seasonings
Bakery
Confectionary
Chapter 14. Edible Lactose Company Profiles
14.1 Business Overview
14.2 Product Profiles
14.3 SWOT Profiles
14.5 Recent Developments
14.6 Financial Profile
List of Companies
Agropur Ingredients
Alpavit
Arion Dairy Products
Arla Foods
Armor Proteines
Ba'emek Advanced Technologies
Foremost Farms USA
Glanbia Ingredients Ireland
Hilmar Ingredients
Hoogwegt
Interfood
LACTALIS Ingredients
Leprino Foods
NZMP
PARAS
Polmlek Group
Volac
Wisconsin Whey Protein
15. Methodology and Data Sources
15.1 Customization Offerings
15.2 Subscription Services
15.3 Related Reports
15.4 Publisher Expertise
LIST OF TABLES
Table 1 Market Segmentation Analysis
Table 2 Global Edible Lactose Market Share of Leading Companies, 2023
Table 3 Product Offerings of Leading Companies
Table 4 Low Growth Scenario Forecasts
Table 5 Reference Case Growth Scenario
Table 6 High Growth Case Scenario
Table 7 Global Edible Lactose Revenue (USD Million) And CAGR (%) By Type (2021-2032)
Table 8 Global Edible Lactose Revenue (USD Million) And CAGR (%) By Application (2021-2032)
Table 9 Global Edible Lactose Revenue (USD Million) And CAGR (%) By Product (2021-2032)
Table 10 Global Edible Lactose Market Revenue (USD Million) By Regions (2021-2032)
Table 11 Global Edible Lactose Market Share (%) By Regions (2021-2032)
Table 12 North America Edible Lactose Revenue (USD Million) By Country (2021-2032)
Table 13 Europe Edible Lactose Revenue (USD Million) By Country (2021-2032)
Table 14 Asia Pacific Edible Lactose Revenue (USD Million) By Country (2021-2032)
Table 15 South America Edible Lactose Revenue (USD Million) By Country (2021-2032)
Table 16 Middle East and Africa Edible Lactose Revenue (USD Million) By Region (2021-2032)
Table 17 North America Edible Lactose Revenue (USD Million) By Type (2021-2032)
Table 18 North America Edible Lactose Revenue (USD Million) By Application (2021-2032)
Table 19 North America Edible Lactose Revenue (USD Million) By Product (2021-2032)
Table 20 Europe Edible Lactose Revenue (USD Million) By Type (2021-2032)
Table 21 Europe Edible Lactose Revenue (USD Million) By Application (2021-2032)
Table 22 Europe Edible Lactose Revenue (USD Million) By Product (2021-2032)
Table 23 Asia Pacific Edible Lactose Revenue (USD Million) By Type (2021-2032)
Table 24 Asia Pacific Edible Lactose Revenue (USD Million) By Application (2021-2032)
Table 25 Asia Pacific Edible Lactose Revenue (USD Million) By Product (2021-2032)
Table 26 South America Edible Lactose Revenue (USD Million) By Type (2021-2032)
Table 27 South America Edible Lactose Revenue (USD Million) By Application (2021-2032)
Table 28 South America Edible Lactose Revenue (USD Million) By Product (2021-2032)
Table 29 Middle East and Africa Edible Lactose Revenue (USD Million) By Type (2021-2032)
Table 30 Middle East and Africa Edible Lactose Revenue (USD Million) By Application (2021-2032)
Table 31 Middle East and Africa Edible Lactose Revenue (USD Million) By Product (2021-2032)
LIST OF FIGURES
Figure 1. Market Scope
Figure 2. Pricing Forecasts Per Unit, 2023- 2032
Figure 3. Porter’s Five Forces
Figure 4. Global Edible Lactose Market Revenue (USD Million) By Regions (2021-2032)
Figure 5. Global Edible Lactose Market Share (%) By Regions (2023)
Figure 6. North America Edible Lactose Revenue (USD Million) By Country (2021-2032)
Figure 7. United States Edible Lactose Revenue (USD Million) By Country (2021-2032)
Figure 8. Canada Edible Lactose Revenue (USD Million) By Country (2021-2032)
Figure 9. Mexico Edible Lactose Revenue (USD Million) By Country (2021-2032)
Figure 10. Europe Edible Lactose Revenue (USD Million) By Country (2021-2032)
Figure 11. Germany Edible Lactose Revenue (USD Million) By Country (2021-2032)
Figure 12. France Edible Lactose Revenue (USD Million) By Country (2021-2032)
Figure 13. United Kingdom Edible Lactose Revenue (USD Million) By Country (2021-2032)
Figure 14. Spain Edible Lactose Revenue (USD Million) By Country (2021-2032)
Figure 15. Italy Edible Lactose Revenue (USD Million) By Country (2021-2032)
Figure 16. Russia Edible Lactose Revenue (USD Million) By Country (2021-2032)
Figure 17. Rest of Europe Edible Lactose Revenue (USD Million) By Country (2021-2032)
Figure 11. Asia Pacific Edible Lactose Revenue (USD Million) By Country (2021-2032)
Figure 12. China Edible Lactose Revenue (USD Million) By Country (2021-2032)
Figure 13. Japan Edible Lactose Revenue (USD Million) By Country (2021-2032)
Figure 14. India Edible Lactose Revenue (USD Million) By Country (2021-2032)
Figure 15. South Korea Edible Lactose Revenue (USD Million) By Country (2021-2032)
Figure 16. Australia Edible Lactose Revenue (USD Million) By Country (2021-2032)
Figure 17. South East Asia Edible Lactose Revenue (USD Million) By Country (2021-2032)
Figure 18. South America Edible Lactose Revenue (USD Million) By Country (2021-2032)
Figure 19. Brazil Edible Lactose Revenue (USD Million) By Country (2021-2032)
Figure 20. Argentina Edible Lactose Revenue (USD Million) By Country (2021-2032)
Figure 21. Rest of Asia Pacific Edible Lactose Revenue (USD Million) By Country (2021-2032)
Figure 22. Middle East and Africa Edible Lactose Revenue (USD Million) By Region (2021-2032)
Figure 23. Saudi Arabia Edible Lactose Revenue (USD Million) By Region (2021-2032)
Figure 24. The UAE Edible Lactose Revenue (USD Million) By Region (2021-2032)
Figure 25. Rest of Middle East Edible Lactose Revenue (USD Million) By Region (2021-2032)
Figure 26. South Africa Edible Lactose Revenue (USD Million) By Region (2021-2032)
Figure 27. Africa Edible Lactose Revenue (USD Million) By Region (2021-2032)
Figure 28. North America Edible Lactose Revenue (USD Million) By Type (2021-2032)
Figure 29. North America Edible Lactose Revenue (USD Million) By Application (2021-2032)
Figure 30. North America Edible Lactose Revenue (USD Million) By Product (2021-2032)
Figure 31. Europe Edible Lactose Revenue (USD Million) By Type (2021-2032)
Figure 32. Europe Edible Lactose Revenue (USD Million) By Application (2021-2032)
Figure 33. Europe Edible Lactose Revenue (USD Million) By Product (2021-2032)
Figure 34. Asia Pacific Edible Lactose Revenue (USD Million) By Type (2021-2032)
Figure 35. Asia Pacific Edible Lactose Revenue (USD Million) By Application (2021-2032)
Figure 36. Asia Pacific Edible Lactose Revenue (USD Million) By Product (2021-2032)
Figure 37. South America Edible Lactose Revenue (USD Million) By Type (2021-2032)
Figure 38. South America Edible Lactose Revenue (USD Million) By Application (2021-2032)
Figure 39. South America Edible Lactose Revenue (USD Million) By Product (2021-2032)
Figure 40. Middle East and Africa Edible Lactose Revenue (USD Million) By Type (2021-2032)
Figure 41. Middle East and Africa Edible Lactose Revenue (USD Million) By Application (2021-2032)
Figure 42. Middle East and Africa Edible Lactose Revenue (USD Million) By Product (2021-2032)
By Mesh Size
60 to 120
160 to 200
By Application
Chocolate
Infant Nutrition
Seasonings
Bakery
Confectionary
Countries Analyzed
North America (US, Canada, Mexico)
Europe (Germany, UK, France, Spain, Italy, Russia, Rest of Europe)
Asia Pacific (China, India, Japan, South Korea, Australia, South East Asia, Rest of Asia)
South America (Brazil, Argentina, Rest of South America)
Middle East and Africa (Saudi Arabia, UAE, Rest of Middle East, South Africa, Egypt, Rest of Africa)
