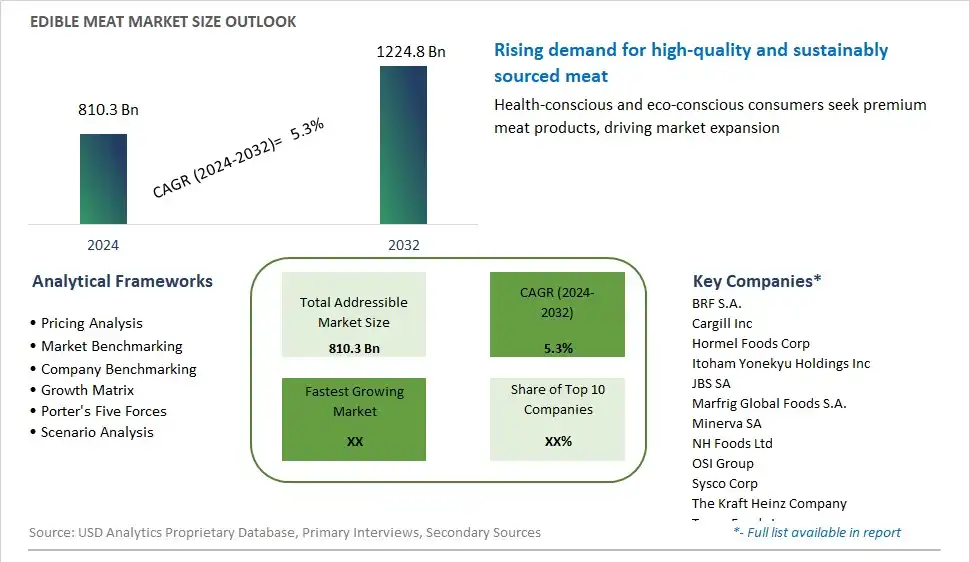
Global Edible meat Market Size is valued at $810.3 Billion in 2024 and is forecast to register a growth rate (CAGR) of 5.3% to reach $1224.8 Billion by 2032.
The global Edible meat Market Comprehensive Study analyzes and forecasts the market size across 6 regions and 24 countries for diverse segments -By Type (Beef, Mutton, Pork, Poultry, Others), By Form (Canned, Fresh, Frozen, Processed), By Distribution Channel (Off-Trade, On-Trade)
An Introduction to Edible meat Market
In 2024, the edible meat market continues to adapt to shifting consumer preferences, sustainability concerns, and technological innovations reshaping the food industry. With the global population projected to exceed nine billion by 2050, there is increasing pressure to meet rising demand for protein-rich foods while minimizing environmental impact and addressing animal welfare considerations. As a result, alternative protein sources such as plant-based meat substitutes, cultured meat, and insect-based products are gaining traction, offering sustainable and ethical alternatives to conventional animal agriculture. Plant-based meat substitutes, formulated to mimic the taste, texture, and nutritional profile of traditional meat, appeal to environmentally conscious consumers seeking healthier and more ethical food options. Moreover, advancements in cellular agriculture enable the production of cultured meat grown from animal cells in lab settings, promising a more sustainable and efficient protein production method with reduced land, water, and resource requirements. Additionally, insect-based protein products, rich in nutrients and low in environmental footprint, present novel culinary opportunities and contribute to diversifying protein sources. As consumer acceptance of alternative proteins grows and technological barriers continue to be overcome, the edible meat market is poised for transformation, with opportunities for innovation, collaboration, and market disruption.
Edible meat Competitive Landscape
The market report analyses the leading companies in the industry including BRF S.A., Cargill Inc, Hormel Foods Corp, Itoham Yonekyu Holdings Inc, JBS SA, Marfrig Global Foods S.A., Minerva SA, NH Foods Ltd, OSI Group, Sysco Corp, The Kraft Heinz Company, Tyson Foods Inc, Vion Group, WH Group Ltd, and Others.
Edible meat Market Dynamics
Edible meat Market Trend: Rising Demand for Plant-Based and Alternative Meat Products
A significant trend in the edible meat market is the rising demand for plant-based and alternative meat products. With increasing awareness of environmental sustainability, animal welfare concerns, and health considerations, consumers are seeking meat alternatives made from plant-based ingredients such as soy, peas, mushrooms, and jackfruit. This trend is driven by factors such as the growing popularity of vegetarian and flexitarian diets, as well as advancements in food technology that enable the production of meat-like textures and flavors using plant-derived proteins. Additionally, the rise of alternative meat brands and the availability of meat substitutes in mainstream grocery stores and restaurants contribute to the normalization and acceptance of plant-based eating habits. Manufacturers in the edible meat market are responding to this trend by offering a variety of plant-based meat alternatives, including burgers, sausages, nuggets, and meatballs, catering to the preferences of consumers seeking sustainable, cruelty-free, and healthier options for protein consumption.
Market Driver: Health and Wellness Concerns Driving Dietary Changes
A key driver behind the demand for edible meat alternatives is health and wellness concerns driving dietary changes. As consumers become more health-conscious and mindful of their dietary choices, there is a growing interest in reducing meat consumption and incorporating more plant-based foods into their diets. This driver is fueled by factors such as research linking excessive meat consumption to health issues such as heart disease, obesity, and cancer, as well as the recognition of the health benefits associated with plant-based diets, including lower cholesterol levels, reduced risk of chronic diseases, and improved digestion. Additionally, the desire to maintain a balanced and sustainable lifestyle motivates consumers to explore meat alternatives as part of their overall wellness journey. The availability of nutritious and protein-rich plant-based meat options provides consumers with an accessible and convenient way to transition towards healthier eating habits without sacrificing taste or satisfaction, driving market growth and innovation in the edible meat alternative segment.
Market Opportunity: Expansion into Novel Ingredients and Ethnic Cuisines
An opportunity for the edible meat market lies in the expansion into novel ingredients and ethnic cuisines to diversify product offerings and attract new consumer segments. Manufacturers can explore opportunities to develop meat alternatives using innovative ingredients such as seaweed, algae, insects, or lab-grown proteins, offering unique flavors, textures, and nutritional profiles that appeal to adventurous eaters and food enthusiasts. Additionally, tapping into ethnic cuisines and traditional meat substitutes from around the world, such as tempeh, tofu, seitan, or lentils, allows brands to cater to diverse cultural tastes and dietary preferences, expanding market reach and appeal. Furthermore, collaborating with celebrity chefs, culinary influencers, and restaurants to create signature plant-based meat dishes and recipes elevates product visibility and enhances consumer interest in meat alternatives. By embracing innovation and cultural diversity in product development, edible meat manufacturers can capitalize on opportunities for growth and market differentiation in the evolving landscape of plant-based eating and alternative protein sources.
Edible meat Market Share Analysis: Poultry held the dominant market share in 2024
In the Edible Meat Market segmented by type, poultry is the largest segment, commanding a significant share of the market. This dominance can be attributed to several key factors. Firstly, poultry meat, including chicken and turkey, is widely consumed worldwide due to its affordability, versatility, and lean protein content, making it a staple in many diets. Additionally, poultry meat is perceived as a healthier option compared to red meats like beef and pork, appealing to health-conscious consumers seeking nutritious protein sources. Further, the availability of a diverse range of poultry products, including fresh cuts, processed meats, and value-added products like sausages and nuggets, caters to diverse consumer preferences and culinary applications. Furthermore, the efficient production and distribution systems of poultry meat ensure consistent availability and affordability, further solidifying its position as the largest segment in the edible meat market.
Edible meat Market Share Analysis: Processed market is poised to register the fastest growth rae over the forecast period to 2032
Among the segments in the Edible Meat Market categorized by form, the processed segment is the fastest-growing, propelled by several compelling factors. Firstly, processed meat products offer convenience and versatility to consumers, as they are pre-cooked or prepared, requiring minimal additional preparation before consumption. Additionally, the longer shelf life of processed meats, achieved through techniques such as curing, smoking, and canning, enhances their appeal to consumers seeking convenient and longer-lasting food options. Further, the rising demand for on-the-go and ready-to-eat meals, coupled with changing lifestyles and busy schedules, drives the popularity of processed meat products as convenient meal solutions. Furthermore, the innovation and product development in the processed meat segment, including the introduction of healthier options and value-added products, further stimulate growth and consumer interest. As a result, the processed segment stands out as the fastest-growing in the edible meat market, poised for continued expansion driven by its convenience, versatility, and evolving consumer preferences.
Edible meat Market Share Analysis: Supermarkets/Hypermarkets held the dominant market share in 2024
In the Edible Meat Market segmented by distribution channel, supermarkets/hypermarkets emerge as the largest segment, commanding a significant share of the market. This dominance can be attributed to several key factors. Firstly, supermarkets and hypermarkets offer a wide range of edible meat products in various cuts and forms, catering to diverse consumer preferences and needs. Additionally, the convenience of one-stop shopping for groceries and meats under a single roof appeals to consumers seeking efficiency and time-saving solutions. Further, the extensive network and large footprint of supermarkets/hypermarkets ensure widespread availability and accessibility of edible meat products to consumers across urban and rural areas. Furthermore, strategic partnerships between meat suppliers and retail chains, coupled with promotional activities and competitive pricing strategies, further enhance the dominance of supermarkets/hypermarkets in the edible meat market. As a result, the supermarkets/hypermarkets segment maintains its position as the largest, poised for continued growth driven by its convenience, variety, and extensive reach.
Edible meat Market Segmentation
By Type
Beef
Mutton
Pork
Poultry
Others
By Form
Canned
Fresh
Frozen
Processed
By Distribution Channel
Off-Trade
-Convenience Stores
-Online Channel
-Supermarkets/Hypermarkets
-Others
On-Trade
Countries Analyzed
North America (US, Canada, Mexico)
Europe (Germany, UK, France, Spain, Italy, Russia, Rest of Europe)
Asia Pacific (China, India, Japan, South Korea, Australia, South East Asia, Rest of Asia)
South America (Brazil, Argentina, Rest of South America)
Middle East and Africa (Saudi Arabia, UAE, Rest of Middle East, South Africa, Egypt, Rest of Africa)
Edible meat Companies Profiled in the Study
BRF S.A.
Cargill Inc
Hormel Foods Corp
Itoham Yonekyu Holdings Inc
JBS SA
Marfrig Global Foods S.A.
Minerva SA
NH Foods Ltd
OSI Group
Sysco Corp
The Kraft Heinz Company
Tyson Foods Inc
Vion Group
WH Group Ltd
*- List Not Exhaustive
Chapter 1. TABLE OF CONTENTS
Chapter 2. Introduction to Edible meat Market
2.1. Market Overview
2.2. Key Statistics and Report Highlights
2.3. Scope of the Comprehensive Study
2.3.1. Market Definition
2.3.2 Countries and Regions Covered
2.3.3 Research Objective
2.3.4 Units, Currency, and Conversions
2.3.5 Industry Value Chain
2.4. Key Market Segments
2.5. Key Companies
2.6. Study Period
Chapter 3. Strategic Analysis Review
3.1. Edible meat Pricing Analysis and Forecast
3.2. Porter’s Five Forces
3.3. Market Ecosystem
3.4. SWOT Analysis
3.5. Regulatory Scenario
3.3. Effects of Inflation, Russia-Ukraine War, moderating economic growth, and other macroeconomic factors
Chapter 4. Competitive Landscape
4.1. Market Share Analysis
4.1.1. Global Edible meat Market Share by Company, 2023
4.1.2. Product Offerings of Leading Edible meat Companies
4.2. Market Entropy
4.2.1. New Product Launches in the Industry
4.2.2. Mergers, Acquisitions, Joint ventures, and Partnerships
4.3. Key Strategies and Best Practices
Chapter 5. Global Market Projections: Best, Reference, and Low Case Scenarios
5.1. Growth Analysis- Case Scenario Definitions
5.2. Low Growth Case Scenario Forecasts
5.3. Reference Growth Case Scenario Forecasts
5.4. High Growth Case Scenario Forecasts
Chapter 6. Market Dynamics
6.1. Edible meat Market Drivers
6.2. Edible meat Market Challenges
6.6. Edible meat Market Opportunities
6.4. Edible meat Market Trends
Chapter 7. Global Edible meat Market Outlook Trends
7.1. Global Edible meat Revenue (USD Million) and CAGR (%) by Type (2021-2032)
7.2. Global Edible meat Revenue (USD Million) and CAGR (%) by Application (2021-2032)
7.3. Global Edible meat Revenue (USD Million) and CAGR (%) by Product (2021-2032)
By Type
Beef
Mutton
Pork
Poultry
Others
By Form
Canned
Fresh
Frozen
Processed
By Distribution Channel
Off-Trade
-Convenience Stores
-Online Channel
-Supermarkets/Hypermarkets
-Others
On-Trade
Chapter 8. Global Edible meat Regional Analysis and Outlook
8.1. Global Edible meat Revenue (USD Million) By Regions (2021- 2032)
8.2. North America Edible meat Revenue (USD Million) by Country (2021-2032)
8.2.1. United States Edible meat Regional Analysis and Outlook
8.2.2. Canada Edible meat Regional Analysis and Outlook
8.2.3. Mexico Edible meat Regional Analysis and Outlook
8.3. Europe Edible meat Revenue (USD Million), by Country (2021-2032)
8.3.1. Germany Edible meat Regional Analysis and Outlook
8.3.2. France Edible meat Regional Analysis and Outlook
8.3.3. United Kingdom Edible meat Regional Analysis and Outlook
8.3.4. Spain Edible meat Regional Analysis and Outlook
8.3.5. Italy Edible meat Regional Analysis and Outlook
8.3.6. Russia Edible meat Regional Analysis and Outlook
8.3.7. Rest of Europe Edible meat Regional Analysis and Outlook
8.4. Asia Pacific Edible meat Revenue (USD Million) by Country (2021-2032)
8.4.1. China Edible meat Regional Analysis and Outlook
8.4.2. Japan Edible meat Regional Analysis and Outlook
8.4.3. India Edible meat Regional Analysis and Outlook
8.4.4. South Korea Edible meat Regional Analysis and Outlook
8.4.5. Australia Edible meat Regional Analysis and Outlook
8.4.6. South East Asia Edible meat Regional Analysis and Outlook
8.4.7. Rest of Asia Pacific Edible meat Regional Analysis and Outlook
8.5. South America Edible meat Revenue (USD Million), by Country (2021-2032)
8.5.1. Brazil Edible meat Regional Analysis and Outlook
8.5.2. Argentina Edible meat Regional Analysis and Outlook
8.5.3. Rest of South America Edible meat Regional Analysis and Outlook
8.6. Middle East and Africa Edible meat Revenue (USD Million) by Country (2021-2032)
8.6.1. Middle East Edible meat Regional Analysis and Outlook
8.6.2. Africa Edible meat Regional Analysis and Outlook
Chapter 9. North America Edible meat Analysis and Outlook
9.1. North America Edible meat Revenue (USD Million) by Segments (2021-2032)
9.1.1. North America Edible meat Revenue (USD Million) by Type (2021-2032)
9.1.2. North America Edible meat Revenue (USD Million) by Application (2021-2032)
9.1.3. North America Edible meat Revenue (USD Million) by Product (2021-2032)
By Type
Beef
Mutton
Pork
Poultry
Others
By Form
Canned
Fresh
Frozen
Processed
By Distribution Channel
Off-Trade
-Convenience Stores
-Online Channel
-Supermarkets/Hypermarkets
-Others
On-Trade
Chapter 10. Europe Edible meat Analysis and Outlook
10.1. Europe Edible meat Revenue (USD Million), by Segments (USD Million) (2021-2032)
10.1.1. Europe Edible meat Revenue (USD Million) by Type (2021-2032)
10.1.2. Europe Edible meat Revenue (USD Million) by Application (2021-2032)
10.1.3. Europe Edible meat Revenue (USD Million) by Product (2021-2032)
By Type
Beef
Mutton
Pork
Poultry
Others
By Form
Canned
Fresh
Frozen
Processed
By Distribution Channel
Off-Trade
-Convenience Stores
-Online Channel
-Supermarkets/Hypermarkets
-Others
On-Trade
Chapter 11. Asia Pacific Edible meat Analysis and Outlook
11.1. Asia Pacific Edible meat Revenue (USD Million), and Revenue (USD Million) by Segments (2021-2032)
11.1.1. Asia Pacific Edible meat Revenue (USD Million) by Type (2021-2032)
11.1.2. Asia Pacific Edible meat Revenue (USD Million) by Application (2021-2032)
11.1.3. Asia Pacific Edible meat Revenue (USD Million) by Product (2021-2032)
By Type
Beef
Mutton
Pork
Poultry
Others
By Form
Canned
Fresh
Frozen
Processed
By Distribution Channel
Off-Trade
-Convenience Stores
-Online Channel
-Supermarkets/Hypermarkets
-Others
On-Trade
Chapter 12. South America Edible meat Analysis and Outlook
12.1. South America Edible meat Revenue (USD Million), by Segments (2021-2032)
12.1.1. South America Edible meat Revenue (USD Million) by Type (2021-2032)
12.1.2. South America Edible meat Revenue (USD Million) by Application (2021-2032)
12.1.3. South America Edible meat Revenue (USD Million) by Product (2021-2032)
By Type
Beef
Mutton
Pork
Poultry
Others
By Form
Canned
Fresh
Frozen
Processed
By Distribution Channel
Off-Trade
-Convenience Stores
-Online Channel
-Supermarkets/Hypermarkets
-Others
On-Trade
Chapter 13. Middle East and Africa Edible meat Analysis and Outlook
13.1. Middle East and Africa Edible meat Revenue (USD Million), by Segments (2021-2032)
13.1.1. Middle East and Africa Edible meat Revenue (USD Million) by Type (2021-2032)
13.1.2. Middle East and Africa Edible meat Revenue (USD Million) by Application (2021-2032)
13.1.3. Middle East and Africa Edible meat Revenue (USD Million) by Product (2021-2032)
By Type
Beef
Mutton
Pork
Poultry
Others
By Form
Canned
Fresh
Frozen
Processed
By Distribution Channel
Off-Trade
-Convenience Stores
-Online Channel
-Supermarkets/Hypermarkets
-Others
On-Trade
Chapter 14. Edible meat Company Profiles
14.1 Business Overview
14.2 Product Profiles
14.3 SWOT Profiles
14.5 Recent Developments
14.6 Financial Profile
List of Companies
BRF S.A.
Cargill Inc
Hormel Foods Corp
Itoham Yonekyu Holdings Inc
JBS SA
Marfrig Global Foods S.A.
Minerva SA
NH Foods Ltd
OSI Group
Sysco Corp
The Kraft Heinz Company
Tyson Foods Inc
Vion Group
WH Group Ltd
15. Methodology and Data Sources
15.1 Customization Offerings
15.2 Subscription Services
15.3 Related Reports
15.4 Publisher Expertise
LIST OF TABLES
Table 1 Market Segmentation Analysis
Table 2 Global Edible meat Market Share of Leading Companies, 2023
Table 3 Product Offerings of Leading Companies
Table 4 Low Growth Scenario Forecasts
Table 5 Reference Case Growth Scenario
Table 6 High Growth Case Scenario
Table 7 Global Edible meat Revenue (USD Million) And CAGR (%) By Type (2021-2032)
Table 8 Global Edible meat Revenue (USD Million) And CAGR (%) By Application (2021-2032)
Table 9 Global Edible meat Revenue (USD Million) And CAGR (%) By Product (2021-2032)
Table 10 Global Edible meat Market Revenue (USD Million) By Regions (2021-2032)
Table 11 Global Edible meat Market Share (%) By Regions (2021-2032)
Table 12 North America Edible meat Revenue (USD Million) By Country (2021-2032)
Table 13 Europe Edible meat Revenue (USD Million) By Country (2021-2032)
Table 14 Asia Pacific Edible meat Revenue (USD Million) By Country (2021-2032)
Table 15 South America Edible meat Revenue (USD Million) By Country (2021-2032)
Table 16 Middle East and Africa Edible meat Revenue (USD Million) By Region (2021-2032)
Table 17 North America Edible meat Revenue (USD Million) By Type (2021-2032)
Table 18 North America Edible meat Revenue (USD Million) By Application (2021-2032)
Table 19 North America Edible meat Revenue (USD Million) By Product (2021-2032)
Table 20 Europe Edible meat Revenue (USD Million) By Type (2021-2032)
Table 21 Europe Edible meat Revenue (USD Million) By Application (2021-2032)
Table 22 Europe Edible meat Revenue (USD Million) By Product (2021-2032)
Table 23 Asia Pacific Edible meat Revenue (USD Million) By Type (2021-2032)
Table 24 Asia Pacific Edible meat Revenue (USD Million) By Application (2021-2032)
Table 25 Asia Pacific Edible meat Revenue (USD Million) By Product (2021-2032)
Table 26 South America Edible meat Revenue (USD Million) By Type (2021-2032)
Table 27 South America Edible meat Revenue (USD Million) By Application (2021-2032)
Table 28 South America Edible meat Revenue (USD Million) By Product (2021-2032)
Table 29 Middle East and Africa Edible meat Revenue (USD Million) By Type (2021-2032)
Table 30 Middle East and Africa Edible meat Revenue (USD Million) By Application (2021-2032)
Table 31 Middle East and Africa Edible meat Revenue (USD Million) By Product (2021-2032)
LIST OF FIGURES
Figure 1. Market Scope
Figure 2. Pricing Forecasts Per Unit, 2023- 2032
Figure 3. Porter’s Five Forces
Figure 4. Global Edible meat Market Revenue (USD Million) By Regions (2021-2032)
Figure 5. Global Edible meat Market Share (%) By Regions (2023)
Figure 6. North America Edible meat Revenue (USD Million) By Country (2021-2032)
Figure 7. United States Edible meat Revenue (USD Million) By Country (2021-2032)
Figure 8. Canada Edible meat Revenue (USD Million) By Country (2021-2032)
Figure 9. Mexico Edible meat Revenue (USD Million) By Country (2021-2032)
Figure 10. Europe Edible meat Revenue (USD Million) By Country (2021-2032)
Figure 11. Germany Edible meat Revenue (USD Million) By Country (2021-2032)
Figure 12. France Edible meat Revenue (USD Million) By Country (2021-2032)
Figure 13. United Kingdom Edible meat Revenue (USD Million) By Country (2021-2032)
Figure 14. Spain Edible meat Revenue (USD Million) By Country (2021-2032)
Figure 15. Italy Edible meat Revenue (USD Million) By Country (2021-2032)
Figure 16. Russia Edible meat Revenue (USD Million) By Country (2021-2032)
Figure 17. Rest of Europe Edible meat Revenue (USD Million) By Country (2021-2032)
Figure 11. Asia Pacific Edible meat Revenue (USD Million) By Country (2021-2032)
Figure 12. China Edible meat Revenue (USD Million) By Country (2021-2032)
Figure 13. Japan Edible meat Revenue (USD Million) By Country (2021-2032)
Figure 14. India Edible meat Revenue (USD Million) By Country (2021-2032)
Figure 15. South Korea Edible meat Revenue (USD Million) By Country (2021-2032)
Figure 16. Australia Edible meat Revenue (USD Million) By Country (2021-2032)
Figure 17. South East Asia Edible meat Revenue (USD Million) By Country (2021-2032)
Figure 18. South America Edible meat Revenue (USD Million) By Country (2021-2032)
Figure 19. Brazil Edible meat Revenue (USD Million) By Country (2021-2032)
Figure 20. Argentina Edible meat Revenue (USD Million) By Country (2021-2032)
Figure 21. Rest of Asia Pacific Edible meat Revenue (USD Million) By Country (2021-2032)
Figure 22. Middle East and Africa Edible meat Revenue (USD Million) By Region (2021-2032)
Figure 23. Saudi Arabia Edible meat Revenue (USD Million) By Region (2021-2032)
Figure 24. The UAE Edible meat Revenue (USD Million) By Region (2021-2032)
Figure 25. Rest of Middle East Edible meat Revenue (USD Million) By Region (2021-2032)
Figure 26. South Africa Edible meat Revenue (USD Million) By Region (2021-2032)
Figure 27. Africa Edible meat Revenue (USD Million) By Region (2021-2032)
Figure 28. North America Edible meat Revenue (USD Million) By Type (2021-2032)
Figure 29. North America Edible meat Revenue (USD Million) By Application (2021-2032)
Figure 30. North America Edible meat Revenue (USD Million) By Product (2021-2032)
Figure 31. Europe Edible meat Revenue (USD Million) By Type (2021-2032)
Figure 32. Europe Edible meat Revenue (USD Million) By Application (2021-2032)
Figure 33. Europe Edible meat Revenue (USD Million) By Product (2021-2032)
Figure 34. Asia Pacific Edible meat Revenue (USD Million) By Type (2021-2032)
Figure 35. Asia Pacific Edible meat Revenue (USD Million) By Application (2021-2032)
Figure 36. Asia Pacific Edible meat Revenue (USD Million) By Product (2021-2032)
Figure 37. South America Edible meat Revenue (USD Million) By Type (2021-2032)
Figure 38. South America Edible meat Revenue (USD Million) By Application (2021-2032)
Figure 39. South America Edible meat Revenue (USD Million) By Product (2021-2032)
Figure 40. Middle East and Africa Edible meat Revenue (USD Million) By Type (2021-2032)
Figure 41. Middle East and Africa Edible meat Revenue (USD Million) By Application (2021-2032)
Figure 42. Middle East and Africa Edible meat Revenue (USD Million) By Product (2021-2032)
By Type
Beef
Mutton
Pork
Poultry
Others
By Form
Canned
Fresh
Frozen
Processed
By Distribution Channel
Off-Trade
-Convenience Stores
-Online Channel
-Supermarkets/Hypermarkets
-Others
On-Trade
Countries Analyzed
North America (US, Canada, Mexico)
Europe (Germany, UK, France, Spain, Italy, Russia, Rest of Europe)
Asia Pacific (China, India, Japan, South Korea, Australia, South East Asia, Rest of Asia)
South America (Brazil, Argentina, Rest of South America)
Middle East and Africa (Saudi Arabia, UAE, Rest of Middle East, South Africa, Egypt, Rest of Africa)
