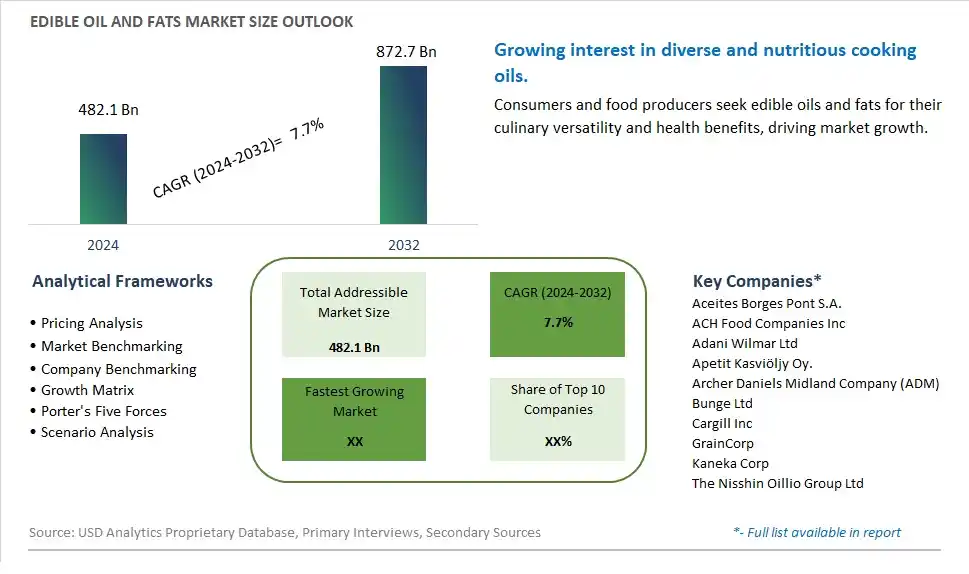
Global Edible Oil and Fats Market Size is valued at $482.1 Billion in 2024 and is forecast to register a growth rate (CAGR) of 7.7% to reach $872.7 Billion by 2032.
The global Edible Oil and Fats Market Comprehensive Study analyzes and forecasts the market size across 6 regions and 24 countries for diverse segments -By Product (Edible Oil, Edible Fats), By Nature (Organic, Conventional), By Source (Natural, Synthetic), By End-User (Food & Beverage, Personal Care & Cosmetics, Biofuel & Energy, Pharmaceuticals, Others), By Distribution Channel (Online, Offline)
An Introduction to Edible Oil and Fats Market
In 2024, the edible oil and fats market is evolving rapidly, driven by changing dietary preferences and a focus on health and wellness. Consumers are increasingly turning to healthier alternatives such as olive oil, avocado oil, and coconut oil, which are rich in beneficial fatty acids and antioxidants. Additionally, the demand for plant-based and vegan fats, including margarine and butter substitutes, is rising as more people adopt plant-based diets. The market is also seeing innovation in fortified oils and fats that cater to specific health needs, such as heart health and weight management. Sustainability and traceability are becoming key factors, with consumers preferring products that support ethical sourcing and environmental conservation.
Edible Oil and Fats Competitive Landscape
The market report analyses the leading companies in the industry including Aceites Borges Pont S.A., ACH Food Companies Inc, Adani Wilmar Ltd, Apetit Kasviöljy Oy., Archer Daniels Midland Company (ADM), Bunge Ltd, Cargill Inc, GrainCorp, Kaneka Corp, The Nisshin Oillio Group Ltd, and Others.
Edible Oil and Fats Market Dynamics
Edible Oil and Fats Market Trend: Increasing Demand for Healthier and Functional Edible Oils
The most prominent market trend in the edible oil and fats industry is the increasing demand for healthier and functional options. Consumers are becoming more health-conscious, driving the shift towards edible oils and fats that offer functional benefits such as omega-3 fatty acids, antioxidants, and vitamins. There is a growing preference for oils with lower levels of saturated fats and higher levels of unsaturated fats, such as olive oil, avocado oil, and flaxseed oil, due to their perceived health benefits. Additionally, specialty oils like coconut oil and almond oil are gaining popularity for their unique flavor profiles and potential health-promoting properties. This trend reflects consumers' desire for nutritious and functional ingredients to support their overall well-being.
Market Driver: Rise in Cooking at Home and Healthy Eating Trends
The primary market driver for edible oils and fats is the rise in cooking at home and healthy eating trends. With the increasing awareness of the link between diet and health, consumers are prioritizing home-cooked meals made with high-quality ingredients, including cooking oils and fats. The COVID-19 pandemic has further accelerated this trend, as lockdowns and restrictions have led to more people preparing meals at home. As consumers seek to adopt healthier cooking practices and incorporate more plant-based foods into their diets, there is a growing demand for versatile and nutritious edible oils and fats. This driver highlights the importance of consumer preferences for healthier cooking options and the role of edible oils and fats in supporting their dietary goals.
Market Opportunity: Innovation in Plant-Based and Functional Oil Products
An opportunity for the edible oil and fats market lies in innovation in plant-based and functional oil products to meet evolving consumer needs and preferences. Manufacturers can capitalize on the demand for healthier alternatives by developing innovative oil blends and formulations that offer enhanced nutritional benefits and functional properties. For example, there is an opportunity to introduce fortified oils enriched with vitamins, minerals, and bioactive compounds to address specific health concerns or dietary deficiencies. Additionally, plant-based alternatives to traditional animal fats, such as butter substitutes and dairy-free spreads, present an opportunity to cater to the growing market of vegan and flexitarian consumers. By leveraging advancements in food technology and ingredient sourcing, companies can create value-added edible oil and fat products that resonate with health-conscious consumers and drive growth in the market.
Edible Oil And Fats Market Share Analysis: Edible Oil held the dominant market share in 2024
Within the Edible Oil And Fats Market, the edible oil segment is the largest, commanding a significant share of the industry. This dominance can be attributed to several factors, including widespread usage, versatility, and nutritional value. Edible oils such as soybean oil, sunflower oil, olive oil, coconut oil, and palm oil are essential ingredients in cooking and food preparation across cultures and cuisines worldwide. These oils serve as primary cooking mediums, flavor enhancers, and ingredients in various food products. Further, edible oils are valued for their unique flavor profiles, health benefits, and cooking properties, catering to diverse consumer preferences and dietary needs. Additionally, the growing global population, urbanization, and changing dietary habits have driven the demand for edible oils, further solidifying their position as the largest segment in the Edible Oil And Fats Market. As consumers continue to prioritize health-conscious choices and seek high-quality cooking ingredients, the edible oil segment is expected to maintain its stronghold, driving market growth and innovation in the industry.
Edible Oil And Fats Market Share Analysis: Organic market is poised to register the fastest growth rae over the forecast period to 2032
Among the nature segments in the Edible Oil And Fats Market, the organic segment stands out as the fastest-growing, experiencing significant expansion in recent years. The robust growth outlook is driven by the increasing consumer demand for natural and sustainably sourced food products, driven by health-consciousness and environmental awareness. Organic edible oils and fats are produced without the use of synthetic pesticides, fertilizers, or genetically modified organisms (GMOs), adhering to strict organic farming practices and certification standards. As consumers become more discerning about the quality and origin of their food, organic options are increasingly preferred for their perceived health benefits, purity, and environmental sustainability. Further, organic edible oils and fats are valued for their superior taste, aroma, and nutritional content, appealing to consumers seeking premium and wholesome cooking ingredients. Additionally, the growing availability and accessibility of organic products in supermarkets, specialty stores, and online platforms have contributed to the rapid growth of the organic segment in the Edible Oil And Fats Market. As consumer preferences continue to shift towards natural and organic choices, the organic segment is expected to maintain its momentum, driving innovation and market expansion in the industry.
Edible Oil And Fats Market Share Analysis: Natural Source held the dominant market share in 2024
Within the Edible Oil And Fats Market, the natural source segment is the largest, commanding a significant share of the industry. This dominance can be attributed to several key factors, including consumer preferences, health-consciousness, and regulatory standards. Natural sources of edible oils and fats, such as plants and animals, are prized for their purity, authenticity, and nutritional value. These sources undergo minimal processing and are derived from natural ingredients, ensuring the preservation of their inherent flavors, aromas, and health benefits. Consumers increasingly prefer natural sources over synthetic alternatives due to concerns about the potential health risks associated with synthetic additives and chemicals. Further, natural sources of edible oils and fats align with the growing trend of clean label and transparent food products, resonating with consumers seeking wholesome and minimally processed ingredients. Additionally, the stringent regulations and certifications governing natural sources further contribute to their dominance in the Edible Oil And Fats Market, assuring consumers of quality and safety. As health and wellness continue to drive consumer choices, the natural source segment is expected to maintain its stronghold, shaping the future of the industry.
Edible Oil and Fats Market Segmentation
By Product
Edible Oil
-Soybean Oil
-Sunflower Oil
-Olive Oil
-Coconut Oil
-Palm Oil
-Others
Edible Fats
-Cocoa Butter Replacer
-Cocoa Butter Substitute
-Filling Fats
-Milk-Fat Replacers
-Spread Fat
-Frying Fats
-Margarine
-Shortenings
-Butter
-Others
By Nature
Organic
Conventional
By Source
Natural
Synthetic
By End-User
Food & Beverage
Personal Care & Cosmetics
Biofuel & Energy
Pharmaceuticals
Others
By Distribution Channel
Online
Offline
Countries Analyzed
North America (US, Canada, Mexico)
Europe (Germany, UK, France, Spain, Italy, Russia, Rest of Europe)
Asia Pacific (China, India, Japan, South Korea, Australia, South East Asia, Rest of Asia)
South America (Brazil, Argentina, Rest of South America)
Middle East and Africa (Saudi Arabia, UAE, Rest of Middle East, South Africa, Egypt, Rest of Africa)
Edible Oil and Fats Companies Profiled in the Study
Aceites Borges Pont S.A.
ACH Food Companies Inc
Adani Wilmar Ltd
Apetit Kasviöljy Oy.
Archer Daniels Midland Company (ADM)
Bunge Ltd
Cargill Inc
GrainCorp
Kaneka Corp
The Nisshin Oillio Group Ltd
*- List Not Exhaustive
Chapter 1. TABLE OF CONTENTS
Chapter 2. Introduction to Edible Oil and Fats Market
2.1. Market Overview
2.2. Key Statistics and Report Highlights
2.3. Scope of the Comprehensive Study
2.3.1. Market Definition
2.3.2 Countries and Regions Covered
2.3.3 Research Objective
2.3.4 Units, Currency, and Conversions
2.3.5 Industry Value Chain
2.4. Key Market Segments
2.5. Key Companies
2.6. Study Period
Chapter 3. Strategic Analysis Review
3.1. Edible Oil and Fats Pricing Analysis and Forecast
3.2. Porter’s Five Forces
3.3. Market Ecosystem
3.4. SWOT Analysis
3.5. Regulatory Scenario
3.3. Effects of Inflation, Russia-Ukraine War, moderating economic growth, and other macroeconomic factors
Chapter 4. Competitive Landscape
4.1. Market Share Analysis
4.1.1. Global Edible Oil and Fats Market Share by Company, 2023
4.1.2. Product Offerings of Leading Edible Oil and Fats Companies
4.2. Market Entropy
4.2.1. New Product Launches in the Industry
4.2.2. Mergers, Acquisitions, Joint ventures, and Partnerships
4.3. Key Strategies and Best Practices
Chapter 5. Global Market Projections: Best, Reference, and Low Case Scenarios
5.1. Growth Analysis- Case Scenario Definitions
5.2. Low Growth Case Scenario Forecasts
5.3. Reference Growth Case Scenario Forecasts
5.4. High Growth Case Scenario Forecasts
Chapter 6. Market Dynamics
6.1. Edible Oil and Fats Market Drivers
6.2. Edible Oil and Fats Market Challenges
6.6. Edible Oil and Fats Market Opportunities
6.4. Edible Oil and Fats Market Trends
Chapter 7. Global Edible Oil and Fats Market Outlook Trends
7.1. Global Edible Oil and Fats Revenue (USD Million) and CAGR (%) by Type (2021-2032)
7.2. Global Edible Oil and Fats Revenue (USD Million) and CAGR (%) by Application (2021-2032)
7.3. Global Edible Oil and Fats Revenue (USD Million) and CAGR (%) by Product (2021-2032)
By Product
Edible Oil
-Soybean Oil
-Sunflower Oil
-Olive Oil
-Coconut Oil
-Palm Oil
-Others
Edible Fats
-Cocoa Butter Replacer
-Cocoa Butter Substitute
-Filling Fats
-Milk-Fat Replacers
-Spread Fat
-Frying Fats
-Margarine
-Shortenings
-Butter
-Others
By Nature
Organic
Conventional
By Source
Natural
Synthetic
By End-User
Food & Beverage
Personal Care & Cosmetics
Biofuel & Energy
Pharmaceuticals
Others
By Distribution Channel
Online
Offline
Chapter 8. Global Edible Oil and Fats Regional Analysis and Outlook
8.1. Global Edible Oil and Fats Revenue (USD Million) By Regions (2021- 2032)
8.2. North America Edible Oil and Fats Revenue (USD Million) by Country (2021-2032)
8.2.1. United States Edible Oil and Fats Regional Analysis and Outlook
8.2.2. Canada Edible Oil and Fats Regional Analysis and Outlook
8.2.3. Mexico Edible Oil and Fats Regional Analysis and Outlook
8.3. Europe Edible Oil and Fats Revenue (USD Million), by Country (2021-2032)
8.3.1. Germany Edible Oil and Fats Regional Analysis and Outlook
8.3.2. France Edible Oil and Fats Regional Analysis and Outlook
8.3.3. United Kingdom Edible Oil and Fats Regional Analysis and Outlook
8.3.4. Spain Edible Oil and Fats Regional Analysis and Outlook
8.3.5. Italy Edible Oil and Fats Regional Analysis and Outlook
8.3.6. Russia Edible Oil and Fats Regional Analysis and Outlook
8.3.7. Rest of Europe Edible Oil and Fats Regional Analysis and Outlook
8.4. Asia Pacific Edible Oil and Fats Revenue (USD Million) by Country (2021-2032)
8.4.1. China Edible Oil and Fats Regional Analysis and Outlook
8.4.2. Japan Edible Oil and Fats Regional Analysis and Outlook
8.4.3. India Edible Oil and Fats Regional Analysis and Outlook
8.4.4. South Korea Edible Oil and Fats Regional Analysis and Outlook
8.4.5. Australia Edible Oil and Fats Regional Analysis and Outlook
8.4.6. South East Asia Edible Oil and Fats Regional Analysis and Outlook
8.4.7. Rest of Asia Pacific Edible Oil and Fats Regional Analysis and Outlook
8.5. South America Edible Oil and Fats Revenue (USD Million), by Country (2021-2032)
8.5.1. Brazil Edible Oil and Fats Regional Analysis and Outlook
8.5.2. Argentina Edible Oil and Fats Regional Analysis and Outlook
8.5.3. Rest of South America Edible Oil and Fats Regional Analysis and Outlook
8.6. Middle East and Africa Edible Oil and Fats Revenue (USD Million) by Country (2021-2032)
8.6.1. Middle East Edible Oil and Fats Regional Analysis and Outlook
8.6.2. Africa Edible Oil and Fats Regional Analysis and Outlook
Chapter 9. North America Edible Oil and Fats Analysis and Outlook
9.1. North America Edible Oil and Fats Revenue (USD Million) by Segments (2021-2032)
9.1.1. North America Edible Oil and Fats Revenue (USD Million) by Type (2021-2032)
9.1.2. North America Edible Oil and Fats Revenue (USD Million) by Application (2021-2032)
9.1.3. North America Edible Oil and Fats Revenue (USD Million) by Product (2021-2032)
By Product
Edible Oil
-Soybean Oil
-Sunflower Oil
-Olive Oil
-Coconut Oil
-Palm Oil
-Others
Edible Fats
-Cocoa Butter Replacer
-Cocoa Butter Substitute
-Filling Fats
-Milk-Fat Replacers
-Spread Fat
-Frying Fats
-Margarine
-Shortenings
-Butter
-Others
By Nature
Organic
Conventional
By Source
Natural
Synthetic
By End-User
Food & Beverage
Personal Care & Cosmetics
Biofuel & Energy
Pharmaceuticals
Others
By Distribution Channel
Online
Offline
Chapter 10. Europe Edible Oil and Fats Analysis and Outlook
10.1. Europe Edible Oil and Fats Revenue (USD Million), by Segments (USD Million) (2021-2032)
10.1.1. Europe Edible Oil and Fats Revenue (USD Million) by Type (2021-2032)
10.1.2. Europe Edible Oil and Fats Revenue (USD Million) by Application (2021-2032)
10.1.3. Europe Edible Oil and Fats Revenue (USD Million) by Product (2021-2032)
By Product
Edible Oil
-Soybean Oil
-Sunflower Oil
-Olive Oil
-Coconut Oil
-Palm Oil
-Others
Edible Fats
-Cocoa Butter Replacer
-Cocoa Butter Substitute
-Filling Fats
-Milk-Fat Replacers
-Spread Fat
-Frying Fats
-Margarine
-Shortenings
-Butter
-Others
By Nature
Organic
Conventional
By Source
Natural
Synthetic
By End-User
Food & Beverage
Personal Care & Cosmetics
Biofuel & Energy
Pharmaceuticals
Others
By Distribution Channel
Online
Offline
Chapter 11. Asia Pacific Edible Oil and Fats Analysis and Outlook
11.1. Asia Pacific Edible Oil and Fats Revenue (USD Million), and Revenue (USD Million) by Segments (2021-2032)
11.1.1. Asia Pacific Edible Oil and Fats Revenue (USD Million) by Type (2021-2032)
11.1.2. Asia Pacific Edible Oil and Fats Revenue (USD Million) by Application (2021-2032)
11.1.3. Asia Pacific Edible Oil and Fats Revenue (USD Million) by Product (2021-2032)
By Product
Edible Oil
-Soybean Oil
-Sunflower Oil
-Olive Oil
-Coconut Oil
-Palm Oil
-Others
Edible Fats
-Cocoa Butter Replacer
-Cocoa Butter Substitute
-Filling Fats
-Milk-Fat Replacers
-Spread Fat
-Frying Fats
-Margarine
-Shortenings
-Butter
-Others
By Nature
Organic
Conventional
By Source
Natural
Synthetic
By End-User
Food & Beverage
Personal Care & Cosmetics
Biofuel & Energy
Pharmaceuticals
Others
By Distribution Channel
Online
Offline
Chapter 12. South America Edible Oil and Fats Analysis and Outlook
12.1. South America Edible Oil and Fats Revenue (USD Million), by Segments (2021-2032)
12.1.1. South America Edible Oil and Fats Revenue (USD Million) by Type (2021-2032)
12.1.2. South America Edible Oil and Fats Revenue (USD Million) by Application (2021-2032)
12.1.3. South America Edible Oil and Fats Revenue (USD Million) by Product (2021-2032)
By Product
Edible Oil
-Soybean Oil
-Sunflower Oil
-Olive Oil
-Coconut Oil
-Palm Oil
-Others
Edible Fats
-Cocoa Butter Replacer
-Cocoa Butter Substitute
-Filling Fats
-Milk-Fat Replacers
-Spread Fat
-Frying Fats
-Margarine
-Shortenings
-Butter
-Others
By Nature
Organic
Conventional
By Source
Natural
Synthetic
By End-User
Food & Beverage
Personal Care & Cosmetics
Biofuel & Energy
Pharmaceuticals
Others
By Distribution Channel
Online
Offline
Chapter 13. Middle East and Africa Edible Oil and Fats Analysis and Outlook
13.1. Middle East and Africa Edible Oil and Fats Revenue (USD Million), by Segments (2021-2032)
13.1.1. Middle East and Africa Edible Oil and Fats Revenue (USD Million) by Type (2021-2032)
13.1.2. Middle East and Africa Edible Oil and Fats Revenue (USD Million) by Application (2021-2032)
13.1.3. Middle East and Africa Edible Oil and Fats Revenue (USD Million) by Product (2021-2032)
By Product
Edible Oil
-Soybean Oil
-Sunflower Oil
-Olive Oil
-Coconut Oil
-Palm Oil
-Others
Edible Fats
-Cocoa Butter Replacer
-Cocoa Butter Substitute
-Filling Fats
-Milk-Fat Replacers
-Spread Fat
-Frying Fats
-Margarine
-Shortenings
-Butter
-Others
By Nature
Organic
Conventional
By Source
Natural
Synthetic
By End-User
Food & Beverage
Personal Care & Cosmetics
Biofuel & Energy
Pharmaceuticals
Others
By Distribution Channel
Online
Offline
Chapter 14. Edible Oil and Fats Company Profiles
14.1 Business Overview
14.2 Product Profiles
14.3 SWOT Profiles
14.5 Recent Developments
14.6 Financial Profile
List of Companies
Aceites Borges Pont S.A.
ACH Food Companies Inc
Adani Wilmar Ltd
Apetit Kasviöljy Oy.
Archer Daniels Midland Company (ADM)
Bunge Ltd
Cargill Inc
GrainCorp
Kaneka Corp
The Nisshin Oillio Group Ltd
15. Methodology and Data Sources
15.1 Customization Offerings
15.2 Subscription Services
15.3 Related Reports
15.4 Publisher Expertise
LIST OF TABLES
Table 1 Market Segmentation Analysis
Table 2 Global Edible Oil and Fats Market Share of Leading Companies, 2023
Table 3 Product Offerings of Leading Companies
Table 4 Low Growth Scenario Forecasts
Table 5 Reference Case Growth Scenario
Table 6 High Growth Case Scenario
Table 7 Global Edible Oil and Fats Revenue (USD Million) And CAGR (%) By Type (2021-2032)
Table 8 Global Edible Oil and Fats Revenue (USD Million) And CAGR (%) By Application (2021-2032)
Table 9 Global Edible Oil and Fats Revenue (USD Million) And CAGR (%) By Product (2021-2032)
Table 10 Global Edible Oil and Fats Market Revenue (USD Million) By Regions (2021-2032)
Table 11 Global Edible Oil and Fats Market Share (%) By Regions (2021-2032)
Table 12 North America Edible Oil and Fats Revenue (USD Million) By Country (2021-2032)
Table 13 Europe Edible Oil and Fats Revenue (USD Million) By Country (2021-2032)
Table 14 Asia Pacific Edible Oil and Fats Revenue (USD Million) By Country (2021-2032)
Table 15 South America Edible Oil and Fats Revenue (USD Million) By Country (2021-2032)
Table 16 Middle East and Africa Edible Oil and Fats Revenue (USD Million) By Region (2021-2032)
Table 17 North America Edible Oil and Fats Revenue (USD Million) By Type (2021-2032)
Table 18 North America Edible Oil and Fats Revenue (USD Million) By Application (2021-2032)
Table 19 North America Edible Oil and Fats Revenue (USD Million) By Product (2021-2032)
Table 20 Europe Edible Oil and Fats Revenue (USD Million) By Type (2021-2032)
Table 21 Europe Edible Oil and Fats Revenue (USD Million) By Application (2021-2032)
Table 22 Europe Edible Oil and Fats Revenue (USD Million) By Product (2021-2032)
Table 23 Asia Pacific Edible Oil and Fats Revenue (USD Million) By Type (2021-2032)
Table 24 Asia Pacific Edible Oil and Fats Revenue (USD Million) By Application (2021-2032)
Table 25 Asia Pacific Edible Oil and Fats Revenue (USD Million) By Product (2021-2032)
Table 26 South America Edible Oil and Fats Revenue (USD Million) By Type (2021-2032)
Table 27 South America Edible Oil and Fats Revenue (USD Million) By Application (2021-2032)
Table 28 South America Edible Oil and Fats Revenue (USD Million) By Product (2021-2032)
Table 29 Middle East and Africa Edible Oil and Fats Revenue (USD Million) By Type (2021-2032)
Table 30 Middle East and Africa Edible Oil and Fats Revenue (USD Million) By Application (2021-2032)
Table 31 Middle East and Africa Edible Oil and Fats Revenue (USD Million) By Product (2021-2032)
LIST OF FIGURES
Figure 1. Market Scope
Figure 2. Pricing Forecasts Per Unit, 2023- 2032
Figure 3. Porter’s Five Forces
Figure 4. Global Edible Oil and Fats Market Revenue (USD Million) By Regions (2021-2032)
Figure 5. Global Edible Oil and Fats Market Share (%) By Regions (2023)
Figure 6. North America Edible Oil and Fats Revenue (USD Million) By Country (2021-2032)
Figure 7. United States Edible Oil and Fats Revenue (USD Million) By Country (2021-2032)
Figure 8. Canada Edible Oil and Fats Revenue (USD Million) By Country (2021-2032)
Figure 9. Mexico Edible Oil and Fats Revenue (USD Million) By Country (2021-2032)
Figure 10. Europe Edible Oil and Fats Revenue (USD Million) By Country (2021-2032)
Figure 11. Germany Edible Oil and Fats Revenue (USD Million) By Country (2021-2032)
Figure 12. France Edible Oil and Fats Revenue (USD Million) By Country (2021-2032)
Figure 13. United Kingdom Edible Oil and Fats Revenue (USD Million) By Country (2021-2032)
Figure 14. Spain Edible Oil and Fats Revenue (USD Million) By Country (2021-2032)
Figure 15. Italy Edible Oil and Fats Revenue (USD Million) By Country (2021-2032)
Figure 16. Russia Edible Oil and Fats Revenue (USD Million) By Country (2021-2032)
Figure 17. Rest of Europe Edible Oil and Fats Revenue (USD Million) By Country (2021-2032)
Figure 11. Asia Pacific Edible Oil and Fats Revenue (USD Million) By Country (2021-2032)
Figure 12. China Edible Oil and Fats Revenue (USD Million) By Country (2021-2032)
Figure 13. Japan Edible Oil and Fats Revenue (USD Million) By Country (2021-2032)
Figure 14. India Edible Oil and Fats Revenue (USD Million) By Country (2021-2032)
Figure 15. South Korea Edible Oil and Fats Revenue (USD Million) By Country (2021-2032)
Figure 16. Australia Edible Oil and Fats Revenue (USD Million) By Country (2021-2032)
Figure 17. South East Asia Edible Oil and Fats Revenue (USD Million) By Country (2021-2032)
Figure 18. South America Edible Oil and Fats Revenue (USD Million) By Country (2021-2032)
Figure 19. Brazil Edible Oil and Fats Revenue (USD Million) By Country (2021-2032)
Figure 20. Argentina Edible Oil and Fats Revenue (USD Million) By Country (2021-2032)
Figure 21. Rest of Asia Pacific Edible Oil and Fats Revenue (USD Million) By Country (2021-2032)
Figure 22. Middle East and Africa Edible Oil and Fats Revenue (USD Million) By Region (2021-2032)
Figure 23. Saudi Arabia Edible Oil and Fats Revenue (USD Million) By Region (2021-2032)
Figure 24. The UAE Edible Oil and Fats Revenue (USD Million) By Region (2021-2032)
Figure 25. Rest of Middle East Edible Oil and Fats Revenue (USD Million) By Region (2021-2032)
Figure 26. South Africa Edible Oil and Fats Revenue (USD Million) By Region (2021-2032)
Figure 27. Africa Edible Oil and Fats Revenue (USD Million) By Region (2021-2032)
Figure 28. North America Edible Oil and Fats Revenue (USD Million) By Type (2021-2032)
Figure 29. North America Edible Oil and Fats Revenue (USD Million) By Application (2021-2032)
Figure 30. North America Edible Oil and Fats Revenue (USD Million) By Product (2021-2032)
Figure 31. Europe Edible Oil and Fats Revenue (USD Million) By Type (2021-2032)
Figure 32. Europe Edible Oil and Fats Revenue (USD Million) By Application (2021-2032)
Figure 33. Europe Edible Oil and Fats Revenue (USD Million) By Product (2021-2032)
Figure 34. Asia Pacific Edible Oil and Fats Revenue (USD Million) By Type (2021-2032)
Figure 35. Asia Pacific Edible Oil and Fats Revenue (USD Million) By Application (2021-2032)
Figure 36. Asia Pacific Edible Oil and Fats Revenue (USD Million) By Product (2021-2032)
Figure 37. South America Edible Oil and Fats Revenue (USD Million) By Type (2021-2032)
Figure 38. South America Edible Oil and Fats Revenue (USD Million) By Application (2021-2032)
Figure 39. South America Edible Oil and Fats Revenue (USD Million) By Product (2021-2032)
Figure 40. Middle East and Africa Edible Oil and Fats Revenue (USD Million) By Type (2021-2032)
Figure 41. Middle East and Africa Edible Oil and Fats Revenue (USD Million) By Application (2021-2032)
Figure 42. Middle East and Africa Edible Oil and Fats Revenue (USD Million) By Product (2021-2032)
By Product
Edible Oil
-Soybean Oil
-Sunflower Oil
-Olive Oil
-Coconut Oil
-Palm Oil
-Others
Edible Fats
-Cocoa Butter Replacer
-Cocoa Butter Substitute
-Filling Fats
-Milk-Fat Replacers
-Spread Fat
-Frying Fats
-Margarine
-Shortenings
-Butter
-Others
By Nature
Organic
Conventional
By Source
Natural
Synthetic
By End-User
Food & Beverage
Personal Care & Cosmetics
Biofuel & Energy
Pharmaceuticals
Others
By Distribution Channel
Online
Offline
Countries Analyzed
North America (US, Canada, Mexico)
Europe (Germany, UK, France, Spain, Italy, Russia, Rest of Europe)
Asia Pacific (China, India, Japan, South Korea, Australia, South East Asia, Rest of Asia)
South America (Brazil, Argentina, Rest of South America)
Middle East and Africa (Saudi Arabia, UAE, Rest of Middle East, South Africa, Egypt, Rest of Africa)
