The global Edible Oils Market Comprehensive Study analyzes and forecasts the market size across 6 regions and 24 countries for diverse segments -By Product (Palm Oil, Soybean Oil, Sunflower Oil, Rapeseed Oil, Olive Oil, Others), By Packaging (Pouches, Jars, Cans, Bottles, Others), By End-User (Domestic, Industrial, Food Service)
Edible oils are essential cooking and culinary ingredients derived from plant, animal, or microbial sources in 2024. These oils are used in a wide variety of food applications, including frying, sautéing, baking, dressing, and flavoring, due to their unique sensory attributes, nutritional profiles, and functional properties. Common types of edible oils include vegetable oils such as soybean, canola, and olive oil; animal fats such as lard and butter; and specialty oils such as coconut, avocado, and sesame oil. Each type of edible oil offers distinct flavor, smoke point, and health benefits, making them suitable for different cooking techniques and culinary preferences. With growing consumer interest in health and wellness, there is a rising demand for natural, minimally processed edible oils that are free from additives, preservatives, and trans fats. As a result, the market for edible oils is evolving to include a wider variety of specialty and functional oils, such as cold-pressed, organic, and high-oleic oils, that cater to diverse dietary needs and lifestyle choices.
The market report analyses the leading companies in the industry including Aceitera General Deheza S.A. (AGD), Adani Wilmar Ltd (AWL), AJANTA SOYA Ltd, American Vegetable Oils Inc, Archer Daniels Midland Company (ADM), Associated British Foods PLC (ABF), Aveno NV, BASSO FEDELE & FIGLI Srl, Borges International Group, Bunge Ltd, Cargill Inc, Golden Agri-Resources Ltd, GrainCorp, hebany, Louis Dreyfus Company B.V., RICHARDSON INTERNATIONAL Ltd, Sime DarBy Plantation Berhad, Sunora Foods, The Nisshin OilliO Group Ltd, United Plantations Berhad, VICENTIN S.A.I.C., Wilmar International Ltd, and Others.
One prominent trend in the edible oils market is the shift towards healthier oil options. With growing awareness of health and wellness, consumers are increasingly seeking oils that offer nutritional benefits and align with their dietary preferences. This trend is driven by concerns over lifestyle diseases such as obesity, cardiovascular diseases, and diabetes, prompting consumers to choose oils that are lower in saturated fats, free from trans fats, and rich in essential fatty acids such as omega-3 and omega-6. As a result, there is a rising demand for healthier alternatives such as olive oil, avocado oil, coconut oil, and flaxseed oil, which are perceived to offer various health benefits. Manufacturers are responding to this trend by diversifying their product portfolios, introducing new oil varieties, and emphasizing the nutritional qualities of their products through labeling and marketing initiatives.
A key driver fueling the edible oils market is the increasing consumption of edible oils, particularly in urban areas. As populations grow and urbanize, dietary patterns are shifting towards convenience foods, processed foods, and restaurant dining, driving the demand for edible oils used in cooking, frying, and food preparation. This driver is further amplified by factors such as rising disposable incomes, changing lifestyles, and the influence of Western dietary habits. Additionally, the expanding foodservice sector, including restaurants, hotels, and catering services, is driving bulk demand for edible oils for commercial cooking purposes. As a result, manufacturers are ramping up production capacities, expanding distribution networks, and investing in marketing and promotional activities to capitalize on the growing demand for edible oils in both retail and foodservice channels.
An opportunity within the edible oils market lies in the diversification into specialty and functional oils. While traditional oils such as sunflower oil, soybean oil, and palm oil continue to dominate the market, there is a growing demand for specialty oils that offer unique flavors, aromas, and health benefits. Specialty oils such as extra virgin olive oil, cold-pressed oils, and organic oils are gaining popularity among health-conscious consumers and culinary enthusiasts seeking premium and gourmet options. Additionally, there is an opportunity to develop functional oils fortified with vitamins, antioxidants, and other bioactive compounds that offer specific health benefits such as improved heart health, cognitive function, and immune support. By tapping into the growing demand for specialty and functional oils, manufacturers can differentiate their product offerings, command premium pricing, and cater to evolving consumer preferences in the dynamic edible oils market landscape.
In the Edible Oils Market segmented by product, the palm oil segment is the largest, driven by several pivotal factors. Palm oil holds a dominant position in the global edible oils market due to its versatile applications in various industries, including food, cosmetics, and biofuels. Its widespread usage stems from its unique properties, including high oxidative stability, resistance to rancidity, and versatility in cooking and food processing. Additionally, palm oil is cost-effective to produce and has a high yield per hectare, making it a preferred choice for food manufacturers and consumers alike. Further, palm oil's neutral flavor profile and ability to withstand high temperatures make it suitable for frying, baking, and as a cooking oil in a wide range of culinary applications. Furthermore, palm oil's natural composition of saturated and unsaturated fats, along with its vitamin E content, contributes to its nutritional profile, further enhancing its popularity among health-conscious consumers. Additionally, palm oil's versatility extends to non-food applications, including its use in the production of biodiesel, surfactants, and personal care products, further driving its demand and market dominance. As a result, the palm oil segment stands as the largest in the Edible Oils Market, poised for continued growth as the demand for sustainable and versatile edible oils remains strong globally.
In the Edible Oils Market segmented by packaging, the pouches segment is the fastest-growing, driven by several transformative factors. Pouch packaging offers numerous advantages, including convenience, portability, and sustainability, which resonate with modern consumer preferences and lifestyle trends. Pouches are lightweight and portable, making them ideal for on-the-go consumption and storage, aligning with the increasing demand for convenience-oriented food packaging solutions. Additionally, pouches are more environmentally friendly than traditional packaging formats like cans and bottles, as they require fewer raw materials and energy for production and transportation, resulting in lower carbon emissions and reduced waste. Further, advancements in pouch design and manufacturing technologies have improved product protection and shelf life, ensuring the freshness and quality of edible oils throughout their lifecycle. Furthermore, the versatility of pouch packaging allows for innovative branding and marketing strategies, enhancing product visibility and consumer engagement on store shelves and online platforms. As a result, the pouches segment stands as the fastest-growing in the Edible Oils Market, poised for continued expansion as manufacturers and retailers prioritize sustainable and convenient packaging solutions to meet evolving consumer needs and preferences.
In the Edible Oils Market segmented by end-user, the domestic segment is the largest, driven by several pivotal factors. Domestic consumers represent the largest consumer base for edible oils, encompassing households, individuals, and families who use edible oils for cooking, baking, and various culinary applications at home. The demand for edible oils in the domestic segment is driven by factors such as population growth, dietary habits, and cultural preferences for certain cooking oils. Additionally, edible oils are essential staples in domestic kitchens worldwide, serving as primary cooking mediums and flavor enhancers in a wide range of cuisines and dishes. Further, the increasing trend towards home cooking and meal preparation, especially in light of the COVID-19 pandemic and associated lockdowns, has further boosted the consumption of edible oils in the domestic segment. Furthermore, the affordability and availability of edible oils in various packaging formats cater to the diverse needs and preferences of domestic consumers, contributing to the dominance of the domestic segment in the Edible Oils Market. As a result, the domestic segment stands as the largest, poised for continued growth as consumers prioritize healthy cooking practices and home-based food preparation.
By Product
Palm Oil
Soybean Oil
Sunflower Oil
Rapeseed Oil
Olive Oil
Others
By Packaging
Pouches
Jars
Cans
Bottles
Others
By End-User
Domestic
Industrial
Food Service
Countries Analyzed
North America (US, Canada, Mexico)
Europe (Germany, UK, France, Spain, Italy, Russia, Rest of Europe)
Asia Pacific (China, India, Japan, South Korea, Australia, South East Asia, Rest of Asia)
South America (Brazil, Argentina, Rest of South America)
Middle East and Africa (Saudi Arabia, UAE, Rest of Middle East, South Africa, Egypt, Rest of Africa)
Aceitera General Deheza S.A. (AGD)
Adani Wilmar Ltd (AWL)
AJANTA SOYA Ltd
American Vegetable Oils Inc
Archer Daniels Midland Company (ADM)
Associated British Foods PLC (ABF)
Aveno NV
BASSO FEDELE & FIGLI Srl
Borges International Group
Bunge Ltd
Cargill Inc
Golden Agri-Resources Ltd
GrainCorp
hebany
Louis Dreyfus Company B.V.
RICHARDSON INTERNATIONAL Ltd
Sime DarBy Plantation Berhad
Sunora Foods
The Nisshin OilliO Group Ltd
United Plantations Berhad
VICENTIN S.A.I.C.
Wilmar International Ltd
*- List Not Exhaustive
Chapter 1. TABLE OF CONTENTS
Chapter 2. Introduction to Edible Oils Market
2.1. Market Overview
2.2. Key Statistics and Report Highlights
2.3. Scope of the Comprehensive Study
2.3.1. Market Definition
2.3.2 Countries and Regions Covered
2.3.3 Research Objective
2.3.4 Units, Currency, and Conversions
2.3.5 Industry Value Chain
2.4. Key Market Segments
2.5. Key Companies
2.6. Study Period
Chapter 3. Strategic Analysis Review
3.1. Edible Oils Pricing Analysis and Forecast
3.2. Porter’s Five Forces
3.3. Market Ecosystem
3.4. SWOT Analysis
3.5. Regulatory Scenario
3.3. Effects of Inflation, Russia-Ukraine War, moderating economic growth, and other macroeconomic factors
Chapter 4. Competitive Landscape
4.1. Market Share Analysis
4.1.1. Global Edible Oils Market Share by Company, 2023
4.1.2. Product Offerings of Leading Edible Oils Companies
4.2. Market Entropy
4.2.1. New Product Launches in the Industry
4.2.2. Mergers, Acquisitions, Joint ventures, and Partnerships
4.3. Key Strategies and Best Practices
Chapter 5. Global Market Projections: Best, Reference, and Low Case Scenarios
5.1. Growth Analysis- Case Scenario Definitions
5.2. Low Growth Case Scenario Forecasts
5.3. Reference Growth Case Scenario Forecasts
5.4. High Growth Case Scenario Forecasts
Chapter 6. Market Dynamics
6.1. Edible Oils Market Drivers
6.2. Edible Oils Market Challenges
6.6. Edible Oils Market Opportunities
6.4. Edible Oils Market Trends
Chapter 7. Global Edible Oils Market Outlook Trends
7.1. Global Edible Oils Revenue (USD Million) and CAGR (%) by Type (2021-2032)
7.2. Global Edible Oils Revenue (USD Million) and CAGR (%) by Application (2021-2032)
7.3. Global Edible Oils Revenue (USD Million) and CAGR (%) by Product (2021-2032)
By Product
Palm Oil
Soybean Oil
Sunflower Oil
Rapeseed Oil
Olive Oil
Others
By Packaging
Pouches
Jars
Cans
Bottles
Others
By End-User
Domestic
Industrial
Food Service
Chapter 8. Global Edible Oils Regional Analysis and Outlook
8.1. Global Edible Oils Revenue (USD Million) By Regions (2021- 2032)
8.2. North America Edible Oils Revenue (USD Million) by Country (2021-2032)
8.2.1. United States Edible Oils Regional Analysis and Outlook
8.2.2. Canada Edible Oils Regional Analysis and Outlook
8.2.3. Mexico Edible Oils Regional Analysis and Outlook
8.3. Europe Edible Oils Revenue (USD Million), by Country (2021-2032)
8.3.1. Germany Edible Oils Regional Analysis and Outlook
8.3.2. France Edible Oils Regional Analysis and Outlook
8.3.3. United Kingdom Edible Oils Regional Analysis and Outlook
8.3.4. Spain Edible Oils Regional Analysis and Outlook
8.3.5. Italy Edible Oils Regional Analysis and Outlook
8.3.6. Russia Edible Oils Regional Analysis and Outlook
8.3.7. Rest of Europe Edible Oils Regional Analysis and Outlook
8.4. Asia Pacific Edible Oils Revenue (USD Million) by Country (2021-2032)
8.4.1. China Edible Oils Regional Analysis and Outlook
8.4.2. Japan Edible Oils Regional Analysis and Outlook
8.4.3. India Edible Oils Regional Analysis and Outlook
8.4.4. South Korea Edible Oils Regional Analysis and Outlook
8.4.5. Australia Edible Oils Regional Analysis and Outlook
8.4.6. South East Asia Edible Oils Regional Analysis and Outlook
8.4.7. Rest of Asia Pacific Edible Oils Regional Analysis and Outlook
8.5. South America Edible Oils Revenue (USD Million), by Country (2021-2032)
8.5.1. Brazil Edible Oils Regional Analysis and Outlook
8.5.2. Argentina Edible Oils Regional Analysis and Outlook
8.5.3. Rest of South America Edible Oils Regional Analysis and Outlook
8.6. Middle East and Africa Edible Oils Revenue (USD Million) by Country (2021-2032)
8.6.1. Middle East Edible Oils Regional Analysis and Outlook
8.6.2. Africa Edible Oils Regional Analysis and Outlook
Chapter 9. North America Edible Oils Analysis and Outlook
9.1. North America Edible Oils Revenue (USD Million) by Segments (2021-2032)
9.1.1. North America Edible Oils Revenue (USD Million) by Type (2021-2032)
9.1.2. North America Edible Oils Revenue (USD Million) by Application (2021-2032)
9.1.3. North America Edible Oils Revenue (USD Million) by Product (2021-2032)
By Product
Palm Oil
Soybean Oil
Sunflower Oil
Rapeseed Oil
Olive Oil
Others
By Packaging
Pouches
Jars
Cans
Bottles
Others
By End-User
Domestic
Industrial
Food Service
Chapter 10. Europe Edible Oils Analysis and Outlook
10.1. Europe Edible Oils Revenue (USD Million), by Segments (USD Million) (2021-2032)
10.1.1. Europe Edible Oils Revenue (USD Million) by Type (2021-2032)
10.1.2. Europe Edible Oils Revenue (USD Million) by Application (2021-2032)
10.1.3. Europe Edible Oils Revenue (USD Million) by Product (2021-2032)
By Product
Palm Oil
Soybean Oil
Sunflower Oil
Rapeseed Oil
Olive Oil
Others
By Packaging
Pouches
Jars
Cans
Bottles
Others
By End-User
Domestic
Industrial
Food Service
Chapter 11. Asia Pacific Edible Oils Analysis and Outlook
11.1. Asia Pacific Edible Oils Revenue (USD Million), and Revenue (USD Million) by Segments (2021-2032)
11.1.1. Asia Pacific Edible Oils Revenue (USD Million) by Type (2021-2032)
11.1.2. Asia Pacific Edible Oils Revenue (USD Million) by Application (2021-2032)
11.1.3. Asia Pacific Edible Oils Revenue (USD Million) by Product (2021-2032)
By Product
Palm Oil
Soybean Oil
Sunflower Oil
Rapeseed Oil
Olive Oil
Others
By Packaging
Pouches
Jars
Cans
Bottles
Others
By End-User
Domestic
Industrial
Food Service
Chapter 12. South America Edible Oils Analysis and Outlook
12.1. South America Edible Oils Revenue (USD Million), by Segments (2021-2032)
12.1.1. South America Edible Oils Revenue (USD Million) by Type (2021-2032)
12.1.2. South America Edible Oils Revenue (USD Million) by Application (2021-2032)
12.1.3. South America Edible Oils Revenue (USD Million) by Product (2021-2032)
By Product
Palm Oil
Soybean Oil
Sunflower Oil
Rapeseed Oil
Olive Oil
Others
By Packaging
Pouches
Jars
Cans
Bottles
Others
By End-User
Domestic
Industrial
Food Service
Chapter 13. Middle East and Africa Edible Oils Analysis and Outlook
13.1. Middle East and Africa Edible Oils Revenue (USD Million), by Segments (2021-2032)
13.1.1. Middle East and Africa Edible Oils Revenue (USD Million) by Type (2021-2032)
13.1.2. Middle East and Africa Edible Oils Revenue (USD Million) by Application (2021-2032)
13.1.3. Middle East and Africa Edible Oils Revenue (USD Million) by Product (2021-2032)
By Product
Palm Oil
Soybean Oil
Sunflower Oil
Rapeseed Oil
Olive Oil
Others
By Packaging
Pouches
Jars
Cans
Bottles
Others
By End-User
Domestic
Industrial
Food Service
Chapter 14. Edible Oils Company Profiles
14.1 Business Overview
14.2 Product Profiles
14.3 SWOT Profiles
14.5 Recent Developments
14.6 Financial Profile
List of Companies
Aceitera General Deheza S.A. (AGD)
Adani Wilmar Ltd (AWL)
AJANTA SOYA Ltd
American Vegetable Oils Inc
Archer Daniels Midland Company (ADM)
Associated British Foods PLC (ABF)
Aveno NV
BASSO FEDELE & FIGLI Srl
Borges International Group
Bunge Ltd
Cargill Inc
Golden Agri-Resources Ltd
GrainCorp
hebany
Louis Dreyfus Company B.V.
RICHARDSON INTERNATIONAL Ltd
Sime DarBy Plantation Berhad
Sunora Foods
The Nisshin OilliO Group Ltd
United Plantations Berhad
VICENTIN S.A.I.C.
Wilmar International Ltd
15. Methodology and Data Sources
15.1 Customization Offerings
15.2 Subscription Services
15.3 Related Reports
15.4 Publisher Expertise
LIST OF TABLES
Table 1 Market Segmentation Analysis
Table 2 Global Edible Oils Market Share of Leading Companies, 2023
Table 3 Product Offerings of Leading Companies
Table 4 Low Growth Scenario Forecasts
Table 5 Reference Case Growth Scenario
Table 6 High Growth Case Scenario
Table 7 Global Edible Oils Revenue (USD Million) And CAGR (%) By Type (2021-2032)
Table 8 Global Edible Oils Revenue (USD Million) And CAGR (%) By Application (2021-2032)
Table 9 Global Edible Oils Revenue (USD Million) And CAGR (%) By Product (2021-2032)
Table 10 Global Edible Oils Market Revenue (USD Million) By Regions (2021-2032)
Table 11 Global Edible Oils Market Share (%) By Regions (2021-2032)
Table 12 North America Edible Oils Revenue (USD Million) By Country (2021-2032)
Table 13 Europe Edible Oils Revenue (USD Million) By Country (2021-2032)
Table 14 Asia Pacific Edible Oils Revenue (USD Million) By Country (2021-2032)
Table 15 South America Edible Oils Revenue (USD Million) By Country (2021-2032)
Table 16 Middle East and Africa Edible Oils Revenue (USD Million) By Region (2021-2032)
Table 17 North America Edible Oils Revenue (USD Million) By Type (2021-2032)
Table 18 North America Edible Oils Revenue (USD Million) By Application (2021-2032)
Table 19 North America Edible Oils Revenue (USD Million) By Product (2021-2032)
Table 20 Europe Edible Oils Revenue (USD Million) By Type (2021-2032)
Table 21 Europe Edible Oils Revenue (USD Million) By Application (2021-2032)
Table 22 Europe Edible Oils Revenue (USD Million) By Product (2021-2032)
Table 23 Asia Pacific Edible Oils Revenue (USD Million) By Type (2021-2032)
Table 24 Asia Pacific Edible Oils Revenue (USD Million) By Application (2021-2032)
Table 25 Asia Pacific Edible Oils Revenue (USD Million) By Product (2021-2032)
Table 26 South America Edible Oils Revenue (USD Million) By Type (2021-2032)
Table 27 South America Edible Oils Revenue (USD Million) By Application (2021-2032)
Table 28 South America Edible Oils Revenue (USD Million) By Product (2021-2032)
Table 29 Middle East and Africa Edible Oils Revenue (USD Million) By Type (2021-2032)
Table 30 Middle East and Africa Edible Oils Revenue (USD Million) By Application (2021-2032)
Table 31 Middle East and Africa Edible Oils Revenue (USD Million) By Product (2021-2032)
LIST OF FIGURES
Figure 1. Market Scope
Figure 2. Pricing Forecasts Per Unit, 2023- 2032
Figure 3. Porter’s Five Forces
Figure 4. Global Edible Oils Market Revenue (USD Million) By Regions (2021-2032)
Figure 5. Global Edible Oils Market Share (%) By Regions (2023)
Figure 6. North America Edible Oils Revenue (USD Million) By Country (2021-2032)
Figure 7. United States Edible Oils Revenue (USD Million) By Country (2021-2032)
Figure 8. Canada Edible Oils Revenue (USD Million) By Country (2021-2032)
Figure 9. Mexico Edible Oils Revenue (USD Million) By Country (2021-2032)
Figure 10. Europe Edible Oils Revenue (USD Million) By Country (2021-2032)
Figure 11. Germany Edible Oils Revenue (USD Million) By Country (2021-2032)
Figure 12. France Edible Oils Revenue (USD Million) By Country (2021-2032)
Figure 13. United Kingdom Edible Oils Revenue (USD Million) By Country (2021-2032)
Figure 14. Spain Edible Oils Revenue (USD Million) By Country (2021-2032)
Figure 15. Italy Edible Oils Revenue (USD Million) By Country (2021-2032)
Figure 16. Russia Edible Oils Revenue (USD Million) By Country (2021-2032)
Figure 17. Rest of Europe Edible Oils Revenue (USD Million) By Country (2021-2032)
Figure 11. Asia Pacific Edible Oils Revenue (USD Million) By Country (2021-2032)
Figure 12. China Edible Oils Revenue (USD Million) By Country (2021-2032)
Figure 13. Japan Edible Oils Revenue (USD Million) By Country (2021-2032)
Figure 14. India Edible Oils Revenue (USD Million) By Country (2021-2032)
Figure 15. South Korea Edible Oils Revenue (USD Million) By Country (2021-2032)
Figure 16. Australia Edible Oils Revenue (USD Million) By Country (2021-2032)
Figure 17. South East Asia Edible Oils Revenue (USD Million) By Country (2021-2032)
Figure 18. South America Edible Oils Revenue (USD Million) By Country (2021-2032)
Figure 19. Brazil Edible Oils Revenue (USD Million) By Country (2021-2032)
Figure 20. Argentina Edible Oils Revenue (USD Million) By Country (2021-2032)
Figure 21. Rest of Asia Pacific Edible Oils Revenue (USD Million) By Country (2021-2032)
Figure 22. Middle East and Africa Edible Oils Revenue (USD Million) By Region (2021-2032)
Figure 23. Saudi Arabia Edible Oils Revenue (USD Million) By Region (2021-2032)
Figure 24. The UAE Edible Oils Revenue (USD Million) By Region (2021-2032)
Figure 25. Rest of Middle East Edible Oils Revenue (USD Million) By Region (2021-2032)
Figure 26. South Africa Edible Oils Revenue (USD Million) By Region (2021-2032)
Figure 27. Africa Edible Oils Revenue (USD Million) By Region (2021-2032)
Figure 28. North America Edible Oils Revenue (USD Million) By Type (2021-2032)
Figure 29. North America Edible Oils Revenue (USD Million) By Application (2021-2032)
Figure 30. North America Edible Oils Revenue (USD Million) By Product (2021-2032)
Figure 31. Europe Edible Oils Revenue (USD Million) By Type (2021-2032)
Figure 32. Europe Edible Oils Revenue (USD Million) By Application (2021-2032)
Figure 33. Europe Edible Oils Revenue (USD Million) By Product (2021-2032)
Figure 34. Asia Pacific Edible Oils Revenue (USD Million) By Type (2021-2032)
Figure 35. Asia Pacific Edible Oils Revenue (USD Million) By Application (2021-2032)
Figure 36. Asia Pacific Edible Oils Revenue (USD Million) By Product (2021-2032)
Figure 37. South America Edible Oils Revenue (USD Million) By Type (2021-2032)
Figure 38. South America Edible Oils Revenue (USD Million) By Application (2021-2032)
Figure 39. South America Edible Oils Revenue (USD Million) By Product (2021-2032)
Figure 40. Middle East and Africa Edible Oils Revenue (USD Million) By Type (2021-2032)
Figure 41. Middle East and Africa Edible Oils Revenue (USD Million) By Application (2021-2032)
Figure 42. Middle East and Africa Edible Oils Revenue (USD Million) By Product (2021-2032)
By Product
Palm Oil
Soybean Oil
Sunflower Oil
Rapeseed Oil
Olive Oil
Others
By Packaging
Pouches
Jars
Cans
Bottles
Others
By End-User
Domestic
Industrial
Food Service
Countries Analyzed
North America (US, Canada, Mexico)
Europe (Germany, UK, France, Spain, Italy, Russia, Rest of Europe)
Asia Pacific (China, India, Japan, South Korea, Australia, South East Asia, Rest of Asia)
South America (Brazil, Argentina, Rest of South America)
Middle East and Africa (Saudi Arabia, UAE, Rest of Middle East, South Africa, Egypt, Rest of Africa)
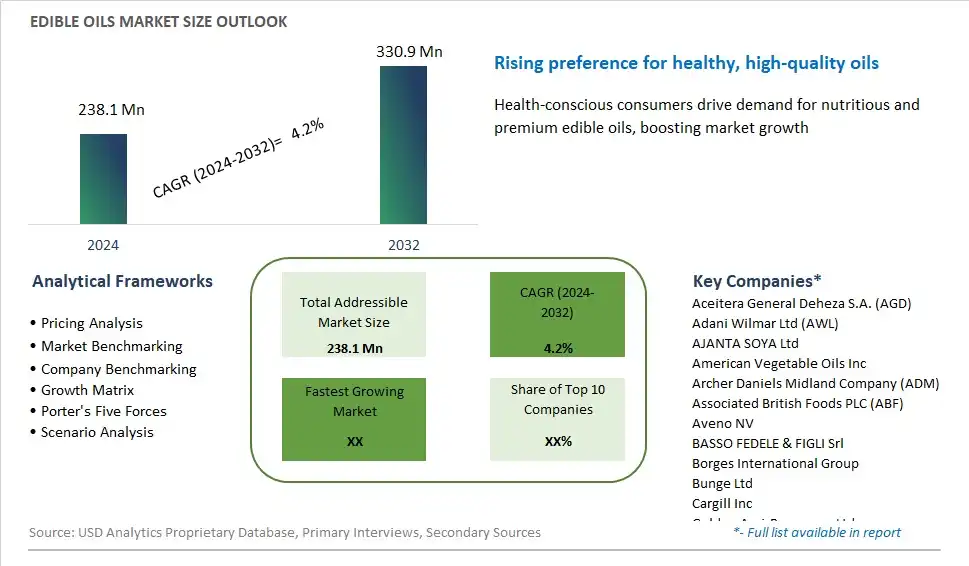
Global Edible Oils Market Size is valued at $238.1 Million in 2024 and is forecast to register a growth rate (CAGR) of 4.2% to reach $330.9 Million by 2032.
Emerging Markets across Asia Pacific, Europe, and Americas present robust growth prospects.
Aceitera General Deheza S.A. (AGD), Adani Wilmar Ltd (AWL), AJANTA SOYA Ltd, American Vegetable Oils Inc, Archer Daniels Midland Company (ADM), Associated British Foods PLC (ABF), Aveno NV, BASSO FEDELE & FIGLI Srl, Borges International Group, Bunge Ltd, Cargill Inc, Golden Agri-Resources Ltd, GrainCorp, hebany, Louis Dreyfus Company B.V., RICHARDSON INTERNATIONAL Ltd, Sime DarBy Plantation Berhad, Sunora Foods, The Nisshin OilliO Group Ltd, United Plantations Berhad, VICENTIN S.A.I.C., Wilmar International Ltd
Base Year- 2023; Estimated Year- 2024; Historic Period- 2018-2023; Forecast period- 2024 to 2032; Currency: Revenue (USD); Volume