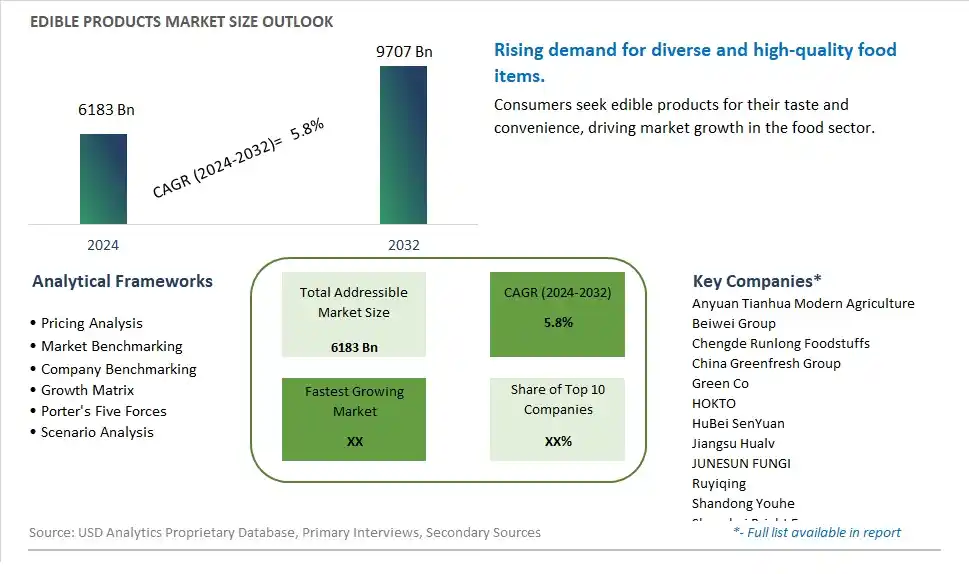
Global Edible Products Market Size is valued at $6183 Billion in 2024 and is forecast to register a growth rate (CAGR) of 5.8% to reach $9707 Billion by 2032.
The global Edible Products Market Comprehensive Study analyzes and forecasts the market size across 6 regions and 24 countries for diverse segments -By Type (Shiitake, Auricularia Auricula-judae, Pleurotus Ostreatus, Enokitake, Agaricus Bisporus, Others), By Application (Fresh Mushrooms, Dried Mushrooms, Canned Mushrooms, Frozen Mushrooms, Others)
An Introduction to Edible Products Market
In 2024, the Edible Products market is thriving, encompassing a wide range of food items designed for consumption. The market includes everything from snacks and beverages to culinary ingredients and dietary supplements. The market benefits from the growing demand for convenient, nutritious, and innovative food products, the increasing trend of health and wellness, and advancements in food processing and packaging technologies. Additionally, the expansion of clean label, organic, and functional food categories is driving market growth.
Edible Products Competitive Landscape
The market report analyses the leading companies in the industry including Anyuan Tianhua Modern Agriculture, Beiwei Group, Chengde Runlong Foodstuffs, China Greenfresh Group, Green Co, HOKTO, HuBei SenYuan, Jiangsu Hualv, JUNESUN FUNGI, Ruyiqing, Shandong Youhe, Shanghai Bright Esunyes, Shanghai Finc Bio Tech, Shenzhen Dalishi, Starway Bio-technology, Xuerong Biotechnology, Yukiguni Maitake, Zhuhai Sunny Evergreen Food, and Others.
Edible Products Market Dynamics
Edible Products Market Trend: Increasing Demand for Plant-Based and Functional Foods
The edible products market is experiencing a significant trend towards plant-based and functional foods. Consumers are increasingly seeking food products that offer health benefits beyond basic nutrition, such as improved digestion, enhanced immunity, and overall well-being. Plant-based foods, in particular, are gaining traction due to their perceived health benefits and lower environmental impact compared to animal-based products. This trend is driven by a growing awareness of health, sustainability, and ethical concerns, leading to a rise in the consumption of products like plant-based proteins, fortified foods, and functional snacks that cater to these preferences.
Edible Products Market Driver: Rising Health Consciousness and Lifestyle Diseases
A major driver for the edible products market is the rising health consciousness among consumers and the increasing prevalence of lifestyle diseases. As more individuals become aware of the link between diet and health, there is a greater demand for foods that support healthy living and help prevent conditions such as obesity, diabetes, and cardiovascular diseases. This driver is also influenced by public health initiatives and educational campaigns that promote the benefits of balanced nutrition and healthier eating habits. The shift towards proactive health management through diet significantly boosts the demand for nutritious and health-enhancing edible products.
Edible Products Market Opportunity: Innovation in Clean Label and Sustainable Products
The edible products market holds significant opportunities for innovation in clean label and sustainable products. Companies can develop new offerings that feature simple, natural ingredients and transparent labeling to meet the growing consumer demand for clean and wholesome foods. Additionally, there is potential for expanding the range of sustainable food products, including those that utilize environmentally friendly practices, such as reduced packaging, ethical sourcing, and waste minimization. Leveraging digital marketing and e-commerce platforms can enhance product visibility and accessibility, reaching a broader audience. Collaborations with health influencers and nutritionists to educate consumers about the benefits of clean label and sustainable products can further drive market growth and consumer engagement.
Edible Products Market Share Analysis: Shiitake Mushrooms segment generated the highest revenue share in the industry
In the Edible Products Market, the largest segment is Shiitake mushrooms. Shiitake mushrooms are widely recognized for their distinct flavor, nutritional benefits, and culinary versatility, making them a popular choice among consumers globally. They are rich in vitamins, minerals, and antioxidants, contributing to their status as a health-promoting food. Shiitake mushrooms are extensively used in various cuisines, including Asian dishes, soups, stir-fries, and salads, due to their umami-rich taste and meaty texture. Their popularity in both traditional and modern culinary practices, coupled with increasing awareness of their health benefits, drives the dominance of the Shiitake mushrooms segment in the edible products market.
Edible Products Market Share Analysis: Frozen Mushrooms is the fastest growing segment over the forecast period to 2032
The fastest-growing segment in the Edible Products Market is the application category of Frozen Mushrooms. Frozen mushrooms have witnessed a surge in demand due to their convenience, longer shelf life, and retention of nutritional value compared to other preservation methods. Consumers are increasingly opting for frozen mushrooms as they offer year-round availability, ease of storage, and quick preparation in various dishes. Further, advancements in freezing technologies ensure that frozen mushrooms maintain their texture, flavor, and nutrient content, making them a preferred choice for food manufacturers, restaurants, and households. The growing trend of convenience foods and the rising preference for healthy and natural ingredients contribute to the rapid growth of frozen mushrooms in the edible products market, positioning them as a key segment to watch in the coming years.
Edible Products Market Segmentation
By Type
Shiitake
Auricularia Auricula-judae
Pleurotus Ostreatus
Enokitake
Agaricus Bisporus
Others
By Application
Fresh Mushrooms
Dried Mushrooms
Canned Mushrooms
Frozen Mushrooms
Others
Countries Analyzed
North America (US, Canada, Mexico)
Europe (Germany, UK, France, Spain, Italy, Russia, Rest of Europe)
Asia Pacific (China, India, Japan, South Korea, Australia, South East Asia, Rest of Asia)
South America (Brazil, Argentina, Rest of South America)
Middle East and Africa (Saudi Arabia, UAE, Rest of Middle East, South Africa, Egypt, Rest of Africa)
Edible Products Companies Profiled in the Study
Anyuan Tianhua Modern Agriculture
Beiwei Group
Chengde Runlong Foodstuffs
China Greenfresh Group
Green Co
HOKTO
HuBei SenYuan
Jiangsu Hualv
JUNESUN FUNGI
Ruyiqing
Shandong Youhe
Shanghai Bright Esunyes
Shanghai Finc Bio Tech
Shenzhen Dalishi
Starway Bio-technology
Xuerong Biotechnology
Yukiguni Maitake
Zhuhai Sunny Evergreen Food
*- List Not Exhaustive
Chapter 1. TABLE OF CONTENTS
Chapter 2. Introduction to Edible Products Market
2.1. Market Overview
2.2. Key Statistics and Report Highlights
2.3. Scope of the Comprehensive Study
2.3.1. Market Definition
2.3.2 Countries and Regions Covered
2.3.3 Research Objective
2.3.4 Units, Currency, and Conversions
2.3.5 Industry Value Chain
2.4. Key Market Segments
2.5. Key Companies
2.6. Study Period
Chapter 3. Strategic Analysis Review
3.1. Edible Products Pricing Analysis and Forecast
3.2. Porter’s Five Forces
3.3. Market Ecosystem
3.4. SWOT Analysis
3.5. Regulatory Scenario
3.3. Effects of Inflation, Russia-Ukraine War, moderating economic growth, and other macroeconomic factors
Chapter 4. Competitive Landscape
4.1. Market Share Analysis
4.1.1. Global Edible Products Market Share by Company, 2023
4.1.2. Product Offerings of Leading Edible Products Companies
4.2. Market Entropy
4.2.1. New Product Launches in the Industry
4.2.2. Mergers, Acquisitions, Joint ventures, and Partnerships
4.3. Key Strategies and Best Practices
Chapter 5. Global Market Projections: Best, Reference, and Low Case Scenarios
5.1. Growth Analysis- Case Scenario Definitions
5.2. Low Growth Case Scenario Forecasts
5.3. Reference Growth Case Scenario Forecasts
5.4. High Growth Case Scenario Forecasts
Chapter 6. Market Dynamics
6.1. Edible Products Market Drivers
6.2. Edible Products Market Challenges
6.6. Edible Products Market Opportunities
6.4. Edible Products Market Trends
Chapter 7. Global Edible Products Market Outlook Trends
7.1. Global Edible Products Revenue (USD Million) and CAGR (%) by Type (2021-2032)
7.2. Global Edible Products Revenue (USD Million) and CAGR (%) by Application (2021-2032)
7.3. Global Edible Products Revenue (USD Million) and CAGR (%) by Product (2021-2032)
By Type
Shiitake
Auricularia Auricula-judae
Pleurotus Ostreatus
Enokitake
Agaricus Bisporus
Others
By Application
Fresh Mushrooms
Dried Mushrooms
Canned Mushrooms
Frozen Mushrooms
Others
Chapter 8. Global Edible Products Regional Analysis and Outlook
8.1. Global Edible Products Revenue (USD Million) By Regions (2021- 2032)
8.2. North America Edible Products Revenue (USD Million) by Country (2021-2032)
8.2.1. United States Edible Products Regional Analysis and Outlook
8.2.2. Canada Edible Products Regional Analysis and Outlook
8.2.3. Mexico Edible Products Regional Analysis and Outlook
8.3. Europe Edible Products Revenue (USD Million), by Country (2021-2032)
8.3.1. Germany Edible Products Regional Analysis and Outlook
8.3.2. France Edible Products Regional Analysis and Outlook
8.3.3. United Kingdom Edible Products Regional Analysis and Outlook
8.3.4. Spain Edible Products Regional Analysis and Outlook
8.3.5. Italy Edible Products Regional Analysis and Outlook
8.3.6. Russia Edible Products Regional Analysis and Outlook
8.3.7. Rest of Europe Edible Products Regional Analysis and Outlook
8.4. Asia Pacific Edible Products Revenue (USD Million) by Country (2021-2032)
8.4.1. China Edible Products Regional Analysis and Outlook
8.4.2. Japan Edible Products Regional Analysis and Outlook
8.4.3. India Edible Products Regional Analysis and Outlook
8.4.4. South Korea Edible Products Regional Analysis and Outlook
8.4.5. Australia Edible Products Regional Analysis and Outlook
8.4.6. South East Asia Edible Products Regional Analysis and Outlook
8.4.7. Rest of Asia Pacific Edible Products Regional Analysis and Outlook
8.5. South America Edible Products Revenue (USD Million), by Country (2021-2032)
8.5.1. Brazil Edible Products Regional Analysis and Outlook
8.5.2. Argentina Edible Products Regional Analysis and Outlook
8.5.3. Rest of South America Edible Products Regional Analysis and Outlook
8.6. Middle East and Africa Edible Products Revenue (USD Million) by Country (2021-2032)
8.6.1. Middle East Edible Products Regional Analysis and Outlook
8.6.2. Africa Edible Products Regional Analysis and Outlook
Chapter 9. North America Edible Products Analysis and Outlook
9.1. North America Edible Products Revenue (USD Million) by Segments (2021-2032)
9.1.1. North America Edible Products Revenue (USD Million) by Type (2021-2032)
9.1.2. North America Edible Products Revenue (USD Million) by Application (2021-2032)
9.1.3. North America Edible Products Revenue (USD Million) by Product (2021-2032)
By Type
Shiitake
Auricularia Auricula-judae
Pleurotus Ostreatus
Enokitake
Agaricus Bisporus
Others
By Application
Fresh Mushrooms
Dried Mushrooms
Canned Mushrooms
Frozen Mushrooms
Others
Chapter 10. Europe Edible Products Analysis and Outlook
10.1. Europe Edible Products Revenue (USD Million), by Segments (USD Million) (2021-2032)
10.1.1. Europe Edible Products Revenue (USD Million) by Type (2021-2032)
10.1.2. Europe Edible Products Revenue (USD Million) by Application (2021-2032)
10.1.3. Europe Edible Products Revenue (USD Million) by Product (2021-2032)
By Type
Shiitake
Auricularia Auricula-judae
Pleurotus Ostreatus
Enokitake
Agaricus Bisporus
Others
By Application
Fresh Mushrooms
Dried Mushrooms
Canned Mushrooms
Frozen Mushrooms
Others
Chapter 11. Asia Pacific Edible Products Analysis and Outlook
11.1. Asia Pacific Edible Products Revenue (USD Million), and Revenue (USD Million) by Segments (2021-2032)
11.1.1. Asia Pacific Edible Products Revenue (USD Million) by Type (2021-2032)
11.1.2. Asia Pacific Edible Products Revenue (USD Million) by Application (2021-2032)
11.1.3. Asia Pacific Edible Products Revenue (USD Million) by Product (2021-2032)
By Type
Shiitake
Auricularia Auricula-judae
Pleurotus Ostreatus
Enokitake
Agaricus Bisporus
Others
By Application
Fresh Mushrooms
Dried Mushrooms
Canned Mushrooms
Frozen Mushrooms
Others
Chapter 12. South America Edible Products Analysis and Outlook
12.1. South America Edible Products Revenue (USD Million), by Segments (2021-2032)
12.1.1. South America Edible Products Revenue (USD Million) by Type (2021-2032)
12.1.2. South America Edible Products Revenue (USD Million) by Application (2021-2032)
12.1.3. South America Edible Products Revenue (USD Million) by Product (2021-2032)
By Type
Shiitake
Auricularia Auricula-judae
Pleurotus Ostreatus
Enokitake
Agaricus Bisporus
Others
By Application
Fresh Mushrooms
Dried Mushrooms
Canned Mushrooms
Frozen Mushrooms
Others
Chapter 13. Middle East and Africa Edible Products Analysis and Outlook
13.1. Middle East and Africa Edible Products Revenue (USD Million), by Segments (2021-2032)
13.1.1. Middle East and Africa Edible Products Revenue (USD Million) by Type (2021-2032)
13.1.2. Middle East and Africa Edible Products Revenue (USD Million) by Application (2021-2032)
13.1.3. Middle East and Africa Edible Products Revenue (USD Million) by Product (2021-2032)
By Type
Shiitake
Auricularia Auricula-judae
Pleurotus Ostreatus
Enokitake
Agaricus Bisporus
Others
By Application
Fresh Mushrooms
Dried Mushrooms
Canned Mushrooms
Frozen Mushrooms
Others
Chapter 14. Edible Products Company Profiles
14.1 Business Overview
14.2 Product Profiles
14.3 SWOT Profiles
14.5 Recent Developments
14.6 Financial Profile
List of Companies
Anyuan Tianhua Modern Agriculture
Beiwei Group
Chengde Runlong Foodstuffs
China Greenfresh Group
Green Co
HOKTO
HuBei SenYuan
Jiangsu Hualv
JUNESUN FUNGI
Ruyiqing
Shandong Youhe
Shanghai Bright Esunyes
Shanghai Finc Bio Tech
Shenzhen Dalishi
Starway Bio-technology
Xuerong Biotechnology
Yukiguni Maitake
Zhuhai Sunny Evergreen Food
15. Methodology and Data Sources
15.1 Customization Offerings
15.2 Subscription Services
15.3 Related Reports
15.4 Publisher Expertise
LIST OF TABLES
Table 1 Market Segmentation Analysis
Table 2 Global Edible Products Market Share of Leading Companies, 2023
Table 3 Product Offerings of Leading Companies
Table 4 Low Growth Scenario Forecasts
Table 5 Reference Case Growth Scenario
Table 6 High Growth Case Scenario
Table 7 Global Edible Products Revenue (USD Million) And CAGR (%) By Type (2021-2032)
Table 8 Global Edible Products Revenue (USD Million) And CAGR (%) By Application (2021-2032)
Table 9 Global Edible Products Revenue (USD Million) And CAGR (%) By Product (2021-2032)
Table 10 Global Edible Products Market Revenue (USD Million) By Regions (2021-2032)
Table 11 Global Edible Products Market Share (%) By Regions (2021-2032)
Table 12 North America Edible Products Revenue (USD Million) By Country (2021-2032)
Table 13 Europe Edible Products Revenue (USD Million) By Country (2021-2032)
Table 14 Asia Pacific Edible Products Revenue (USD Million) By Country (2021-2032)
Table 15 South America Edible Products Revenue (USD Million) By Country (2021-2032)
Table 16 Middle East and Africa Edible Products Revenue (USD Million) By Region (2021-2032)
Table 17 North America Edible Products Revenue (USD Million) By Type (2021-2032)
Table 18 North America Edible Products Revenue (USD Million) By Application (2021-2032)
Table 19 North America Edible Products Revenue (USD Million) By Product (2021-2032)
Table 20 Europe Edible Products Revenue (USD Million) By Type (2021-2032)
Table 21 Europe Edible Products Revenue (USD Million) By Application (2021-2032)
Table 22 Europe Edible Products Revenue (USD Million) By Product (2021-2032)
Table 23 Asia Pacific Edible Products Revenue (USD Million) By Type (2021-2032)
Table 24 Asia Pacific Edible Products Revenue (USD Million) By Application (2021-2032)
Table 25 Asia Pacific Edible Products Revenue (USD Million) By Product (2021-2032)
Table 26 South America Edible Products Revenue (USD Million) By Type (2021-2032)
Table 27 South America Edible Products Revenue (USD Million) By Application (2021-2032)
Table 28 South America Edible Products Revenue (USD Million) By Product (2021-2032)
Table 29 Middle East and Africa Edible Products Revenue (USD Million) By Type (2021-2032)
Table 30 Middle East and Africa Edible Products Revenue (USD Million) By Application (2021-2032)
Table 31 Middle East and Africa Edible Products Revenue (USD Million) By Product (2021-2032)
LIST OF FIGURES
Figure 1. Market Scope
Figure 2. Pricing Forecasts Per Unit, 2023- 2032
Figure 3. Porter’s Five Forces
Figure 4. Global Edible Products Market Revenue (USD Million) By Regions (2021-2032)
Figure 5. Global Edible Products Market Share (%) By Regions (2023)
Figure 6. North America Edible Products Revenue (USD Million) By Country (2021-2032)
Figure 7. United States Edible Products Revenue (USD Million) By Country (2021-2032)
Figure 8. Canada Edible Products Revenue (USD Million) By Country (2021-2032)
Figure 9. Mexico Edible Products Revenue (USD Million) By Country (2021-2032)
Figure 10. Europe Edible Products Revenue (USD Million) By Country (2021-2032)
Figure 11. Germany Edible Products Revenue (USD Million) By Country (2021-2032)
Figure 12. France Edible Products Revenue (USD Million) By Country (2021-2032)
Figure 13. United Kingdom Edible Products Revenue (USD Million) By Country (2021-2032)
Figure 14. Spain Edible Products Revenue (USD Million) By Country (2021-2032)
Figure 15. Italy Edible Products Revenue (USD Million) By Country (2021-2032)
Figure 16. Russia Edible Products Revenue (USD Million) By Country (2021-2032)
Figure 17. Rest of Europe Edible Products Revenue (USD Million) By Country (2021-2032)
Figure 11. Asia Pacific Edible Products Revenue (USD Million) By Country (2021-2032)
Figure 12. China Edible Products Revenue (USD Million) By Country (2021-2032)
Figure 13. Japan Edible Products Revenue (USD Million) By Country (2021-2032)
Figure 14. India Edible Products Revenue (USD Million) By Country (2021-2032)
Figure 15. South Korea Edible Products Revenue (USD Million) By Country (2021-2032)
Figure 16. Australia Edible Products Revenue (USD Million) By Country (2021-2032)
Figure 17. South East Asia Edible Products Revenue (USD Million) By Country (2021-2032)
Figure 18. South America Edible Products Revenue (USD Million) By Country (2021-2032)
Figure 19. Brazil Edible Products Revenue (USD Million) By Country (2021-2032)
Figure 20. Argentina Edible Products Revenue (USD Million) By Country (2021-2032)
Figure 21. Rest of Asia Pacific Edible Products Revenue (USD Million) By Country (2021-2032)
Figure 22. Middle East and Africa Edible Products Revenue (USD Million) By Region (2021-2032)
Figure 23. Saudi Arabia Edible Products Revenue (USD Million) By Region (2021-2032)
Figure 24. The UAE Edible Products Revenue (USD Million) By Region (2021-2032)
Figure 25. Rest of Middle East Edible Products Revenue (USD Million) By Region (2021-2032)
Figure 26. South Africa Edible Products Revenue (USD Million) By Region (2021-2032)
Figure 27. Africa Edible Products Revenue (USD Million) By Region (2021-2032)
Figure 28. North America Edible Products Revenue (USD Million) By Type (2021-2032)
Figure 29. North America Edible Products Revenue (USD Million) By Application (2021-2032)
Figure 30. North America Edible Products Revenue (USD Million) By Product (2021-2032)
Figure 31. Europe Edible Products Revenue (USD Million) By Type (2021-2032)
Figure 32. Europe Edible Products Revenue (USD Million) By Application (2021-2032)
Figure 33. Europe Edible Products Revenue (USD Million) By Product (2021-2032)
Figure 34. Asia Pacific Edible Products Revenue (USD Million) By Type (2021-2032)
Figure 35. Asia Pacific Edible Products Revenue (USD Million) By Application (2021-2032)
Figure 36. Asia Pacific Edible Products Revenue (USD Million) By Product (2021-2032)
Figure 37. South America Edible Products Revenue (USD Million) By Type (2021-2032)
Figure 38. South America Edible Products Revenue (USD Million) By Application (2021-2032)
Figure 39. South America Edible Products Revenue (USD Million) By Product (2021-2032)
Figure 40. Middle East and Africa Edible Products Revenue (USD Million) By Type (2021-2032)
Figure 41. Middle East and Africa Edible Products Revenue (USD Million) By Application (2021-2032)
Figure 42. Middle East and Africa Edible Products Revenue (USD Million) By Product (2021-2032)
By Type
Shiitake
Auricularia Auricula-judae
Pleurotus Ostreatus
Enokitake
Agaricus Bisporus
Others
By Application
Fresh Mushrooms
Dried Mushrooms
Canned Mushrooms
Frozen Mushrooms
Others
Countries Analyzed
North America (US, Canada, Mexico)
Europe (Germany, UK, France, Spain, Italy, Russia, Rest of Europe)
Asia Pacific (China, India, Japan, South Korea, Australia, South East Asia, Rest of Asia)
South America (Brazil, Argentina, Rest of South America)
Middle East and Africa (Saudi Arabia, UAE, Rest of Middle East, South Africa, Egypt, Rest of Africa)
