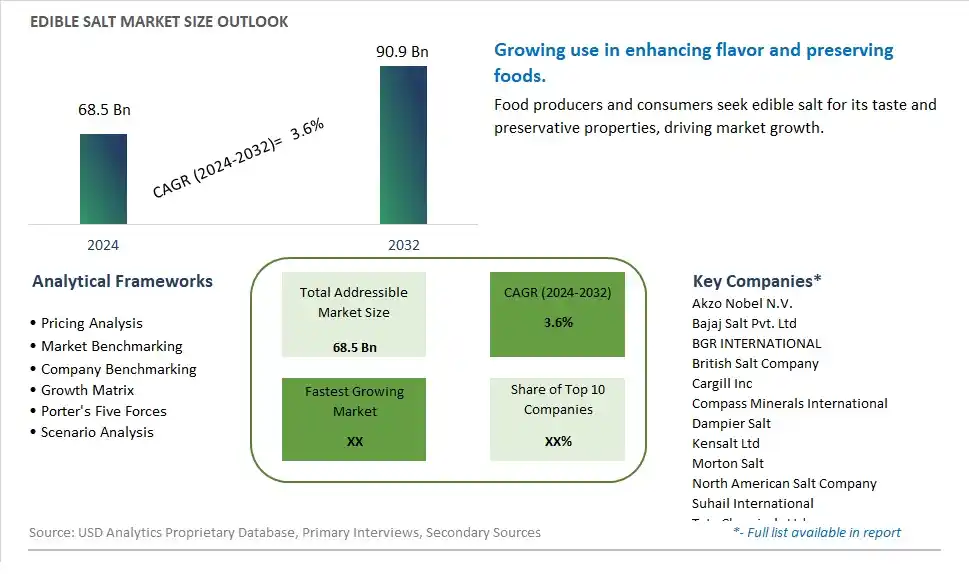
Global Edible Salt Market Size is valued at $68.5 Billion in 2024 and is forecast to register a growth rate (CAGR) of 3.6% to reach $90.9 Billion by 2032.
The global Edible Salt Market Comprehensive Study analyzes and forecasts the market size across 6 regions and 24 countries for diverse segments -By Type (Mineral Halite, Rock Salt), By Application (Food, Chemical, Industrial, Medical, Others)
An Introduction to Edible Salt Market
In 2024, the Edible Salt market is experiencing steady growth, driven by its essential role in cooking and food preservation. Edible salt, available in various forms such as table salt, sea salt, and Himalayan pink salt, is a fundamental ingredient in kitchens worldwide. The market benefits from the rising demand for gourmet and specialty salts, the increasing trend of health-conscious eating, and the expansion of the food processing industry. Additionally, advancements in salt extraction and purification technologies are enhancing product quality and safety.
Edible Salt Competitive Landscape
The market report analyses the leading companies in the industry including Akzo Nobel N.V., Bajaj Salt Pvt. Ltd, BGR INTERNATIONAL, British Salt Company, Cargill Inc, Compass Minerals International, Dampier Salt, Kensalt Ltd, Morton Salt, North American Salt Company, Suhail International, Tata Chemicals Ltd, and Others.
Edible Salt Market Dynamics
Edible Salt Market Trend: Increasing Demand for Specialty and Flavored Salts
The edible salt market is experiencing a significant trend towards specialty and flavored salts. Consumers are becoming more adventurous and discerning in their culinary tastes, seeking unique and artisanal salt varieties that offer distinct flavors and textures. This trend is driven by the growing popularity of gourmet cooking and the desire to enhance the flavor profiles of home-cooked meals. Specialty salts, such as Himalayan pink salt, sea salt flakes, smoked salt, and herb-infused salts, are gaining traction as they add a gourmet touch to both everyday dishes and elaborate recipes. The rise of food shows, social media cooking influencers, and an increasing interest in global cuisines further support this trend.
Edible Salt Market Driver: Rising Health Awareness and Demand for Natural Ingredients
A major driver for the edible salt market is the rising health awareness among consumers and the increasing demand for natural ingredients. As people become more conscious of their dietary choices, there is a growing preference for salts that are minimally processed and free from additives. Natural salts like sea salt and Himalayan pink salt, which are perceived to be healthier alternatives to regular table salt, are particularly popular. These salts often contain trace minerals and are marketed as providing additional health benefits. The shift towards clean eating and the desire to reduce sodium intake without sacrificing flavor also drive the demand for these natural and less processed salt options.
Edible Salt Market Opportunity: Innovation in Sustainable and Ethically Sourced Salts
The edible salt market holds significant opportunities for innovation in sustainable and ethically sourced products. Companies can capitalize on the growing consumer interest in sustainability by offering salts that are harvested using environmentally friendly methods and support fair trade practices. There is potential for developing a range of eco-friendly packaging options to appeal to environmentally conscious consumers. Additionally, expanding into new markets through online platforms and specialty food retailers can enhance product visibility and accessibility. Collaborations with chefs, food bloggers, and health influencers to promote the unique qualities and sustainable sourcing of these salts can further drive market growth and consumer engagement, positioning them as premium and responsible choices in the edible salt market.
Edible Salt Market Share Analysis: Mineral Halite segment generated the highest revenue share in the industry
The largest segment in the Edible Salt Market is Mineral Halite, also known as table salt. Mineral Halite is the most commonly used type of salt globally and is derived from salt mines or through evaporation of seawater. It is widely consumed in households, restaurants, and food processing industries for seasoning, preserving food, and enhancing flavor profiles. Its versatility and affordability make it a staple ingredient in various cuisines and food products. Mineral Halite is valued not only for its taste but also for its role in food preservation, texture enhancement, and overall culinary appeal. Its widespread use across different food sectors solidifies its position as the largest segment in the Edible Salt Market.
Edible Salt Market Share Analysis: Food is the fastest growing segment over the forecast period to 2032
The fastest-growing segment in the Edible Salt Market is the Food application category. This includes the use of salt in food processing, cooking, baking, seasoning, and preservation across various food products and cuisines. The growth of the Food segment is driven by several factors, including the increasing demand for processed and convenience foods, the rising popularity of savory snacks, and the expanding foodservice industry. Salt plays a crucial role in enhancing the taste, texture, and shelf life of food products, making it an indispensable ingredient in the food industry. Additionally, salt is used in food preservation techniques, such as pickling and curing, further contributing to its demand in the food sector. As a result, the Food application segment within the Edible Salt Market is expected to experience significant growth and market expansion by 2032.
Edible Salt Market Segmentation
By Type
Mineral Halite
Rock Salt
By Application
Food
Chemical
Industrial
Medical
Others
Countries Analyzed
North America (US, Canada, Mexico)
Europe (Germany, UK, France, Spain, Italy, Russia, Rest of Europe)
Asia Pacific (China, India, Japan, South Korea, Australia, South East Asia, Rest of Asia)
South America (Brazil, Argentina, Rest of South America)
Middle East and Africa (Saudi Arabia, UAE, Rest of Middle East, South Africa, Egypt, Rest of Africa)
Edible Salt Companies Profiled in the Study
Akzo Nobel N.V.
Bajaj Salt Pvt. Ltd
BGR INTERNATIONAL
British Salt Company
Cargill Inc
Compass Minerals International
Dampier Salt
Kensalt Ltd
Morton Salt
North American Salt Company
Suhail International
Tata Chemicals Ltd
*- List Not Exhaustive
Chapter 1. TABLE OF CONTENTS
Chapter 2. Introduction to Edible Salt Market
2.1. Market Overview
2.2. Key Statistics and Report Highlights
2.3. Scope of the Comprehensive Study
2.3.1. Market Definition
2.3.2 Countries and Regions Covered
2.3.3 Research Objective
2.3.4 Units, Currency, and Conversions
2.3.5 Industry Value Chain
2.4. Key Market Segments
2.5. Key Companies
2.6. Study Period
Chapter 3. Strategic Analysis Review
3.1. Edible Salt Pricing Analysis and Forecast
3.2. Porter’s Five Forces
3.3. Market Ecosystem
3.4. SWOT Analysis
3.5. Regulatory Scenario
3.3. Effects of Inflation, Russia-Ukraine War, moderating economic growth, and other macroeconomic factors
Chapter 4. Competitive Landscape
4.1. Market Share Analysis
4.1.1. Global Edible Salt Market Share by Company, 2023
4.1.2. Product Offerings of Leading Edible Salt Companies
4.2. Market Entropy
4.2.1. New Product Launches in the Industry
4.2.2. Mergers, Acquisitions, Joint ventures, and Partnerships
4.3. Key Strategies and Best Practices
Chapter 5. Global Market Projections: Best, Reference, and Low Case Scenarios
5.1. Growth Analysis- Case Scenario Definitions
5.2. Low Growth Case Scenario Forecasts
5.3. Reference Growth Case Scenario Forecasts
5.4. High Growth Case Scenario Forecasts
Chapter 6. Market Dynamics
6.1. Edible Salt Market Drivers
6.2. Edible Salt Market Challenges
6.6. Edible Salt Market Opportunities
6.4. Edible Salt Market Trends
Chapter 7. Global Edible Salt Market Outlook Trends
7.1. Global Edible Salt Revenue (USD Million) and CAGR (%) by Type (2021-2032)
7.2. Global Edible Salt Revenue (USD Million) and CAGR (%) by Application (2021-2032)
7.3. Global Edible Salt Revenue (USD Million) and CAGR (%) by Product (2021-2032)
By Type
Mineral Halite
Rock Salt
By Application
Food
Chemical
Industrial
Medical
Others
Chapter 8. Global Edible Salt Regional Analysis and Outlook
8.1. Global Edible Salt Revenue (USD Million) By Regions (2021- 2032)
8.2. North America Edible Salt Revenue (USD Million) by Country (2021-2032)
8.2.1. United States Edible Salt Regional Analysis and Outlook
8.2.2. Canada Edible Salt Regional Analysis and Outlook
8.2.3. Mexico Edible Salt Regional Analysis and Outlook
8.3. Europe Edible Salt Revenue (USD Million), by Country (2021-2032)
8.3.1. Germany Edible Salt Regional Analysis and Outlook
8.3.2. France Edible Salt Regional Analysis and Outlook
8.3.3. United Kingdom Edible Salt Regional Analysis and Outlook
8.3.4. Spain Edible Salt Regional Analysis and Outlook
8.3.5. Italy Edible Salt Regional Analysis and Outlook
8.3.6. Russia Edible Salt Regional Analysis and Outlook
8.3.7. Rest of Europe Edible Salt Regional Analysis and Outlook
8.4. Asia Pacific Edible Salt Revenue (USD Million) by Country (2021-2032)
8.4.1. China Edible Salt Regional Analysis and Outlook
8.4.2. Japan Edible Salt Regional Analysis and Outlook
8.4.3. India Edible Salt Regional Analysis and Outlook
8.4.4. South Korea Edible Salt Regional Analysis and Outlook
8.4.5. Australia Edible Salt Regional Analysis and Outlook
8.4.6. South East Asia Edible Salt Regional Analysis and Outlook
8.4.7. Rest of Asia Pacific Edible Salt Regional Analysis and Outlook
8.5. South America Edible Salt Revenue (USD Million), by Country (2021-2032)
8.5.1. Brazil Edible Salt Regional Analysis and Outlook
8.5.2. Argentina Edible Salt Regional Analysis and Outlook
8.5.3. Rest of South America Edible Salt Regional Analysis and Outlook
8.6. Middle East and Africa Edible Salt Revenue (USD Million) by Country (2021-2032)
8.6.1. Middle East Edible Salt Regional Analysis and Outlook
8.6.2. Africa Edible Salt Regional Analysis and Outlook
Chapter 9. North America Edible Salt Analysis and Outlook
9.1. North America Edible Salt Revenue (USD Million) by Segments (2021-2032)
9.1.1. North America Edible Salt Revenue (USD Million) by Type (2021-2032)
9.1.2. North America Edible Salt Revenue (USD Million) by Application (2021-2032)
9.1.3. North America Edible Salt Revenue (USD Million) by Product (2021-2032)
By Type
Mineral Halite
Rock Salt
By Application
Food
Chemical
Industrial
Medical
Others
Chapter 10. Europe Edible Salt Analysis and Outlook
10.1. Europe Edible Salt Revenue (USD Million), by Segments (USD Million) (2021-2032)
10.1.1. Europe Edible Salt Revenue (USD Million) by Type (2021-2032)
10.1.2. Europe Edible Salt Revenue (USD Million) by Application (2021-2032)
10.1.3. Europe Edible Salt Revenue (USD Million) by Product (2021-2032)
By Type
Mineral Halite
Rock Salt
By Application
Food
Chemical
Industrial
Medical
Others
Chapter 11. Asia Pacific Edible Salt Analysis and Outlook
11.1. Asia Pacific Edible Salt Revenue (USD Million), and Revenue (USD Million) by Segments (2021-2032)
11.1.1. Asia Pacific Edible Salt Revenue (USD Million) by Type (2021-2032)
11.1.2. Asia Pacific Edible Salt Revenue (USD Million) by Application (2021-2032)
11.1.3. Asia Pacific Edible Salt Revenue (USD Million) by Product (2021-2032)
By Type
Mineral Halite
Rock Salt
By Application
Food
Chemical
Industrial
Medical
Others
Chapter 12. South America Edible Salt Analysis and Outlook
12.1. South America Edible Salt Revenue (USD Million), by Segments (2021-2032)
12.1.1. South America Edible Salt Revenue (USD Million) by Type (2021-2032)
12.1.2. South America Edible Salt Revenue (USD Million) by Application (2021-2032)
12.1.3. South America Edible Salt Revenue (USD Million) by Product (2021-2032)
By Type
Mineral Halite
Rock Salt
By Application
Food
Chemical
Industrial
Medical
Others
Chapter 13. Middle East and Africa Edible Salt Analysis and Outlook
13.1. Middle East and Africa Edible Salt Revenue (USD Million), by Segments (2021-2032)
13.1.1. Middle East and Africa Edible Salt Revenue (USD Million) by Type (2021-2032)
13.1.2. Middle East and Africa Edible Salt Revenue (USD Million) by Application (2021-2032)
13.1.3. Middle East and Africa Edible Salt Revenue (USD Million) by Product (2021-2032)
By Type
Mineral Halite
Rock Salt
By Application
Food
Chemical
Industrial
Medical
Others
Chapter 14. Edible Salt Company Profiles
14.1 Business Overview
14.2 Product Profiles
14.3 SWOT Profiles
14.5 Recent Developments
14.6 Financial Profile
List of Companies
Akzo Nobel N.V.
Bajaj Salt Pvt. Ltd
BGR INTERNATIONAL
British Salt Company
Cargill Inc
Compass Minerals International
Dampier Salt
Kensalt Ltd
Morton Salt
North American Salt Company
Suhail International
Tata Chemicals Ltd
15. Methodology and Data Sources
15.1 Customization Offerings
15.2 Subscription Services
15.3 Related Reports
15.4 Publisher Expertise
LIST OF TABLES
Table 1 Market Segmentation Analysis
Table 2 Global Edible Salt Market Share of Leading Companies, 2023
Table 3 Product Offerings of Leading Companies
Table 4 Low Growth Scenario Forecasts
Table 5 Reference Case Growth Scenario
Table 6 High Growth Case Scenario
Table 7 Global Edible Salt Revenue (USD Million) And CAGR (%) By Type (2021-2032)
Table 8 Global Edible Salt Revenue (USD Million) And CAGR (%) By Application (2021-2032)
Table 9 Global Edible Salt Revenue (USD Million) And CAGR (%) By Product (2021-2032)
Table 10 Global Edible Salt Market Revenue (USD Million) By Regions (2021-2032)
Table 11 Global Edible Salt Market Share (%) By Regions (2021-2032)
Table 12 North America Edible Salt Revenue (USD Million) By Country (2021-2032)
Table 13 Europe Edible Salt Revenue (USD Million) By Country (2021-2032)
Table 14 Asia Pacific Edible Salt Revenue (USD Million) By Country (2021-2032)
Table 15 South America Edible Salt Revenue (USD Million) By Country (2021-2032)
Table 16 Middle East and Africa Edible Salt Revenue (USD Million) By Region (2021-2032)
Table 17 North America Edible Salt Revenue (USD Million) By Type (2021-2032)
Table 18 North America Edible Salt Revenue (USD Million) By Application (2021-2032)
Table 19 North America Edible Salt Revenue (USD Million) By Product (2021-2032)
Table 20 Europe Edible Salt Revenue (USD Million) By Type (2021-2032)
Table 21 Europe Edible Salt Revenue (USD Million) By Application (2021-2032)
Table 22 Europe Edible Salt Revenue (USD Million) By Product (2021-2032)
Table 23 Asia Pacific Edible Salt Revenue (USD Million) By Type (2021-2032)
Table 24 Asia Pacific Edible Salt Revenue (USD Million) By Application (2021-2032)
Table 25 Asia Pacific Edible Salt Revenue (USD Million) By Product (2021-2032)
Table 26 South America Edible Salt Revenue (USD Million) By Type (2021-2032)
Table 27 South America Edible Salt Revenue (USD Million) By Application (2021-2032)
Table 28 South America Edible Salt Revenue (USD Million) By Product (2021-2032)
Table 29 Middle East and Africa Edible Salt Revenue (USD Million) By Type (2021-2032)
Table 30 Middle East and Africa Edible Salt Revenue (USD Million) By Application (2021-2032)
Table 31 Middle East and Africa Edible Salt Revenue (USD Million) By Product (2021-2032)
LIST OF FIGURES
Figure 1. Market Scope
Figure 2. Pricing Forecasts Per Unit, 2023- 2032
Figure 3. Porter’s Five Forces
Figure 4. Global Edible Salt Market Revenue (USD Million) By Regions (2021-2032)
Figure 5. Global Edible Salt Market Share (%) By Regions (2023)
Figure 6. North America Edible Salt Revenue (USD Million) By Country (2021-2032)
Figure 7. United States Edible Salt Revenue (USD Million) By Country (2021-2032)
Figure 8. Canada Edible Salt Revenue (USD Million) By Country (2021-2032)
Figure 9. Mexico Edible Salt Revenue (USD Million) By Country (2021-2032)
Figure 10. Europe Edible Salt Revenue (USD Million) By Country (2021-2032)
Figure 11. Germany Edible Salt Revenue (USD Million) By Country (2021-2032)
Figure 12. France Edible Salt Revenue (USD Million) By Country (2021-2032)
Figure 13. United Kingdom Edible Salt Revenue (USD Million) By Country (2021-2032)
Figure 14. Spain Edible Salt Revenue (USD Million) By Country (2021-2032)
Figure 15. Italy Edible Salt Revenue (USD Million) By Country (2021-2032)
Figure 16. Russia Edible Salt Revenue (USD Million) By Country (2021-2032)
Figure 17. Rest of Europe Edible Salt Revenue (USD Million) By Country (2021-2032)
Figure 11. Asia Pacific Edible Salt Revenue (USD Million) By Country (2021-2032)
Figure 12. China Edible Salt Revenue (USD Million) By Country (2021-2032)
Figure 13. Japan Edible Salt Revenue (USD Million) By Country (2021-2032)
Figure 14. India Edible Salt Revenue (USD Million) By Country (2021-2032)
Figure 15. South Korea Edible Salt Revenue (USD Million) By Country (2021-2032)
Figure 16. Australia Edible Salt Revenue (USD Million) By Country (2021-2032)
Figure 17. South East Asia Edible Salt Revenue (USD Million) By Country (2021-2032)
Figure 18. South America Edible Salt Revenue (USD Million) By Country (2021-2032)
Figure 19. Brazil Edible Salt Revenue (USD Million) By Country (2021-2032)
Figure 20. Argentina Edible Salt Revenue (USD Million) By Country (2021-2032)
Figure 21. Rest of Asia Pacific Edible Salt Revenue (USD Million) By Country (2021-2032)
Figure 22. Middle East and Africa Edible Salt Revenue (USD Million) By Region (2021-2032)
Figure 23. Saudi Arabia Edible Salt Revenue (USD Million) By Region (2021-2032)
Figure 24. The UAE Edible Salt Revenue (USD Million) By Region (2021-2032)
Figure 25. Rest of Middle East Edible Salt Revenue (USD Million) By Region (2021-2032)
Figure 26. South Africa Edible Salt Revenue (USD Million) By Region (2021-2032)
Figure 27. Africa Edible Salt Revenue (USD Million) By Region (2021-2032)
Figure 28. North America Edible Salt Revenue (USD Million) By Type (2021-2032)
Figure 29. North America Edible Salt Revenue (USD Million) By Application (2021-2032)
Figure 30. North America Edible Salt Revenue (USD Million) By Product (2021-2032)
Figure 31. Europe Edible Salt Revenue (USD Million) By Type (2021-2032)
Figure 32. Europe Edible Salt Revenue (USD Million) By Application (2021-2032)
Figure 33. Europe Edible Salt Revenue (USD Million) By Product (2021-2032)
Figure 34. Asia Pacific Edible Salt Revenue (USD Million) By Type (2021-2032)
Figure 35. Asia Pacific Edible Salt Revenue (USD Million) By Application (2021-2032)
Figure 36. Asia Pacific Edible Salt Revenue (USD Million) By Product (2021-2032)
Figure 37. South America Edible Salt Revenue (USD Million) By Type (2021-2032)
Figure 38. South America Edible Salt Revenue (USD Million) By Application (2021-2032)
Figure 39. South America Edible Salt Revenue (USD Million) By Product (2021-2032)
Figure 40. Middle East and Africa Edible Salt Revenue (USD Million) By Type (2021-2032)
Figure 41. Middle East and Africa Edible Salt Revenue (USD Million) By Application (2021-2032)
Figure 42. Middle East and Africa Edible Salt Revenue (USD Million) By Product (2021-2032)
By Type
Mineral Halite
Rock Salt
By Application
Food
Chemical
Industrial
Medical
Others
Countries Analyzed
North America (US, Canada, Mexico)
Europe (Germany, UK, France, Spain, Italy, Russia, Rest of Europe)
Asia Pacific (China, India, Japan, South Korea, Australia, South East Asia, Rest of Asia)
South America (Brazil, Argentina, Rest of South America)
Middle East and Africa (Saudi Arabia, UAE, Rest of Middle East, South Africa, Egypt, Rest of Africa)
