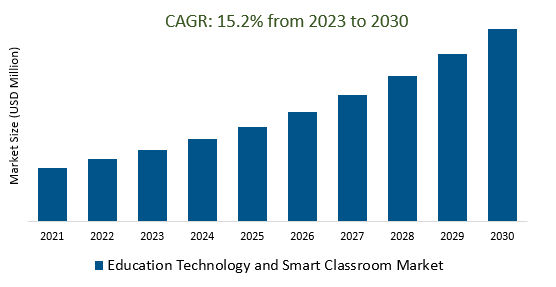
The Global Education Technology and Smart Classroom Market Size is estimated to register 15.2% growth over the forecast period from 2023 to 2030.
The market growth is driven by an increasing Internet of Things is being used to create smart classrooms with connected devices and sensors to enhance the learning environment. Leading Companies focusing on AI and Machine Learning in Education, Virtual and Augmented Reality, Blockchain for Credential Verification, Smart Content Creation, Social and Emotional Learning (SEL), and others to boost market shares in the industry.
Market Overview
The Education Technology and Smart Classroom market has witnessed substantial growth, driven by the pandemic's impact, with a projected valuation. Key segments include Learning Management Systems, online learning, EdTech content, and smart classroom hardware and software. Accelerated trends include remote learning, personalized learning, AI integration, virtual and augmented reality, mobile learning, coding and STEM education, and government investments. Challenges include addressing the digital divide, teacher training, data security, and sustainability. Major players range from dedicated EdTech companies to tech giants like Google and Microsoft. The future outlook is optimistic, with continued innovation in AI, VR/AR, personalized learning, and expanded global access to quality education.
Market Dynamics
Market Trends- Remote proctoring and exam security solutions are gaining traction in the education technology market, as schools and universities seek to ensure the integrity of online exams.
With the widespread shift to online learning, remote proctoring and exam security solutions are gaining prominence in the education technology market. These solutions, utilizing AI-driven monitoring and facial recognition technologies, are essential in preserving the integrity of remote exams, providing secure testing environments for students, and reassuring institutions about the authenticity of test-takers. As digital assessments continue to grow, the demand for robust exam security is expected to be a pivotal element of the EdTech and Smart Classroom market, ensuring the credibility and accuracy of academic evaluations in the digital era.
Market Driver- Data analytics and learning analytics are driving demand for education technology and smart classroom solutions, as schools and universities seek to improve student learning outcomes.
Data analytics and learning analytics are at the forefront of driving demand for education technology and smart classroom solutions. These tools harness the power of data to provide valuable insights into student performance, allowing educators to make informed decisions on curriculum design, personalized instruction, and intervention strategies. By tracking student progress and identifying areas where students may be struggling, these analytics tools enable a more targeted and effective approach to education.
Market Opportunity- Coding and STEM education are driving demand for education technology and smart classroom solutions that can help schools and universities teach these subjects effectively.
Coding and STEM (Science, Technology, Engineering, and Mathematics) education have emerged as significant catalysts for the adoption of education technology and smart classroom solutions. With the increasing emphasis on preparing students for the demands of the digital age and fostering skills in computer science and STEM fields, educational institutions are seeking tools and platforms that can make these subjects engaging and accessible. Coding and STEM-focused EdTech solutions range from interactive programming environments to virtual laboratories, offering hands-on experiences and real-world applications.
Market Share Analysis- Interactive Displays Education Technology and the Smart Classroom Market will register the fastest growth
The Global Education Technology and Smart Classroom Market is analyzed across Interactive Displays, Interactive Projectors, and others. Interactive Displays is poised to register the fastest growth. Interactive displays, including interactive whiteboards, touchscreens, and projectors, are a crucial component of the Education Technology and Smart Classroom market. These tools enable interactive and dynamic learning experiences, promoting real-time collaboration, digital annotation, and hands-on learning. They play a key role in the digital transformation of classrooms, facilitating effective content delivery and catering to diverse learning styles. As a result, their adoption is steadily increasing as educational institutions seek to create engaging and interactive learning environments, driving growth in the EdTech and Smart Classroom market.
Market Share Analysis- Learning Management System (LMS) held a significant market share in 2023
The Global Education Technology and Smart Classroom Market is analyzed across various Organizations including the Learning Management System, Student Information and Administration System, Student Collaboration System, Student Response System, Learning and Gamification, Test Preparation, Classroom Management System, Document Management System, Talent Management System, and others. Of these, the Learning Management System (LMS) held a significant market share in 2023. Learning Management Systems (LMS) are central to the Education Technology and Smart Classroom market, serving as crucial platforms for organizing, delivering, and managing educational content, as well as monitoring student progress and facilitating communication between educators and learners. Their adoption has been driven by the demand for remote and personalized learning solutions, and they play a pivotal role in streamlining education processes and promoting effective communication in various learning environments, contributing significantly to the growth and evolution of the EdTech and Smart Classroom market.
Education Technology and Smart Classroom Market Segmentation
By Hardware
- Interactive Displays
- Interactive Projectors
By Education System
- Learning Management System
- Student Information and Administration System
- Student Collaboration System
- Student Response System
- Learning and Gamification
- Test Preparation
- Classroom Management System
- Document Management System
- Talent Management System
By End-User
By Deployment
By Region
- North America (United States, Canada, Mexico)
- Europe (Germany, France, United Kingdom, Spain, Italy, Others)
- Asia Pacific (China, India, Japan, South Korea, Australia, Others)
- Latin America (Brazil, Argentina, Others)
- Middle East and Africa (Saudi Arabia, UAE, Kuwait, Other Middle East, South Africa, Nigeria, Other Africa)
Education Technology and Smart Classroom Market Companies
- Cisco (United States)
- Apple (United States)
- Blackboard (United States)
- IBM (United States)
- Dell EMC (United States)
- Google (United States)
- Microsoft (United States)
- Oracle (United States)
- SAP (Germany)
- Instructure (United States)
- 2U INC (United States)
- Ellucian (United States)
- Anthology (United States)
- Lenovo (China)
- Cornerstone OnDemand Inc (United States)
- Promethean (United Kingdom)
- D2L (Canada)
- Workday (United States)
- Discovery Education (United States)
- Smart Technologies (Canada)
*List not exhaustive
Education Technology and Smart Classroom Market Outlook 2023
1 Market Overview
1.1 Introduction to the Education Technology and Smart Classroom Market
1.2 Scope of the Study
1.3 Research Objective
1.3.1 Key Market Scope and Segments
1.3.2 Players Covered
1.3.3 Years Considered
2 Executive Summary
2.1 2023 Education Technology and Smart Classroom Industry- Market Statistics
3 Market Dynamics
3.1 Market Drivers
3.2 Market Challenges
3.3 Market Opportunities
3.4 Market Trends
4 Market Factor Analysis
4.1 Porter’s Five Forces
4.2 Market Entropy
4.2.1 Global Education Technology and Smart Classroom Market Companies with Area Served
4.2.2 Products Offerings Global Education Technology and Smart Classroom Market
5 COVID-19 Impact Analysis and Outlook Scenarios
5.1.1 Covid-19 Impact Analysis
5.1.2 post-COVID-19 Scenario- Low Growth Case
5.1.3 post-COVID-19 Scenario- Reference Growth Case
5.1.4 post-COVID-19 Scenario- Low Growth Case
6 Global Education Technology and Smart Classroom Market Trends
6.1 Global Education Technology and Smart Classroom Revenue (USD Million) and CAGR (%) by Type (2018-2030)
6.2 Global Education Technology and Smart Classroom Revenue (USD Million) and CAGR (%) by Applications (2018-2030)
6.3 Global Education Technology and Smart Classroom Revenue (USD Million) and CAGR (%) by regions (2018-2030)
7 Global Education Technology and Smart Classroom Market Revenue (USD Million) by Type, and Applications (2018-2022)
7.1 Global Education Technology and Smart Classroom Revenue (USD Million) by Type (2018-2022)
7.1.1 Global Education Technology and Smart Classroom Revenue (USD Million), Market Share (%) by Type (2018-2022)
7.2 Global Education Technology and Smart Classroom Revenue (USD Million) by Applications (2018-2022)
7.2.1 Global Education Technology and Smart Classroom Revenue (USD Million), Market Share (%) by Applications (2018-2022)
8 Global Education Technology and Smart Classroom Development Regional Status and Outlook
8.1 Global Education Technology and Smart Classroom Revenue (USD Million) By Regions (2018-2022)
8.2 North America Education Technology and Smart Classroom Revenue (USD Million) by Type, and Application (2018-2022)
8.2.1 North America Education Technology and Smart Classroom Revenue (USD Million) by Country (2018-2022)
8.2.2 North America Education Technology and Smart Classroom Revenue (USD Million) by Type (2018-2022)
8.2.3 North America Education Technology and Smart Classroom Revenue (USD Million) by Applications (2018-2022)
8.3 Europe Education Technology and Smart Classroom Revenue (USD Million), by Type, and Applications (USD Million) (2018-2022)
8.3.1 Europe Education Technology and Smart Classroom Revenue (USD Million), by Country (2018-2022)
8.3.2 Europe Education Technology and Smart Classroom Revenue (USD Million) by Type (2018-2022)
8.3.3 Europe Education Technology and Smart Classroom Revenue (USD Million) by Applications (2018-2022)
8.4 Asia Pacific Education Technology and Smart Classroom Revenue (USD Million), and Revenue (USD Million) by Type, and Applications (2018-2022)
8.4.1 Asia Pacific Education Technology and Smart Classroom Revenue (USD Million) by Country (2018-2022)
8.4.2 Asia Pacific Education Technology and Smart Classroom Revenue (USD Million) by Type (2018-2022)
8.4.3 Asia Pacific Education Technology and Smart Classroom Revenue (USD Million) by Applications (2018-2022)
8.5 South America Education Technology and Smart Classroom Revenue (USD Million), by Type, and Applications (2018-2022)
8.5.1 South America Education Technology and Smart Classroom Revenue (USD Million), by Country (2018-2022)
8.5.2 South America Education Technology and Smart Classroom Revenue (USD Million) by Type (2018-2022)
8.5.3 South America Education Technology and Smart Classroom Revenue (USD Million) by Applications (2018-2022)
8.6 Middle East and Africa Education Technology and Smart Classroom Revenue (USD Million), by Type, Technology, Application, Thickness (2018-2022)
8.6.1 Middle East and Africa Education Technology and Smart Classroom Revenue (USD Million) by Country (2018-2022)
8.6.2 Middle East and Africa Education Technology and Smart Classroom Revenue (USD Million) by Type (2018-2022)
8.6.3 Middle East and Africa Education Technology and Smart Classroom Revenue (USD Million) by Applications (2018-2022)
9 Company Profiles
10 Global Education Technology and Smart Classroom Market Revenue (USD Million), by Type, and Applications (2023-2030)
10.1 Global Education Technology and Smart Classroom Revenue (USD Million) and Market Share (%) by Type (2023-2030)
10.1.1 Global Education Technology and Smart Classroom Revenue (USD Million), and Market Share (%) by Type (2023-2030)
10.2 Global Education Technology and Smart Classroom Revenue (USD Million) and Market Share (%) by Applications (2023-2030)
10.2.1 Global Education Technology and Smart Classroom Revenue (USD Million), and Market Share (%) by Applications (2023-2030)
11 Global Education Technology and Smart Classroom Development Regional Status and Outlook Forecast
11.1 Global Education Technology and Smart Classroom Revenue (USD Million) By Regions (2023-2030)
11.2 North America Education Technology and Smart Classroom Revenue (USD Million) by Type, and Applications (2023-2030)
11.2.1 North America Education Technology and Smart Classroom Revenue (USD) Million by Country (2023-2030)
11.2.2 North America Education Technology and Smart Classroom Revenue (USD Million), by Type (2023-2030)
11.2.3 North America Education Technology and Smart Classroom Revenue (USD Million), Market Share (%) by Applications (2023-2030)
11.3 Europe Education Technology and Smart Classroom Revenue (USD Million), by Type, and Applications (2023-2030)
11.3.1 Europe Education Technology and Smart Classroom Revenue (USD Million), by Country (2023-2030)
11.3.2 Europe Education Technology and Smart Classroom Revenue (USD Million), by Type (2023-2030)
11.3.3 Europe Education Technology and Smart Classroom Revenue (USD Million), by Applications (2023-2030)
11.4 Asia Pacific Education Technology and Smart Classroom Revenue (USD Million) by Type, and Applications (2023-2030)
11.4.1 Asia Pacific Education Technology and Smart Classroom Revenue (USD Million), by Country (2023-2030)
11.4.2 Asia Pacific Education Technology and Smart Classroom Revenue (USD Million), by Type (2023-2030)
11.4.3 Asia Pacific Education Technology and Smart Classroom Revenue (USD Million), by Applications (2023-2030)
11.5 South America Education Technology and Smart Classroom Revenue (USD Million), by Type, and Applications (2023-2030)
11.5.1 South America Education Technology and Smart Classroom Revenue (USD Million), by Country (2023-2030)
11.5.2 South America Education Technology and Smart Classroom Revenue (USD Million), by Type (2023-2030)
11.5.3 South America Education Technology and Smart Classroom Revenue (USD Million), by Applications (2023-2030)
11.6 Middle East and Africa Education Technology and Smart Classroom Revenue (USD Million), by Type, and Applications (2023-2030)
11.6.1 Middle East and Africa Education Technology and Smart Classroom Revenue (USD Million), by region (2023-2030)
11.6.2 Middle East and Africa Education Technology and Smart Classroom Revenue (USD Million), by Type (2023-2030)
11.6.3 Middle East and Africa Education Technology and Smart Classroom Revenue (USD Million), by Applications (2023-2030)
12 Methodology and Data Sources
12.1 Methodology/Research Approach
12.1.1 Research Programs/Design
12.1.2 Market Size Estimation
12.1.3 Market Breakdown and Data Triangulation
12.2 Data Sources
12.2.1 Secondary Sources
12.2.2 Primary Sources
12.3 Disclaimer
List of Tables
Table 1 Market Segmentation Analysis
Table 2 Global Education Technology and Smart Classroom Market Companies with Areas Served
Table 3 Products Offerings Global Education Technology and Smart Classroom Market
Table 4 Low Growth Scenario Forecasts
Table 5 Reference Case Growth Scenario
Table 6 High Growth Case Scenario
Table 7 Global Education Technology and Smart Classroom Revenue (USD Million) And CAGR (%) By Type (2018-2030)
Table 8 Global Education Technology and Smart Classroom Revenue (USD Million) And CAGR (%) By Applications (2018-2030)
Table 9 Global Education Technology and Smart Classroom Revenue (USD Million) And CAGR (%) By Regions (2018-2030)
Table 10 Global Education Technology and Smart Classroom Revenue (USD Million) By Type (2018-2022)
Table 11 Global Education Technology and Smart Classroom Revenue Market Share (%) By Type (2018-2022)
Table 12 Global Education Technology and Smart Classroom Revenue (USD Million) By Applications (2018-2022)
Table 13 Global Education Technology and Smart Classroom Revenue Market Share (%) By Applications (2018-2022)
Table 14 Global Education Technology and Smart Classroom Market Revenue (USD Million) By Regions (2018-2022)
Table 15 Global Education Technology and Smart Classroom Market Share (%) By Regions (2018-2022)
Table 16 North America Education Technology and Smart Classroom Revenue (USD Million) By Country (2018-2022)
Table 17 North America Education Technology and Smart Classroom Revenue (USD Million) By Type (2018-2022)
Table 18 North America Education Technology and Smart Classroom Revenue (USD Million) By Applications (2018-2022)
Table 19 Europe Education Technology and Smart Classroom Revenue (USD Million) By Country (2018-2022)
Table 20 Europe Education Technology and Smart Classroom Revenue (USD Million) By Type (2018-2022)
Table 21 Europe Education Technology and Smart Classroom Revenue (USD Million) By Applications (2018-2022)
Table 22 Asia Pacific Education Technology and Smart Classroom Revenue (USD Million) By Country (2018-2022)
Table 23 Asia Pacific Education Technology and Smart Classroom Revenue (USD Million) By Type (2018-2022)
Table 24 Asia Pacific Education Technology and Smart Classroom Revenue (USD Million) By Applications (2018-2022)
Table 25 South America Education Technology and Smart Classroom Revenue (USD Million) By Country (2018-2022)
Table 26 South America Education Technology and Smart Classroom Revenue (USD Million) By Type (2018-2022)
Table 27 South America Education Technology and Smart Classroom Revenue (USD Million) By Applications (2018-2022)
Table 28 Middle East and Africa Education Technology and Smart Classroom Revenue (USD Million) By Region (2018-2022)
Table 29 Middle East and Africa Education Technology and Smart Classroom Revenue (USD Million) By Type (2018-2022)
Table 30 Middle East and Africa Education Technology and Smart Classroom Revenue (USD Million) By Applications (2018-2022)
Table 31 Financial Analysis
Table 32 Global Education Technology and Smart Classroom Revenue (USD Million) By Type (2023-2030)
Table 33 Global Education Technology and Smart Classroom Revenue Market Share (%) By Type (2023-2030)
Table 34 Global Education Technology and Smart Classroom Revenue (USD Million) By Applications (2023-2030)
Table 35 Global Education Technology and Smart Classroom Revenue Market Share (%) By Applications (2023-2030)
Table 36 Global Education Technology and Smart Classroom Market Revenue (USD Million), And Revenue (USD Million) By Regions (2023-2030)
Table 37 North America Education Technology and Smart Classroom Revenue (USD)By Country (2023-2030)
Table 38 North America Education Technology and Smart Classroom Revenue (USD Million) By Type (2023-2030)
Table 39 North America Education Technology and Smart Classroom Revenue (USD Million) By Applications (2023-2030)
Table 40 Europe Education Technology and Smart Classroom Revenue (USD Million) By Country (2023-2030)
Table 41 Europe Education Technology and Smart Classroom Revenue (USD Million) By Type (2023-2030)
Table 42 Europe Education Technology and Smart Classroom Revenue (USD Million) By Applications (2023-2030)
Table 43 Asia Pacific Education Technology and Smart Classroom Revenue (USD Million) By Country (2023-2030)
Table 44 Asia Pacific Education Technology and Smart Classroom Revenue (USD Million) By Type (2023-2030)
Table 45 Asia Pacific Education Technology and Smart Classroom Revenue (USD Million) By Applications (2023-2030)
Table 46 South America Education Technology and Smart Classroom Revenue (USD Million) By Country (2023-2030)
Table 47 South America Education Technology and Smart Classroom Revenue (USD Million) By Type (2023-2030)
Table 48 South America Education Technology and Smart Classroom Revenue (USD Million) By Applications (2023-2030)
Table 49 Middle East and Africa Education Technology and Smart Classroom Revenue (USD Million) By Region (2023-2030)
Table 50 Middle East and Africa Education Technology and Smart Classroom Revenue (USD Million) By Region (2023-2030)
Table 51 Middle East and Africa Education Technology and Smart Classroom Revenue (USD Million) By Type (2023-2030)
Table 52 Middle East and Africa Education Technology and Smart Classroom Revenue (USD Million) By Applications (2023-2030)
Table 53 Research Programs/Design for This Report
Table 54 Key Data Information from Secondary Sources
Table 55 Key Data Information from Primary Sources
List of Figures
Figure 1 Market Scope
Figure 2 Porter’s Five Forces
Figure 3 Global Education Technology and Smart Classroom Revenue (USD Million) By Type (2018-2022)
Figure 4 Global Education Technology and Smart Classroom Revenue Market Share (%) By Type (2022)
Figure 5 Global Education Technology and Smart Classroom Revenue (USD Million) By Applications (2018-2022)
Figure 6 Global Education Technology and Smart Classroom Revenue Market Share (%) By Applications (2022)
Figure 7 Global Education Technology and Smart Classroom Market Revenue (USD Million) By Regions (2018-2022)
Figure 8 Global Education Technology and Smart Classroom Market Share (%) By Regions (2022)
Figure 9 North America Education Technology and Smart Classroom Revenue (USD Million) By Country (2018-2022)
Figure 10 North America Education Technology and Smart Classroom Revenue (USD Million) By Type (2018-2022)
Figure 11 North America Education Technology and Smart Classroom Revenue (USD Million) By Applications (2018-2022)
Figure 12 Europe Education Technology and Smart Classroom Revenue (USD Million) By Country (2018-2022)
Figure 13 Europe Education Technology and Smart Classroom Revenue (USD Million) By Type (2018-2022)
Figure 14 Europe Education Technology and Smart Classroom Revenue (USD Million) By Applications (2018-2022)
Figure 15 Asia Pacific Education Technology and Smart Classroom Revenue (USD Million) By Country (2018-2022)
Figure 16 Asia Pacific Education Technology and Smart Classroom Revenue (USD Million) By Type (2018-2022)
Figure 17 Asia Pacific Education Technology and Smart Classroom Revenue (USD Million) By Applications (2018-2022)
Figure 18 South America Education Technology and Smart Classroom Revenue (USD Million) By Country (2018-2022)
Figure 19 South America Education Technology and Smart Classroom Revenue (USD Million) By Type (2018-2022)
Figure 20 South America Education Technology and Smart Classroom Revenue (USD Million) By Applications (2018-2022)
Figure 21 Middle East and Africa Education Technology and Smart Classroom Revenue (USD Million) By Region (2018-2022)
Figure 22 Middle East and Africa Education Technology and Smart Classroom Revenue (USD Million) By Type (2018-2022)
Figure 23 Middle East and Africa Education Technology and Smart Classroom Revenue (USD Million) By Applications (2018-2022)
Figure 24 Global Education Technology and Smart Classroom Revenue (USD Million) By Type (2023-2030)
Figure 25 Global Education Technology and Smart Classroom Revenue Market Share (%) By Type (2030)
Figure 26 Global Education Technology and Smart Classroom Revenue (USD Million) By Applications (2023-2030)
Figure 27 Global Education Technology and Smart Classroom Revenue Market Share (%) By Applications (2030)
Figure 28 Global Education Technology and Smart Classroom Market Revenue (USD Million) By Regions (2023-2030)
Figure 29 North America Education Technology and Smart Classroom Revenue (USD Million) By Country (2023-2030)
Figure 30 North America Education Technology and Smart Classroom Revenue (USD Million) By Type (2023-2030)
Figure 31 North America Education Technology and Smart Classroom Revenue (USD Million) By Applications (2023-2030)
Figure 32 Europe Education Technology and Smart Classroom Revenue (USD Million) By Country (2023-2030)
Figure 33 Europe Education Technology and Smart Classroom Revenue (USD Million) By Type (2023-2030)
Figure 34 Europe Education Technology and Smart Classroom Revenue (USD Million) By Applications (2023-2030)
Figure 35 Asia Pacific Education Technology and Smart Classroom Revenue (USD Million) By Country (2023-2030)
Figure 36 Asia Pacific Education Technology and Smart Classroom Revenue (USD Million) By Type (2023-2030)
Figure 37 Asia Pacific Education Technology and Smart Classroom Revenue (USD Million) By Applications (2023-2030)
Figure 38 South America Education Technology and Smart Classroom Revenue (USD Million) By Country (2023-2030)
Figure 39 South America Education Technology and Smart Classroom Revenue (USD Million) By Type (2023-2030)
Figure 40 South America Education Technology and Smart Classroom Revenue (USD Million) By Applications (2023-2030)
Figure 41 Middle East and Africa Education Technology and Smart Classroom Revenue (USD Million) By Region (2023-2030)
Figure 42 Middle East and Africa Education Technology and Smart Classroom Revenue (USD Million) By Region (2023-2030)
Figure 43 Middle East and Africa Education Technology and Smart Classroom Revenue (USD Million) By Type (2023-2030)
Figure 44 Middle East and Africa Education Technology and Smart Classroom Revenue (USD Million) By Applications (2023-2030)
Figure 45 Bottom-Up and Top-Down Approaches for This Report
Figure 46 Data Triangulation
