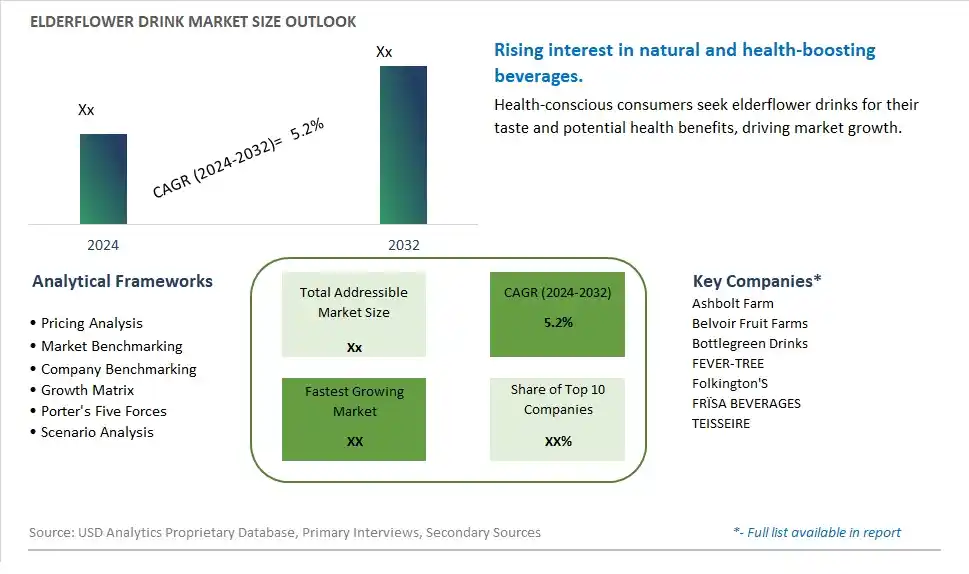
Global Elderflower Drink Market Size is valued at $XX Million in 2024 and is forecast to register a growth rate (CAGR) of 5.2% to reach $XX Million by 2032.
The global Elderflower Drink Market Comprehensive Study analyzes and forecasts the market size across 6 regions and 24 countries for diverse segments -By Type (Tea, Soda, Soft Drinks), By Application (Food And Beverages, HoReCa, Household), By Distribution Channel (Convenience Stores, Discount Stores, Hypermarkets/Supermarkets, Online), By Flavor (Berries, Pear, Others), By Properties (Anti-Inflammatory, Antiseptic, Antibacterial, Antiviral)
An Introduction to Elderflower Drink Market
The Elderflower Drink market in 2024 is witnessing significant growth, driven by the increasing popularity of floral and botanical beverages. Elderflower drinks, known for their delicate flavor and refreshing taste, are gaining traction among health-conscious consumers and gourmet beverage enthusiasts. The market benefits from the growing trend of natural and organic drinks, advancements in beverage formulation and packaging, and the expansion of the specialty drinks market. Additionally, the rising awareness of the health benefits of elderflower, such as its antioxidant properties, is contributing to market growth.
Elderflower Drink Competitive Landscape
The market report analyses the leading companies in the industry including Ashbolt Farm, Belvoir Fruit Farms, Bottlegreen Drinks, FEVER-TREE, Folkington'S, FRÏSA BEVERAGES, TEISSEIRE, and Others.
Elderflower Drink Market Dynamics
Elderflower Drink Market Trend: Increasing Demand for Natural and Floral Flavors
The elderflower drink market is experiencing a significant trend towards natural and floral flavors. Consumers are increasingly seeking beverages that offer unique and refreshing taste profiles, with a growing preference for botanical and herbal ingredients. Elderflower, known for its delicate and aromatic flavor, has gained popularity as a key ingredient in beverages, including sodas, sparkling waters, cocktails, and teas. This trend is driven by the broader shift towards healthier and more natural food and beverage choices, as consumers prioritize products free from artificial flavors, colors, and preservatives.
Elderflower Drink Market Driver: Growing Interest in Health and Wellness Beverages
A major driver for the elderflower drink market is the growing interest in health and wellness beverages. Elderflower is often associated with various health benefits, including antioxidant properties, immune system support, and potential anti-inflammatory effects. As consumers become more health-conscious and seek functional beverages that offer both flavor and nutritional value, elderflower drinks emerge as a desirable option. The rise of mindful drinking, where consumers prioritize beverages that promote well-being and hydration, further fuels the demand for elderflower-infused drinks.
Elderflower Drink Market Opportunity: Diversification and Expansion into Non-Alcoholic and Mixology Markets
The elderflower drink market presents significant opportunities for diversification and expansion into non-alcoholic and mixology markets. Companies can innovate by introducing a range of elderflower-based beverages, including non-alcoholic spritzers, flavored waters, herbal teas, and energy drinks. Leveraging the trend of mocktails and low-alcohol alternatives, elderflower-based cocktails and mixed drinks can also attract a younger demographic and appeal to those seeking lighter beverage options. Collaborations with mixologists, bartenders, and beverage influencers to create signature elderflower recipes and promote mixology events can further enhance market presence and consumer engagement.
Elderflower Drink Market Share Analysis: HoReCa Application is the fastest growing segment over the forecast period to 2032
The HoReCa (Hotels, Restaurants, and Catering) segment is anticipated to experience the fastest growth in the Elderflower Drink Market by 2032. This growth is driven by several key factors. Firstly, the increasing popularity of elderflower-based beverages among consumers looking for unique and refreshing drink options is driving demand in the hospitality and catering sectors. Elderflower drinks offer a distinct floral flavor profile that appeals to a wide range of taste preferences and can be used in various beverage recipes, cocktails, and mocktails, enhancing the beverage offerings of restaurants, hotels, and catering services. Further, the rising trend of health-conscious dining and the perception of elderflower as a natural and beneficial ingredient contribute to its inclusion in the beverage menus of establishments focusing on wellness and premium offerings. Additionally, the versatility of elderflower drinks, which can be served both as standalone beverages and as mixers in cocktails, makes them a versatile choice for HoReCa establishments aiming to provide diverse and appealing beverage options to their customers. Overall, the HoReCa segment presents significant growth opportunities for the Elderflower Drink Market, driven by consumer preferences for unique flavors, health-conscious choices, and innovative beverage experiences in hospitality and catering settings.
Elderflower Drink Market Share Analysis: Berries Flavor is the fastest growing segment over the forecast period to 2032
The Berries flavor segment is poised to experience rapid growth in the Elderflower Drink Market by 2032. This growth can be attributed to several key factors. Firstly, the growing consumer interest in unique and exotic flavor combinations drives demand for elderflower beverages infused with the refreshing and vibrant taste of berries. Berries are widely recognized for their antioxidant properties and health benefits, making them a popular choice among health-conscious consumers seeking natural and flavorful beverage options. Additionally, the versatility of berries allows for various flavor profiles, such as strawberry, blueberry, raspberry, and blackberry, catering to diverse taste preferences and enhancing the appeal of elderflower drinks. Furthermore, the increasing availability of elderflower drinks in convenient distribution channels like hypermarkets/supermarkets, convenience stores, and online platforms contributes to the accessibility and visibility of elderflower beverages in berries flavor, driving consumer adoption and market growth. Overall, the Berries flavor segment presents promising opportunities for the Elderflower Drink Market, fueled by consumer demand for innovative flavors, wellness benefits, and convenient access across distribution channels.
Elderflower Drink Market Segmentation
By Type
Tea
Soda
Soft Drinks
By Application
Food And Beverages
HoReCa
Household
By Distribution Channel
Convenience Stores
Discount Stores
Hypermarkets/Supermarkets
Online
By Flavor
Berries
Pear
Others
By Properties
Anti-Inflammatory
Antiseptic
Antibacterial
Antiviral
Countries Analyzed
North America (US, Canada, Mexico)
Europe (Germany, UK, France, Spain, Italy, Russia, Rest of Europe)
Asia Pacific (China, India, Japan, South Korea, Australia, South East Asia, Rest of Asia)
South America (Brazil, Argentina, Rest of South America)
Middle East and Africa (Saudi Arabia, UAE, Rest of Middle East, South Africa, Egypt, Rest of Africa)
Elderflower Drink Companies Profiled in the Study
Ashbolt Farm
Belvoir Fruit Farms
Bottlegreen Drinks
FEVER-TREE
Folkington'S
FRÏSA BEVERAGES
TEISSEIRE
*- List Not Exhaustive
Chapter 1. TABLE OF CONTENTS
Chapter 2. Introduction to Elderflower Drink Market
2.1. Market Overview
2.2. Key Statistics and Report Highlights
2.3. Scope of the Comprehensive Study
2.3.1. Market Definition
2.3.2 Countries and Regions Covered
2.3.3 Research Objective
2.3.4 Units, Currency, and Conversions
2.3.5 Industry Value Chain
2.4. Key Market Segments
2.5. Key Companies
2.6. Study Period
Chapter 3. Strategic Analysis Review
3.1. Elderflower Drink Pricing Analysis and Forecast
3.2. Porter’s Five Forces
3.3. Market Ecosystem
3.4. SWOT Analysis
3.5. Regulatory Scenario
3.3. Effects of Inflation, Russia-Ukraine War, moderating economic growth, and other macroeconomic factors
Chapter 4. Competitive Landscape
4.1. Market Share Analysis
4.1.1. Global Elderflower Drink Market Share by Company, 2023
4.1.2. Product Offerings of Leading Elderflower Drink Companies
4.2. Market Entropy
4.2.1. New Product Launches in the Industry
4.2.2. Mergers, Acquisitions, Joint ventures, and Partnerships
4.3. Key Strategies and Best Practices
Chapter 5. Global Market Projections: Best, Reference, and Low Case Scenarios
5.1. Growth Analysis- Case Scenario Definitions
5.2. Low Growth Case Scenario Forecasts
5.3. Reference Growth Case Scenario Forecasts
5.4. High Growth Case Scenario Forecasts
Chapter 6. Market Dynamics
6.1. Elderflower Drink Market Drivers
6.2. Elderflower Drink Market Challenges
6.6. Elderflower Drink Market Opportunities
6.4. Elderflower Drink Market Trends
Chapter 7. Global Elderflower Drink Market Outlook Trends
7.1. Global Elderflower Drink Revenue (USD Million) and CAGR (%) by Type (2021-2032)
7.2. Global Elderflower Drink Revenue (USD Million) and CAGR (%) by Application (2021-2032)
7.3. Global Elderflower Drink Revenue (USD Million) and CAGR (%) by Product (2021-2032)
By Type
Tea
Soda
Soft Drinks
By Application
Food And Beverages
HoReCa
Household
By Distribution Channel
Convenience Stores
Discount Stores
Hypermarkets/Supermarkets
Online
By Flavor
Berries
Pear
Others
By Properties
Anti-Inflammatory
Antiseptic
Antibacterial
Antiviral
Chapter 8. Global Elderflower Drink Regional Analysis and Outlook
8.1. Global Elderflower Drink Revenue (USD Million) By Regions (2021- 2032)
8.2. North America Elderflower Drink Revenue (USD Million) by Country (2021-2032)
8.2.1. United States Elderflower Drink Regional Analysis and Outlook
8.2.2. Canada Elderflower Drink Regional Analysis and Outlook
8.2.3. Mexico Elderflower Drink Regional Analysis and Outlook
8.3. Europe Elderflower Drink Revenue (USD Million), by Country (2021-2032)
8.3.1. Germany Elderflower Drink Regional Analysis and Outlook
8.3.2. France Elderflower Drink Regional Analysis and Outlook
8.3.3. United Kingdom Elderflower Drink Regional Analysis and Outlook
8.3.4. Spain Elderflower Drink Regional Analysis and Outlook
8.3.5. Italy Elderflower Drink Regional Analysis and Outlook
8.3.6. Russia Elderflower Drink Regional Analysis and Outlook
8.3.7. Rest of Europe Elderflower Drink Regional Analysis and Outlook
8.4. Asia Pacific Elderflower Drink Revenue (USD Million) by Country (2021-2032)
8.4.1. China Elderflower Drink Regional Analysis and Outlook
8.4.2. Japan Elderflower Drink Regional Analysis and Outlook
8.4.3. India Elderflower Drink Regional Analysis and Outlook
8.4.4. South Korea Elderflower Drink Regional Analysis and Outlook
8.4.5. Australia Elderflower Drink Regional Analysis and Outlook
8.4.6. South East Asia Elderflower Drink Regional Analysis and Outlook
8.4.7. Rest of Asia Pacific Elderflower Drink Regional Analysis and Outlook
8.5. South America Elderflower Drink Revenue (USD Million), by Country (2021-2032)
8.5.1. Brazil Elderflower Drink Regional Analysis and Outlook
8.5.2. Argentina Elderflower Drink Regional Analysis and Outlook
8.5.3. Rest of South America Elderflower Drink Regional Analysis and Outlook
8.6. Middle East and Africa Elderflower Drink Revenue (USD Million) by Country (2021-2032)
8.6.1. Middle East Elderflower Drink Regional Analysis and Outlook
8.6.2. Africa Elderflower Drink Regional Analysis and Outlook
Chapter 9. North America Elderflower Drink Analysis and Outlook
9.1. North America Elderflower Drink Revenue (USD Million) by Segments (2021-2032)
9.1.1. North America Elderflower Drink Revenue (USD Million) by Type (2021-2032)
9.1.2. North America Elderflower Drink Revenue (USD Million) by Application (2021-2032)
9.1.3. North America Elderflower Drink Revenue (USD Million) by Product (2021-2032)
By Type
Tea
Soda
Soft Drinks
By Application
Food And Beverages
HoReCa
Household
By Distribution Channel
Convenience Stores
Discount Stores
Hypermarkets/Supermarkets
Online
By Flavor
Berries
Pear
Others
By Properties
Anti-Inflammatory
Antiseptic
Antibacterial
Antiviral
Chapter 10. Europe Elderflower Drink Analysis and Outlook
10.1. Europe Elderflower Drink Revenue (USD Million), by Segments (USD Million) (2021-2032)
10.1.1. Europe Elderflower Drink Revenue (USD Million) by Type (2021-2032)
10.1.2. Europe Elderflower Drink Revenue (USD Million) by Application (2021-2032)
10.1.3. Europe Elderflower Drink Revenue (USD Million) by Product (2021-2032)
By Type
Tea
Soda
Soft Drinks
By Application
Food And Beverages
HoReCa
Household
By Distribution Channel
Convenience Stores
Discount Stores
Hypermarkets/Supermarkets
Online
By Flavor
Berries
Pear
Others
By Properties
Anti-Inflammatory
Antiseptic
Antibacterial
Antiviral
Chapter 11. Asia Pacific Elderflower Drink Analysis and Outlook
11.1. Asia Pacific Elderflower Drink Revenue (USD Million), and Revenue (USD Million) by Segments (2021-2032)
11.1.1. Asia Pacific Elderflower Drink Revenue (USD Million) by Type (2021-2032)
11.1.2. Asia Pacific Elderflower Drink Revenue (USD Million) by Application (2021-2032)
11.1.3. Asia Pacific Elderflower Drink Revenue (USD Million) by Product (2021-2032)
By Type
Tea
Soda
Soft Drinks
By Application
Food And Beverages
HoReCa
Household
By Distribution Channel
Convenience Stores
Discount Stores
Hypermarkets/Supermarkets
Online
By Flavor
Berries
Pear
Others
By Properties
Anti-Inflammatory
Antiseptic
Antibacterial
Antiviral
Chapter 12. South America Elderflower Drink Analysis and Outlook
12.1. South America Elderflower Drink Revenue (USD Million), by Segments (2021-2032)
12.1.1. South America Elderflower Drink Revenue (USD Million) by Type (2021-2032)
12.1.2. South America Elderflower Drink Revenue (USD Million) by Application (2021-2032)
12.1.3. South America Elderflower Drink Revenue (USD Million) by Product (2021-2032)
By Type
Tea
Soda
Soft Drinks
By Application
Food And Beverages
HoReCa
Household
By Distribution Channel
Convenience Stores
Discount Stores
Hypermarkets/Supermarkets
Online
By Flavor
Berries
Pear
Others
By Properties
Anti-Inflammatory
Antiseptic
Antibacterial
Antiviral
Chapter 13. Middle East and Africa Elderflower Drink Analysis and Outlook
13.1. Middle East and Africa Elderflower Drink Revenue (USD Million), by Segments (2021-2032)
13.1.1. Middle East and Africa Elderflower Drink Revenue (USD Million) by Type (2021-2032)
13.1.2. Middle East and Africa Elderflower Drink Revenue (USD Million) by Application (2021-2032)
13.1.3. Middle East and Africa Elderflower Drink Revenue (USD Million) by Product (2021-2032)
By Type
Tea
Soda
Soft Drinks
By Application
Food And Beverages
HoReCa
Household
By Distribution Channel
Convenience Stores
Discount Stores
Hypermarkets/Supermarkets
Online
By Flavor
Berries
Pear
Others
By Properties
Anti-Inflammatory
Antiseptic
Antibacterial
Antiviral
Chapter 14. Elderflower Drink Company Profiles
14.1 Business Overview
14.2 Product Profiles
14.3 SWOT Profiles
14.5 Recent Developments
14.6 Financial Profile
List of Companies
Ashbolt Farm
Belvoir Fruit Farms
Bottlegreen Drinks
FEVER-TREE
Folkington'S
FRÏSA BEVERAGES
TEISSEIRE
15. Methodology and Data Sources
15.1 Customization Offerings
15.2 Subscription Services
15.3 Related Reports
15.4 Publisher Expertise
LIST OF TABLES
Table 1 Market Segmentation Analysis
Table 2 Global Elderflower Drink Market Share of Leading Companies, 2023
Table 3 Product Offerings of Leading Companies
Table 4 Low Growth Scenario Forecasts
Table 5 Reference Case Growth Scenario
Table 6 High Growth Case Scenario
Table 7 Global Elderflower Drink Revenue (USD Million) And CAGR (%) By Type (2021-2032)
Table 8 Global Elderflower Drink Revenue (USD Million) And CAGR (%) By Application (2021-2032)
Table 9 Global Elderflower Drink Revenue (USD Million) And CAGR (%) By Product (2021-2032)
Table 10 Global Elderflower Drink Market Revenue (USD Million) By Regions (2021-2032)
Table 11 Global Elderflower Drink Market Share (%) By Regions (2021-2032)
Table 12 North America Elderflower Drink Revenue (USD Million) By Country (2021-2032)
Table 13 Europe Elderflower Drink Revenue (USD Million) By Country (2021-2032)
Table 14 Asia Pacific Elderflower Drink Revenue (USD Million) By Country (2021-2032)
Table 15 South America Elderflower Drink Revenue (USD Million) By Country (2021-2032)
Table 16 Middle East and Africa Elderflower Drink Revenue (USD Million) By Region (2021-2032)
Table 17 North America Elderflower Drink Revenue (USD Million) By Type (2021-2032)
Table 18 North America Elderflower Drink Revenue (USD Million) By Application (2021-2032)
Table 19 North America Elderflower Drink Revenue (USD Million) By Product (2021-2032)
Table 20 Europe Elderflower Drink Revenue (USD Million) By Type (2021-2032)
Table 21 Europe Elderflower Drink Revenue (USD Million) By Application (2021-2032)
Table 22 Europe Elderflower Drink Revenue (USD Million) By Product (2021-2032)
Table 23 Asia Pacific Elderflower Drink Revenue (USD Million) By Type (2021-2032)
Table 24 Asia Pacific Elderflower Drink Revenue (USD Million) By Application (2021-2032)
Table 25 Asia Pacific Elderflower Drink Revenue (USD Million) By Product (2021-2032)
Table 26 South America Elderflower Drink Revenue (USD Million) By Type (2021-2032)
Table 27 South America Elderflower Drink Revenue (USD Million) By Application (2021-2032)
Table 28 South America Elderflower Drink Revenue (USD Million) By Product (2021-2032)
Table 29 Middle East and Africa Elderflower Drink Revenue (USD Million) By Type (2021-2032)
Table 30 Middle East and Africa Elderflower Drink Revenue (USD Million) By Application (2021-2032)
Table 31 Middle East and Africa Elderflower Drink Revenue (USD Million) By Product (2021-2032)
LIST OF FIGURES
Figure 1. Market Scope
Figure 2. Pricing Forecasts Per Unit, 2023- 2032
Figure 3. Porter’s Five Forces
Figure 4. Global Elderflower Drink Market Revenue (USD Million) By Regions (2021-2032)
Figure 5. Global Elderflower Drink Market Share (%) By Regions (2023)
Figure 6. North America Elderflower Drink Revenue (USD Million) By Country (2021-2032)
Figure 7. United States Elderflower Drink Revenue (USD Million) By Country (2021-2032)
Figure 8. Canada Elderflower Drink Revenue (USD Million) By Country (2021-2032)
Figure 9. Mexico Elderflower Drink Revenue (USD Million) By Country (2021-2032)
Figure 10. Europe Elderflower Drink Revenue (USD Million) By Country (2021-2032)
Figure 11. Germany Elderflower Drink Revenue (USD Million) By Country (2021-2032)
Figure 12. France Elderflower Drink Revenue (USD Million) By Country (2021-2032)
Figure 13. United Kingdom Elderflower Drink Revenue (USD Million) By Country (2021-2032)
Figure 14. Spain Elderflower Drink Revenue (USD Million) By Country (2021-2032)
Figure 15. Italy Elderflower Drink Revenue (USD Million) By Country (2021-2032)
Figure 16. Russia Elderflower Drink Revenue (USD Million) By Country (2021-2032)
Figure 17. Rest of Europe Elderflower Drink Revenue (USD Million) By Country (2021-2032)
Figure 11. Asia Pacific Elderflower Drink Revenue (USD Million) By Country (2021-2032)
Figure 12. China Elderflower Drink Revenue (USD Million) By Country (2021-2032)
Figure 13. Japan Elderflower Drink Revenue (USD Million) By Country (2021-2032)
Figure 14. India Elderflower Drink Revenue (USD Million) By Country (2021-2032)
Figure 15. South Korea Elderflower Drink Revenue (USD Million) By Country (2021-2032)
Figure 16. Australia Elderflower Drink Revenue (USD Million) By Country (2021-2032)
Figure 17. South East Asia Elderflower Drink Revenue (USD Million) By Country (2021-2032)
Figure 18. South America Elderflower Drink Revenue (USD Million) By Country (2021-2032)
Figure 19. Brazil Elderflower Drink Revenue (USD Million) By Country (2021-2032)
Figure 20. Argentina Elderflower Drink Revenue (USD Million) By Country (2021-2032)
Figure 21. Rest of Asia Pacific Elderflower Drink Revenue (USD Million) By Country (2021-2032)
Figure 22. Middle East and Africa Elderflower Drink Revenue (USD Million) By Region (2021-2032)
Figure 23. Saudi Arabia Elderflower Drink Revenue (USD Million) By Region (2021-2032)
Figure 24. The UAE Elderflower Drink Revenue (USD Million) By Region (2021-2032)
Figure 25. Rest of Middle East Elderflower Drink Revenue (USD Million) By Region (2021-2032)
Figure 26. South Africa Elderflower Drink Revenue (USD Million) By Region (2021-2032)
Figure 27. Africa Elderflower Drink Revenue (USD Million) By Region (2021-2032)
Figure 28. North America Elderflower Drink Revenue (USD Million) By Type (2021-2032)
Figure 29. North America Elderflower Drink Revenue (USD Million) By Application (2021-2032)
Figure 30. North America Elderflower Drink Revenue (USD Million) By Product (2021-2032)
Figure 31. Europe Elderflower Drink Revenue (USD Million) By Type (2021-2032)
Figure 32. Europe Elderflower Drink Revenue (USD Million) By Application (2021-2032)
Figure 33. Europe Elderflower Drink Revenue (USD Million) By Product (2021-2032)
Figure 34. Asia Pacific Elderflower Drink Revenue (USD Million) By Type (2021-2032)
Figure 35. Asia Pacific Elderflower Drink Revenue (USD Million) By Application (2021-2032)
Figure 36. Asia Pacific Elderflower Drink Revenue (USD Million) By Product (2021-2032)
Figure 37. South America Elderflower Drink Revenue (USD Million) By Type (2021-2032)
Figure 38. South America Elderflower Drink Revenue (USD Million) By Application (2021-2032)
Figure 39. South America Elderflower Drink Revenue (USD Million) By Product (2021-2032)
Figure 40. Middle East and Africa Elderflower Drink Revenue (USD Million) By Type (2021-2032)
Figure 41. Middle East and Africa Elderflower Drink Revenue (USD Million) By Application (2021-2032)
Figure 42. Middle East and Africa Elderflower Drink Revenue (USD Million) By Product (2021-2032)
By Type
Tea
Soda
Soft Drinks
By Application
Food And Beverages
HoReCa
Household
By Distribution Channel
Convenience Stores
Discount Stores
Hypermarkets/Supermarkets
Online
By Flavor
Berries
Pear
Others
By Properties
Anti-Inflammatory
Antiseptic
Antibacterial
Antiviral
Countries Analyzed
North America (US, Canada, Mexico)
Europe (Germany, UK, France, Spain, Italy, Russia, Rest of Europe)
Asia Pacific (China, India, Japan, South Korea, Australia, South East Asia, Rest of Asia)
South America (Brazil, Argentina, Rest of South America)
Middle East and Africa (Saudi Arabia, UAE, Rest of Middle East, South Africa, Egypt, Rest of Africa)
