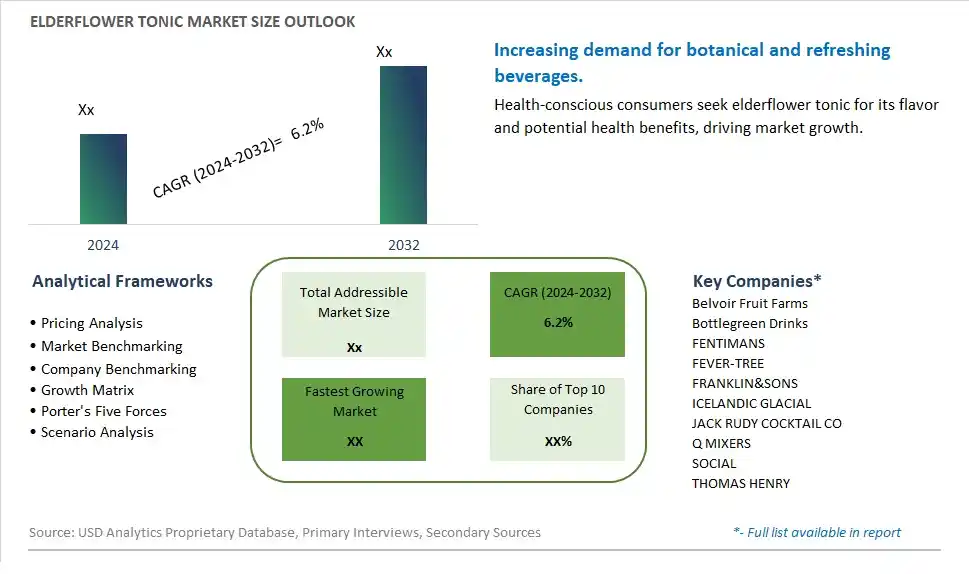
Global Elderflower Tonic Market Size is valued at $XX Million in 2024 and is forecast to register a growth rate (CAGR) of 6.2% to reach $XX Million by 2032.
The global Elderflower Tonic Market Comprehensive Study analyzes and forecasts the market size across 6 regions and 24 countries for diverse segments -By Type (Dual Flavored, Singular Flavored), By Application (Domestic Place, Catering, Entertainment Venue, Others)
An Introduction to Elderflower Tonic Market
The Elderflower Tonic market in 2024 is experiencing robust growth, driven by the increasing demand for premium and botanical mixers. Elderflower tonic, valued for its unique flavor and versatility in cocktails and beverages, is gaining popularity among mixologists and consumers. The market benefits from the growing trend of craft cocktails, the expansion of the premium mixer market, and advancements in beverage formulation and packaging. Additionally, the rising popularity of elderflower-based drinks and the increasing focus on natural and high-quality ingredients are contributing to market expansion.
Elderflower Tonic Competitive Landscape
The market report analyses the leading companies in the industry including Belvoir Fruit Farms, Bottlegreen Drinks, FENTIMANS, FEVER-TREE, FRANKLIN&SONS, ICELANDIC GLACIAL, JACK RUDY COCKTAIL CO, Q MIXERS, SOCIAL, THOMAS HENRY, and Others.
Elderflower Tonic Market Dynamics
Elderflower Tonic Market Trend: Surge in Demand for Premium and Artisanal Beverages
The elderflower tonic market is witnessing a significant trend towards premium and artisanal beverages. Consumers are increasingly seeking high-quality and unique drink experiences, with a growing preference for handcrafted and small-batch products. Elderflower tonic, known for its sophisticated floral notes and versatility in cocktails and mocktails, aligns well with this trend. The market is driven by consumers' desire for elevated drinking experiences, where they can explore new flavors and enjoy beverages with premium ingredients and craftsmanship.
Elderflower Tonic Market Driver: Shift Towards Health-Conscious Mixology and Cocktail Culture
A major driver for the elderflower tonic market is the shift towards health-conscious mixology and cocktail culture. As consumers become more mindful of their alcohol consumption and prioritize wellness, there is a growing demand for lighter and lower-sugar alternatives in cocktails and mixed drinks. Elderflower tonic, often used as a mixer with spirits or as a standalone refreshing beverage, offers a naturally floral and less sweet option compared to traditional tonic water or soda. This driver is supported by the trend of mocktails and non-alcoholic cocktails, where elderflower tonic can enhance flavor profiles without added alcohol.
Elderflower Tonic Market Opportunity: Collaboration with Mixologists and Bartenders for Signature Creations
The elderflower tonic market presents significant opportunities for collaboration with mixologists and bartenders to create signature creations and promote innovative cocktails. Companies can partner with renowned mixologists to develop unique recipes and serve as brand ambassadors, showcasing the versatility and flavor potential of elderflower tonic in mixology. Collaborative efforts can also include hosting mixology events, workshops, and cocktail competitions to engage consumers and educate them about the usage of elderflower tonic in creative beverage creations. Expanding distribution channels to upscale bars, restaurants, and cocktail lounges can further enhance visibility and market penetration.
Elderflower Tonic Market Share Analysis: Entertainment Venue is the fastest growing segment over the forecast period to 2032
The fastest-growing segment in the Elderflower Tonic Market is the Entertainment Venue category. This segment encompasses various establishments such as bars, lounges, clubs, and entertainment venues where beverages play a significant role in enhancing the overall customer experience. The rapid growth of elderflower tonics in entertainment venues can be attributed to several factors. Firstly, elderflower tonics are increasingly popular among consumers seeking unique and sophisticated beverage options, especially in social settings and nightlife environments. The delicate floral and refreshing taste profile of elderflower complements a wide range of spirits and mixers, making it a favorite choice for crafting innovative cocktails and mocktails in entertainment venues. Additionally, the rising trend of mixology and bartending creativity has spurred demand for premium and artisanal ingredients like elderflower tonic, driving growth in this segment. Furthermore, entertainment venues often prioritize offering diverse and trendy beverage selections to attract and retain customers, with elderflower tonics emerging as a key ingredient in signature drinks and themed cocktails. The growing preference for natural and botanical-infused beverages among health-conscious consumers further contributes to the popularity and growth of elderflower tonics in entertainment settings. Overall, the Entertainment Venue segment of the Elderflower Tonic Market is experiencing rapid expansion fueled by consumer demand for unique, flavorful, and experiential beverages in social and entertainment contexts.
Elderflower Tonic Market Segmentation
By Type
Dual Flavored
Singular Flavored
By Application
Domestic Place
Catering
Entertainment Venue
Others
Countries Analyzed
North America (US, Canada, Mexico)
Europe (Germany, UK, France, Spain, Italy, Russia, Rest of Europe)
Asia Pacific (China, India, Japan, South Korea, Australia, South East Asia, Rest of Asia)
South America (Brazil, Argentina, Rest of South America)
Middle East and Africa (Saudi Arabia, UAE, Rest of Middle East, South Africa, Egypt, Rest of Africa)
Elderflower Tonic Companies Profiled in the Study
Belvoir Fruit Farms
Bottlegreen Drinks
FENTIMANS
FEVER-TREE
FRANKLIN&SONS
ICELANDIC GLACIAL
JACK RUDY COCKTAIL CO
Q MIXERS
SOCIAL
THOMAS HENRY
*- List Not Exhaustive
Chapter 1. TABLE OF CONTENTS
Chapter 2. Introduction to Elderflower Tonic Market
2.1. Market Overview
2.2. Key Statistics and Report Highlights
2.3. Scope of the Comprehensive Study
2.3.1. Market Definition
2.3.2 Countries and Regions Covered
2.3.3 Research Objective
2.3.4 Units, Currency, and Conversions
2.3.5 Industry Value Chain
2.4. Key Market Segments
2.5. Key Companies
2.6. Study Period
Chapter 3. Strategic Analysis Review
3.1. Elderflower Tonic Pricing Analysis and Forecast
3.2. Porter’s Five Forces
3.3. Market Ecosystem
3.4. SWOT Analysis
3.5. Regulatory Scenario
3.3. Effects of Inflation, Russia-Ukraine War, moderating economic growth, and other macroeconomic factors
Chapter 4. Competitive Landscape
4.1. Market Share Analysis
4.1.1. Global Elderflower Tonic Market Share by Company, 2023
4.1.2. Product Offerings of Leading Elderflower Tonic Companies
4.2. Market Entropy
4.2.1. New Product Launches in the Industry
4.2.2. Mergers, Acquisitions, Joint ventures, and Partnerships
4.3. Key Strategies and Best Practices
Chapter 5. Global Market Projections: Best, Reference, and Low Case Scenarios
5.1. Growth Analysis- Case Scenario Definitions
5.2. Low Growth Case Scenario Forecasts
5.3. Reference Growth Case Scenario Forecasts
5.4. High Growth Case Scenario Forecasts
Chapter 6. Market Dynamics
6.1. Elderflower Tonic Market Drivers
6.2. Elderflower Tonic Market Challenges
6.6. Elderflower Tonic Market Opportunities
6.4. Elderflower Tonic Market Trends
Chapter 7. Global Elderflower Tonic Market Outlook Trends
7.1. Global Elderflower Tonic Revenue (USD Million) and CAGR (%) by Type (2021-2032)
7.2. Global Elderflower Tonic Revenue (USD Million) and CAGR (%) by Application (2021-2032)
7.3. Global Elderflower Tonic Revenue (USD Million) and CAGR (%) by Product (2021-2032)
By Type
Dual Flavored
Singular Flavored
By Application
Domestic Place
Catering
Entertainment Venue
Others
Chapter 8. Global Elderflower Tonic Regional Analysis and Outlook
8.1. Global Elderflower Tonic Revenue (USD Million) By Regions (2021- 2032)
8.2. North America Elderflower Tonic Revenue (USD Million) by Country (2021-2032)
8.2.1. United States Elderflower Tonic Regional Analysis and Outlook
8.2.2. Canada Elderflower Tonic Regional Analysis and Outlook
8.2.3. Mexico Elderflower Tonic Regional Analysis and Outlook
8.3. Europe Elderflower Tonic Revenue (USD Million), by Country (2021-2032)
8.3.1. Germany Elderflower Tonic Regional Analysis and Outlook
8.3.2. France Elderflower Tonic Regional Analysis and Outlook
8.3.3. United Kingdom Elderflower Tonic Regional Analysis and Outlook
8.3.4. Spain Elderflower Tonic Regional Analysis and Outlook
8.3.5. Italy Elderflower Tonic Regional Analysis and Outlook
8.3.6. Russia Elderflower Tonic Regional Analysis and Outlook
8.3.7. Rest of Europe Elderflower Tonic Regional Analysis and Outlook
8.4. Asia Pacific Elderflower Tonic Revenue (USD Million) by Country (2021-2032)
8.4.1. China Elderflower Tonic Regional Analysis and Outlook
8.4.2. Japan Elderflower Tonic Regional Analysis and Outlook
8.4.3. India Elderflower Tonic Regional Analysis and Outlook
8.4.4. South Korea Elderflower Tonic Regional Analysis and Outlook
8.4.5. Australia Elderflower Tonic Regional Analysis and Outlook
8.4.6. South East Asia Elderflower Tonic Regional Analysis and Outlook
8.4.7. Rest of Asia Pacific Elderflower Tonic Regional Analysis and Outlook
8.5. South America Elderflower Tonic Revenue (USD Million), by Country (2021-2032)
8.5.1. Brazil Elderflower Tonic Regional Analysis and Outlook
8.5.2. Argentina Elderflower Tonic Regional Analysis and Outlook
8.5.3. Rest of South America Elderflower Tonic Regional Analysis and Outlook
8.6. Middle East and Africa Elderflower Tonic Revenue (USD Million) by Country (2021-2032)
8.6.1. Middle East Elderflower Tonic Regional Analysis and Outlook
8.6.2. Africa Elderflower Tonic Regional Analysis and Outlook
Chapter 9. North America Elderflower Tonic Analysis and Outlook
9.1. North America Elderflower Tonic Revenue (USD Million) by Segments (2021-2032)
9.1.1. North America Elderflower Tonic Revenue (USD Million) by Type (2021-2032)
9.1.2. North America Elderflower Tonic Revenue (USD Million) by Application (2021-2032)
9.1.3. North America Elderflower Tonic Revenue (USD Million) by Product (2021-2032)
By Type
Dual Flavored
Singular Flavored
By Application
Domestic Place
Catering
Entertainment Venue
Others
Chapter 10. Europe Elderflower Tonic Analysis and Outlook
10.1. Europe Elderflower Tonic Revenue (USD Million), by Segments (USD Million) (2021-2032)
10.1.1. Europe Elderflower Tonic Revenue (USD Million) by Type (2021-2032)
10.1.2. Europe Elderflower Tonic Revenue (USD Million) by Application (2021-2032)
10.1.3. Europe Elderflower Tonic Revenue (USD Million) by Product (2021-2032)
By Type
Dual Flavored
Singular Flavored
By Application
Domestic Place
Catering
Entertainment Venue
Others
Chapter 11. Asia Pacific Elderflower Tonic Analysis and Outlook
11.1. Asia Pacific Elderflower Tonic Revenue (USD Million), and Revenue (USD Million) by Segments (2021-2032)
11.1.1. Asia Pacific Elderflower Tonic Revenue (USD Million) by Type (2021-2032)
11.1.2. Asia Pacific Elderflower Tonic Revenue (USD Million) by Application (2021-2032)
11.1.3. Asia Pacific Elderflower Tonic Revenue (USD Million) by Product (2021-2032)
By Type
Dual Flavored
Singular Flavored
By Application
Domestic Place
Catering
Entertainment Venue
Others
Chapter 12. South America Elderflower Tonic Analysis and Outlook
12.1. South America Elderflower Tonic Revenue (USD Million), by Segments (2021-2032)
12.1.1. South America Elderflower Tonic Revenue (USD Million) by Type (2021-2032)
12.1.2. South America Elderflower Tonic Revenue (USD Million) by Application (2021-2032)
12.1.3. South America Elderflower Tonic Revenue (USD Million) by Product (2021-2032)
By Type
Dual Flavored
Singular Flavored
By Application
Domestic Place
Catering
Entertainment Venue
Others
Chapter 13. Middle East and Africa Elderflower Tonic Analysis and Outlook
13.1. Middle East and Africa Elderflower Tonic Revenue (USD Million), by Segments (2021-2032)
13.1.1. Middle East and Africa Elderflower Tonic Revenue (USD Million) by Type (2021-2032)
13.1.2. Middle East and Africa Elderflower Tonic Revenue (USD Million) by Application (2021-2032)
13.1.3. Middle East and Africa Elderflower Tonic Revenue (USD Million) by Product (2021-2032)
By Type
Dual Flavored
Singular Flavored
By Application
Domestic Place
Catering
Entertainment Venue
Others
Chapter 14. Elderflower Tonic Company Profiles
14.1 Business Overview
14.2 Product Profiles
14.3 SWOT Profiles
14.5 Recent Developments
14.6 Financial Profile
List of Companies
Belvoir Fruit Farms
Bottlegreen Drinks
FENTIMANS
FEVER-TREE
FRANKLIN&SONS
ICELANDIC GLACIAL
JACK RUDY COCKTAIL CO
Q MIXERS
SOCIAL
THOMAS HENRY
15. Methodology and Data Sources
15.1 Customization Offerings
15.2 Subscription Services
15.3 Related Reports
15.4 Publisher Expertise
LIST OF TABLES
Table 1 Market Segmentation Analysis
Table 2 Global Elderflower Tonic Market Share of Leading Companies, 2023
Table 3 Product Offerings of Leading Companies
Table 4 Low Growth Scenario Forecasts
Table 5 Reference Case Growth Scenario
Table 6 High Growth Case Scenario
Table 7 Global Elderflower Tonic Revenue (USD Million) And CAGR (%) By Type (2021-2032)
Table 8 Global Elderflower Tonic Revenue (USD Million) And CAGR (%) By Application (2021-2032)
Table 9 Global Elderflower Tonic Revenue (USD Million) And CAGR (%) By Product (2021-2032)
Table 10 Global Elderflower Tonic Market Revenue (USD Million) By Regions (2021-2032)
Table 11 Global Elderflower Tonic Market Share (%) By Regions (2021-2032)
Table 12 North America Elderflower Tonic Revenue (USD Million) By Country (2021-2032)
Table 13 Europe Elderflower Tonic Revenue (USD Million) By Country (2021-2032)
Table 14 Asia Pacific Elderflower Tonic Revenue (USD Million) By Country (2021-2032)
Table 15 South America Elderflower Tonic Revenue (USD Million) By Country (2021-2032)
Table 16 Middle East and Africa Elderflower Tonic Revenue (USD Million) By Region (2021-2032)
Table 17 North America Elderflower Tonic Revenue (USD Million) By Type (2021-2032)
Table 18 North America Elderflower Tonic Revenue (USD Million) By Application (2021-2032)
Table 19 North America Elderflower Tonic Revenue (USD Million) By Product (2021-2032)
Table 20 Europe Elderflower Tonic Revenue (USD Million) By Type (2021-2032)
Table 21 Europe Elderflower Tonic Revenue (USD Million) By Application (2021-2032)
Table 22 Europe Elderflower Tonic Revenue (USD Million) By Product (2021-2032)
Table 23 Asia Pacific Elderflower Tonic Revenue (USD Million) By Type (2021-2032)
Table 24 Asia Pacific Elderflower Tonic Revenue (USD Million) By Application (2021-2032)
Table 25 Asia Pacific Elderflower Tonic Revenue (USD Million) By Product (2021-2032)
Table 26 South America Elderflower Tonic Revenue (USD Million) By Type (2021-2032)
Table 27 South America Elderflower Tonic Revenue (USD Million) By Application (2021-2032)
Table 28 South America Elderflower Tonic Revenue (USD Million) By Product (2021-2032)
Table 29 Middle East and Africa Elderflower Tonic Revenue (USD Million) By Type (2021-2032)
Table 30 Middle East and Africa Elderflower Tonic Revenue (USD Million) By Application (2021-2032)
Table 31 Middle East and Africa Elderflower Tonic Revenue (USD Million) By Product (2021-2032)
LIST OF FIGURES
Figure 1. Market Scope
Figure 2. Pricing Forecasts Per Unit, 2023- 2032
Figure 3. Porter’s Five Forces
Figure 4. Global Elderflower Tonic Market Revenue (USD Million) By Regions (2021-2032)
Figure 5. Global Elderflower Tonic Market Share (%) By Regions (2023)
Figure 6. North America Elderflower Tonic Revenue (USD Million) By Country (2021-2032)
Figure 7. United States Elderflower Tonic Revenue (USD Million) By Country (2021-2032)
Figure 8. Canada Elderflower Tonic Revenue (USD Million) By Country (2021-2032)
Figure 9. Mexico Elderflower Tonic Revenue (USD Million) By Country (2021-2032)
Figure 10. Europe Elderflower Tonic Revenue (USD Million) By Country (2021-2032)
Figure 11. Germany Elderflower Tonic Revenue (USD Million) By Country (2021-2032)
Figure 12. France Elderflower Tonic Revenue (USD Million) By Country (2021-2032)
Figure 13. United Kingdom Elderflower Tonic Revenue (USD Million) By Country (2021-2032)
Figure 14. Spain Elderflower Tonic Revenue (USD Million) By Country (2021-2032)
Figure 15. Italy Elderflower Tonic Revenue (USD Million) By Country (2021-2032)
Figure 16. Russia Elderflower Tonic Revenue (USD Million) By Country (2021-2032)
Figure 17. Rest of Europe Elderflower Tonic Revenue (USD Million) By Country (2021-2032)
Figure 11. Asia Pacific Elderflower Tonic Revenue (USD Million) By Country (2021-2032)
Figure 12. China Elderflower Tonic Revenue (USD Million) By Country (2021-2032)
Figure 13. Japan Elderflower Tonic Revenue (USD Million) By Country (2021-2032)
Figure 14. India Elderflower Tonic Revenue (USD Million) By Country (2021-2032)
Figure 15. South Korea Elderflower Tonic Revenue (USD Million) By Country (2021-2032)
Figure 16. Australia Elderflower Tonic Revenue (USD Million) By Country (2021-2032)
Figure 17. South East Asia Elderflower Tonic Revenue (USD Million) By Country (2021-2032)
Figure 18. South America Elderflower Tonic Revenue (USD Million) By Country (2021-2032)
Figure 19. Brazil Elderflower Tonic Revenue (USD Million) By Country (2021-2032)
Figure 20. Argentina Elderflower Tonic Revenue (USD Million) By Country (2021-2032)
Figure 21. Rest of Asia Pacific Elderflower Tonic Revenue (USD Million) By Country (2021-2032)
Figure 22. Middle East and Africa Elderflower Tonic Revenue (USD Million) By Region (2021-2032)
Figure 23. Saudi Arabia Elderflower Tonic Revenue (USD Million) By Region (2021-2032)
Figure 24. The UAE Elderflower Tonic Revenue (USD Million) By Region (2021-2032)
Figure 25. Rest of Middle East Elderflower Tonic Revenue (USD Million) By Region (2021-2032)
Figure 26. South Africa Elderflower Tonic Revenue (USD Million) By Region (2021-2032)
Figure 27. Africa Elderflower Tonic Revenue (USD Million) By Region (2021-2032)
Figure 28. North America Elderflower Tonic Revenue (USD Million) By Type (2021-2032)
Figure 29. North America Elderflower Tonic Revenue (USD Million) By Application (2021-2032)
Figure 30. North America Elderflower Tonic Revenue (USD Million) By Product (2021-2032)
Figure 31. Europe Elderflower Tonic Revenue (USD Million) By Type (2021-2032)
Figure 32. Europe Elderflower Tonic Revenue (USD Million) By Application (2021-2032)
Figure 33. Europe Elderflower Tonic Revenue (USD Million) By Product (2021-2032)
Figure 34. Asia Pacific Elderflower Tonic Revenue (USD Million) By Type (2021-2032)
Figure 35. Asia Pacific Elderflower Tonic Revenue (USD Million) By Application (2021-2032)
Figure 36. Asia Pacific Elderflower Tonic Revenue (USD Million) By Product (2021-2032)
Figure 37. South America Elderflower Tonic Revenue (USD Million) By Type (2021-2032)
Figure 38. South America Elderflower Tonic Revenue (USD Million) By Application (2021-2032)
Figure 39. South America Elderflower Tonic Revenue (USD Million) By Product (2021-2032)
Figure 40. Middle East and Africa Elderflower Tonic Revenue (USD Million) By Type (2021-2032)
Figure 41. Middle East and Africa Elderflower Tonic Revenue (USD Million) By Application (2021-2032)
Figure 42. Middle East and Africa Elderflower Tonic Revenue (USD Million) By Product (2021-2032)
By Type
Dual Flavored
Singular Flavored
By Application
Domestic Place
Catering
Entertainment Venue
Others
Countries Analyzed
North America (US, Canada, Mexico)
Europe (Germany, UK, France, Spain, Italy, Russia, Rest of Europe)
Asia Pacific (China, India, Japan, South Korea, Australia, South East Asia, Rest of Asia)
South America (Brazil, Argentina, Rest of South America)
Middle East and Africa (Saudi Arabia, UAE, Rest of Middle East, South Africa, Egypt, Rest of Africa)
