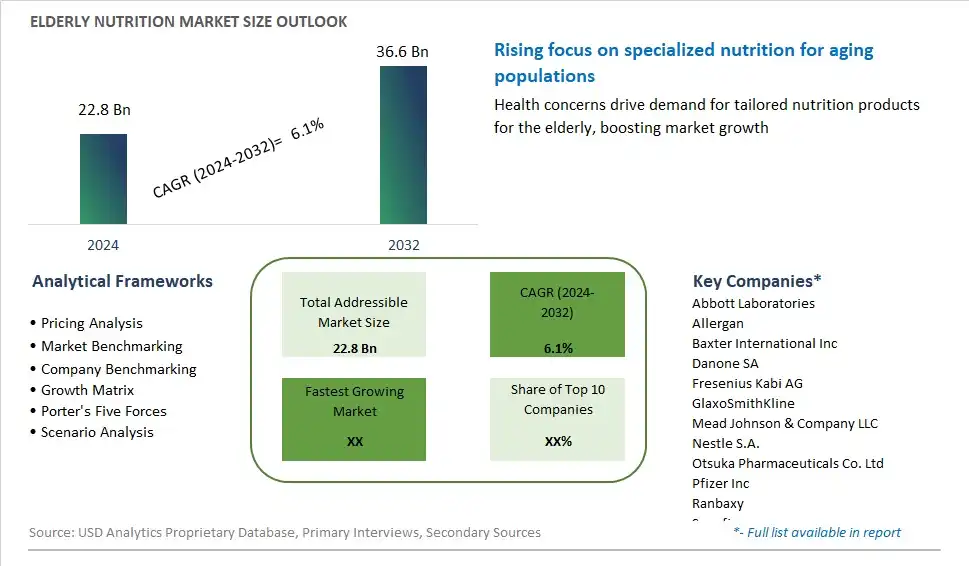
Global Elderly Nutrition Market Size is valued at $22.8 Billion in 2024 and is forecast to register a growth rate (CAGR) of 6.1% to reach $36.6 Billion by 2032.
The global Elderly Nutrition Market Comprehensive Study analyzes and forecasts the market size across 6 regions and 24 countries for diverse segments -By Product (Oral Nutritional Supplements (ONS), Enteral Nutrition (EN), Specialized Diets, Functional Foods), By Distribution Channel (Hospitals and Clinics, Retail Pharmacies, Supermarkets/Hypermarkets, Online), By End-User (Hospitals, Nursing Homes, Home Care, Independent Living)
An Introduction to Elderly Nutrition Market
Elderly nutrition refers to the dietary needs and considerations specific to older adults, typically those aged 65 and older, in 2024. As individuals age, their nutritional requirements may change due to factors such as decreased appetite, changes in metabolism, reduced absorption of nutrients, and the presence of chronic health conditions. Elderly nutrition focuses on promoting optimal health, well-being, and quality of life in older adults through balanced and nutrient-rich diets tailored to their unique needs and preferences. This may involve strategies such as increasing intake of protein, vitamins, and minerals to support muscle mass, bone health, and immune function, as well as addressing issues such as hydration, oral health, and digestive health. With the aging population and the prevalence of age-related health conditions, the importance of elderly nutrition is increasingly recognized by healthcare professionals, caregivers, and policymakers. The market for elderly nutrition products and services is expanding to meet the growing demand for specialized dietary solutions, including nutritional supplements, fortified foods, meal delivery services, and personalized nutrition plans, designed to support healthy aging and improve nutritional outcomes for older adults.
Elderly Nutrition Competitive Landscape
The market report analyses the leading companies in the industry including Abbott Laboratories, Allergan, Baxter International Inc, Danone SA, Fresenius Kabi AG, GlaxoSmithKline, Mead Johnson & Company LLC, Nestle S.A., Otsuka Pharmaceuticals Co. Ltd, Pfizer Inc, Ranbaxy, Sanofi, Wockhardt Ltd, and Others.
Elderly Nutrition Market Dynamics
Elderly Nutrition Market Trend: Growing Focus on Tailored Nutrition Solutions for Aging Population
A prominent trend in the elderly nutrition market is the growing focus on tailored nutrition solutions designed to meet the unique dietary needs and health challenges of the aging population. As the global population continues to age, there is increasing recognition of the importance of nutrition in supporting healthy aging, managing chronic conditions, and preserving cognitive function. This trend is driving the development of specialized nutritional products and dietary supplements formulated with key nutrients, vitamins, and minerals that address age-related nutritional deficiencies, promote muscle strength, bone health, and immune function, and support overall well-being in older adults. Additionally, there is a rising demand for convenient and functional food and beverage products tailored to the preferences and dietary restrictions of elderly consumers, including fortified foods, meal replacements, and nutritional shakes. As a result, manufacturers are investing in research and innovation to develop innovative elderly nutrition solutions that cater to the evolving needs and preferences of aging populations worldwide.
Market Driver: Aging Population and Increasing Health Consciousness
A key driver of the elderly nutrition market is the aging population demographic shift and the increasing health consciousness among older adults seeking to maintain their health and quality of life as they age. With advancements in healthcare and improvements in life expectancy, the global population is experiencing a significant increase in the number of elderly individuals aged 65 and older. This demographic shift is accompanied by a growing awareness of the importance of nutrition in preventing age-related diseases, managing chronic conditions, and promoting active and independent living in later life. As a result, there is a heightened demand for nutritional products and dietary supplements tailored to the specific needs and preferences of older adults, driving market growth and innovation in the elderly nutrition sector. Furthermore, rising disposable incomes, improved access to healthcare services, and proactive health-seeking behaviors among elderly consumers contribute to the expansion of the elderly nutrition market, creating opportunities for manufacturers to develop targeted products and services that address the evolving health and wellness needs of aging populations.
Market Opportunity: Expansion into Personalized Nutrition and Digital Health Solutions
An opportunity for the elderly nutrition market lies in the expansion into personalized nutrition and digital health solutions that leverage technology to deliver tailored dietary advice, nutritional support, and lifestyle interventions to older adults. With the advent of digital health platforms, mobile apps, and wearable devices, there is a growing interest in personalized nutrition services that use data analytics, artificial intelligence, and machine learning algorithms to assess individual nutritional needs, track dietary habits, and provide personalized dietary recommendations based on health status, genetic predispositions, and lifestyle factors. By integrating personalized nutrition into digital health platforms and telehealth services, manufacturers and healthcare providers can offer elderly consumers convenient access to personalized dietary guidance, nutritional counseling, and meal planning tools that empower them to make informed decisions about their nutrition and lifestyle choices. This approach not only enhances consumer engagement and adherence to dietary recommendations but also opens up new avenues for market growth and differentiation in the increasingly competitive elderly nutrition landscape.
Elderly Nutrition Market Share Analysis: Oral Nutritional Supplements (ONS) held the dominant market share in 2024
Among the segmentation of the Elderly Nutrition Market by Product, the Oral Nutritional Supplements (ONS) segment is the largest, driven by several factors contributing to its dominance in the market. ONS are widely recognized as convenient and effective solutions for addressing malnutrition and supporting the nutritional needs of elderly individuals. These supplements come in various forms such as liquids, powders, and bars, providing essential nutrients, vitamins, and minerals in a concentrated and easily digestible format. ONS are particularly favored by healthcare professionals for their ability to manage malnutrition, support recovery from illness or surgery, and improve overall nutritional intake in elderly patients. Additionally, the aging population worldwide, coupled with the increasing prevalence of chronic diseases and age-related conditions, has fueled the demand for ONS as part of comprehensive elderly care strategies. Further, advancements in ONS formulations, flavors, and packaging have further enhanced their appeal and acceptance among elderly consumers. As healthcare providers and caregivers prioritize preventive healthcare and holistic approaches to aging, the Oral Nutritional Supplements segment maintains its lead in the Elderly Nutrition Market, supported by its effectiveness, convenience, and versatility in meeting the unique nutritional needs of older adults.
Elderly Nutrition Market Share Analysis: Online Distribution Channel market is poised to register the fastest growth rae over the forecast period to 2032
Among the segmentation of the Elderly Nutrition Market by Distribution Channel, the Online segment is the fastest-growing, driven by several factors contributing to its rapid expansion. Online platforms offer elderly individuals and their caregivers convenient access to a wide range of nutritional products tailored to their specific needs, preferences, and dietary requirements. The increasing adoption of e-commerce channels by elderly consumers, coupled with the convenience and flexibility of online shopping, has fueled the growth of the Online Distribution Channel in the Elderly Nutrition Market. Additionally, the COVID-19 pandemic has accelerated the shift towards online shopping as consumers prioritize safety and convenience amid social distancing measures and lockdown restrictions. Further, online retailers often offer a broader selection of elderly nutrition products, including specialized diets, oral nutritional supplements, and functional foods, catering to diverse needs and preferences. As the elderly population continues to grow and age-related health concerns rise, the Online Distribution Channel in the Elderly Nutrition Market experiences robust growth, driven by its ability to provide convenient access to essential nutritional products and support the health and well-being of older adults.
Elderly Nutrition Market Share Analysis: Hospitals End-User Segment held the dominant market share in 2024
Among the segmentation of the Elderly Nutrition Market by End-User, the Hospitals segment is the largest, driven by several factors contributing to its dominance in the market. Hospitals play a critical role in providing comprehensive healthcare services to elderly individuals, including nutritional support and management. With the aging population and the increasing prevalence of chronic diseases and age-related conditions, hospitals have become key settings for addressing malnutrition and ensuring optimal nutritional intake among elderly patients. Healthcare professionals in hospitals routinely assess and monitor the nutritional status of elderly patients and prescribe oral nutritional supplements (ONS) or enteral nutrition (EN) as part of their treatment plans. Further, hospitals often have specialized dietary departments and clinical nutritionists who work closely with elderly patients to develop personalized nutrition interventions tailored to their specific needs and medical conditions. Additionally, the availability of government-funded healthcare programs and insurance coverage for nutritional support services in hospitals further drives the adoption of elderly nutrition products and services in this segment. As hospitals continue to prioritize preventive healthcare and holistic approaches to aging, the Hospitals End-User Segment maintains its lead in the Elderly Nutrition Market, supported by its comprehensive care capabilities and focus on improving the nutritional health of elderly patients.
Elderly Nutrition Market Segmentation
By Product
Oral Nutritional Supplements (ONS)
Enteral Nutrition (EN)
Specialized Diets
Functional Foods
By Distribution Channel
Hospitals and Clinics
Retail Pharmacies
Supermarkets/Hypermarkets
Online
By End-User
Hospitals
Nursing Homes
Home Care
Independent Living
Countries Analyzed
North America (US, Canada, Mexico)
Europe (Germany, UK, France, Spain, Italy, Russia, Rest of Europe)
Asia Pacific (China, India, Japan, South Korea, Australia, South East Asia, Rest of Asia)
South America (Brazil, Argentina, Rest of South America)
Middle East and Africa (Saudi Arabia, UAE, Rest of Middle East, South Africa, Egypt, Rest of Africa)
Elderly Nutrition Companies Profiled in the Study
Abbott Laboratories
Allergan
Baxter International Inc
Danone SA
Fresenius Kabi AG
GlaxoSmithKline
Mead Johnson & Company LLC
Nestle S.A.
Otsuka Pharmaceuticals Co. Ltd
Pfizer Inc
Ranbaxy
Sanofi
Wockhardt Ltd
*- List Not Exhaustive
Chapter 1. TABLE OF CONTENTS
Chapter 2. Introduction to Elderly Nutrition Market
2.1. Market Overview
2.2. Key Statistics and Report Highlights
2.3. Scope of the Comprehensive Study
2.3.1. Market Definition
2.3.2 Countries and Regions Covered
2.3.3 Research Objective
2.3.4 Units, Currency, and Conversions
2.3.5 Industry Value Chain
2.4. Key Market Segments
2.5. Key Companies
2.6. Study Period
Chapter 3. Strategic Analysis Review
3.1. Elderly Nutrition Pricing Analysis and Forecast
3.2. Porter’s Five Forces
3.3. Market Ecosystem
3.4. SWOT Analysis
3.5. Regulatory Scenario
3.3. Effects of Inflation, Russia-Ukraine War, moderating economic growth, and other macroeconomic factors
Chapter 4. Competitive Landscape
4.1. Market Share Analysis
4.1.1. Global Elderly Nutrition Market Share by Company, 2023
4.1.2. Product Offerings of Leading Elderly Nutrition Companies
4.2. Market Entropy
4.2.1. New Product Launches in the Industry
4.2.2. Mergers, Acquisitions, Joint ventures, and Partnerships
4.3. Key Strategies and Best Practices
Chapter 5. Global Market Projections: Best, Reference, and Low Case Scenarios
5.1. Growth Analysis- Case Scenario Definitions
5.2. Low Growth Case Scenario Forecasts
5.3. Reference Growth Case Scenario Forecasts
5.4. High Growth Case Scenario Forecasts
Chapter 6. Market Dynamics
6.1. Elderly Nutrition Market Drivers
6.2. Elderly Nutrition Market Challenges
6.6. Elderly Nutrition Market Opportunities
6.4. Elderly Nutrition Market Trends
Chapter 7. Global Elderly Nutrition Market Outlook Trends
7.1. Global Elderly Nutrition Revenue (USD Million) and CAGR (%) by Type (2021-2032)
7.2. Global Elderly Nutrition Revenue (USD Million) and CAGR (%) by Application (2021-2032)
7.3. Global Elderly Nutrition Revenue (USD Million) and CAGR (%) by Product (2021-2032)
By Product
Oral Nutritional Supplements (ONS)
Enteral Nutrition (EN)
Specialized Diets
Functional Foods
By Distribution Channel
Hospitals and Clinics
Retail Pharmacies
Supermarkets/Hypermarkets
Online
By End-User
Hospitals
Nursing Homes
Home Care
Independent Living
Chapter 8. Global Elderly Nutrition Regional Analysis and Outlook
8.1. Global Elderly Nutrition Revenue (USD Million) By Regions (2021- 2032)
8.2. North America Elderly Nutrition Revenue (USD Million) by Country (2021-2032)
8.2.1. United States Elderly Nutrition Regional Analysis and Outlook
8.2.2. Canada Elderly Nutrition Regional Analysis and Outlook
8.2.3. Mexico Elderly Nutrition Regional Analysis and Outlook
8.3. Europe Elderly Nutrition Revenue (USD Million), by Country (2021-2032)
8.3.1. Germany Elderly Nutrition Regional Analysis and Outlook
8.3.2. France Elderly Nutrition Regional Analysis and Outlook
8.3.3. United Kingdom Elderly Nutrition Regional Analysis and Outlook
8.3.4. Spain Elderly Nutrition Regional Analysis and Outlook
8.3.5. Italy Elderly Nutrition Regional Analysis and Outlook
8.3.6. Russia Elderly Nutrition Regional Analysis and Outlook
8.3.7. Rest of Europe Elderly Nutrition Regional Analysis and Outlook
8.4. Asia Pacific Elderly Nutrition Revenue (USD Million) by Country (2021-2032)
8.4.1. China Elderly Nutrition Regional Analysis and Outlook
8.4.2. Japan Elderly Nutrition Regional Analysis and Outlook
8.4.3. India Elderly Nutrition Regional Analysis and Outlook
8.4.4. South Korea Elderly Nutrition Regional Analysis and Outlook
8.4.5. Australia Elderly Nutrition Regional Analysis and Outlook
8.4.6. South East Asia Elderly Nutrition Regional Analysis and Outlook
8.4.7. Rest of Asia Pacific Elderly Nutrition Regional Analysis and Outlook
8.5. South America Elderly Nutrition Revenue (USD Million), by Country (2021-2032)
8.5.1. Brazil Elderly Nutrition Regional Analysis and Outlook
8.5.2. Argentina Elderly Nutrition Regional Analysis and Outlook
8.5.3. Rest of South America Elderly Nutrition Regional Analysis and Outlook
8.6. Middle East and Africa Elderly Nutrition Revenue (USD Million) by Country (2021-2032)
8.6.1. Middle East Elderly Nutrition Regional Analysis and Outlook
8.6.2. Africa Elderly Nutrition Regional Analysis and Outlook
Chapter 9. North America Elderly Nutrition Analysis and Outlook
9.1. North America Elderly Nutrition Revenue (USD Million) by Segments (2021-2032)
9.1.1. North America Elderly Nutrition Revenue (USD Million) by Type (2021-2032)
9.1.2. North America Elderly Nutrition Revenue (USD Million) by Application (2021-2032)
9.1.3. North America Elderly Nutrition Revenue (USD Million) by Product (2021-2032)
By Product
Oral Nutritional Supplements (ONS)
Enteral Nutrition (EN)
Specialized Diets
Functional Foods
By Distribution Channel
Hospitals and Clinics
Retail Pharmacies
Supermarkets/Hypermarkets
Online
By End-User
Hospitals
Nursing Homes
Home Care
Independent Living
Chapter 10. Europe Elderly Nutrition Analysis and Outlook
10.1. Europe Elderly Nutrition Revenue (USD Million), by Segments (USD Million) (2021-2032)
10.1.1. Europe Elderly Nutrition Revenue (USD Million) by Type (2021-2032)
10.1.2. Europe Elderly Nutrition Revenue (USD Million) by Application (2021-2032)
10.1.3. Europe Elderly Nutrition Revenue (USD Million) by Product (2021-2032)
By Product
Oral Nutritional Supplements (ONS)
Enteral Nutrition (EN)
Specialized Diets
Functional Foods
By Distribution Channel
Hospitals and Clinics
Retail Pharmacies
Supermarkets/Hypermarkets
Online
By End-User
Hospitals
Nursing Homes
Home Care
Independent Living
Chapter 11. Asia Pacific Elderly Nutrition Analysis and Outlook
11.1. Asia Pacific Elderly Nutrition Revenue (USD Million), and Revenue (USD Million) by Segments (2021-2032)
11.1.1. Asia Pacific Elderly Nutrition Revenue (USD Million) by Type (2021-2032)
11.1.2. Asia Pacific Elderly Nutrition Revenue (USD Million) by Application (2021-2032)
11.1.3. Asia Pacific Elderly Nutrition Revenue (USD Million) by Product (2021-2032)
By Product
Oral Nutritional Supplements (ONS)
Enteral Nutrition (EN)
Specialized Diets
Functional Foods
By Distribution Channel
Hospitals and Clinics
Retail Pharmacies
Supermarkets/Hypermarkets
Online
By End-User
Hospitals
Nursing Homes
Home Care
Independent Living
Chapter 12. South America Elderly Nutrition Analysis and Outlook
12.1. South America Elderly Nutrition Revenue (USD Million), by Segments (2021-2032)
12.1.1. South America Elderly Nutrition Revenue (USD Million) by Type (2021-2032)
12.1.2. South America Elderly Nutrition Revenue (USD Million) by Application (2021-2032)
12.1.3. South America Elderly Nutrition Revenue (USD Million) by Product (2021-2032)
By Product
Oral Nutritional Supplements (ONS)
Enteral Nutrition (EN)
Specialized Diets
Functional Foods
By Distribution Channel
Hospitals and Clinics
Retail Pharmacies
Supermarkets/Hypermarkets
Online
By End-User
Hospitals
Nursing Homes
Home Care
Independent Living
Chapter 13. Middle East and Africa Elderly Nutrition Analysis and Outlook
13.1. Middle East and Africa Elderly Nutrition Revenue (USD Million), by Segments (2021-2032)
13.1.1. Middle East and Africa Elderly Nutrition Revenue (USD Million) by Type (2021-2032)
13.1.2. Middle East and Africa Elderly Nutrition Revenue (USD Million) by Application (2021-2032)
13.1.3. Middle East and Africa Elderly Nutrition Revenue (USD Million) by Product (2021-2032)
By Product
Oral Nutritional Supplements (ONS)
Enteral Nutrition (EN)
Specialized Diets
Functional Foods
By Distribution Channel
Hospitals and Clinics
Retail Pharmacies
Supermarkets/Hypermarkets
Online
By End-User
Hospitals
Nursing Homes
Home Care
Independent Living
Chapter 14. Elderly Nutrition Company Profiles
14.1 Business Overview
14.2 Product Profiles
14.3 SWOT Profiles
14.5 Recent Developments
14.6 Financial Profile
List of Companies
Abbott Laboratories
Allergan
Baxter International Inc
Danone SA
Fresenius Kabi AG
GlaxoSmithKline
Mead Johnson & Company LLC
Nestle S.A.
Otsuka Pharmaceuticals Co. Ltd
Pfizer Inc
Ranbaxy
Sanofi
Wockhardt Ltd
15. Methodology and Data Sources
15.1 Customization Offerings
15.2 Subscription Services
15.3 Related Reports
15.4 Publisher Expertise
LIST OF TABLES
Table 1 Market Segmentation Analysis
Table 2 Global Elderly Nutrition Market Share of Leading Companies, 2023
Table 3 Product Offerings of Leading Companies
Table 4 Low Growth Scenario Forecasts
Table 5 Reference Case Growth Scenario
Table 6 High Growth Case Scenario
Table 7 Global Elderly Nutrition Revenue (USD Million) And CAGR (%) By Type (2021-2032)
Table 8 Global Elderly Nutrition Revenue (USD Million) And CAGR (%) By Application (2021-2032)
Table 9 Global Elderly Nutrition Revenue (USD Million) And CAGR (%) By Product (2021-2032)
Table 10 Global Elderly Nutrition Market Revenue (USD Million) By Regions (2021-2032)
Table 11 Global Elderly Nutrition Market Share (%) By Regions (2021-2032)
Table 12 North America Elderly Nutrition Revenue (USD Million) By Country (2021-2032)
Table 13 Europe Elderly Nutrition Revenue (USD Million) By Country (2021-2032)
Table 14 Asia Pacific Elderly Nutrition Revenue (USD Million) By Country (2021-2032)
Table 15 South America Elderly Nutrition Revenue (USD Million) By Country (2021-2032)
Table 16 Middle East and Africa Elderly Nutrition Revenue (USD Million) By Region (2021-2032)
Table 17 North America Elderly Nutrition Revenue (USD Million) By Type (2021-2032)
Table 18 North America Elderly Nutrition Revenue (USD Million) By Application (2021-2032)
Table 19 North America Elderly Nutrition Revenue (USD Million) By Product (2021-2032)
Table 20 Europe Elderly Nutrition Revenue (USD Million) By Type (2021-2032)
Table 21 Europe Elderly Nutrition Revenue (USD Million) By Application (2021-2032)
Table 22 Europe Elderly Nutrition Revenue (USD Million) By Product (2021-2032)
Table 23 Asia Pacific Elderly Nutrition Revenue (USD Million) By Type (2021-2032)
Table 24 Asia Pacific Elderly Nutrition Revenue (USD Million) By Application (2021-2032)
Table 25 Asia Pacific Elderly Nutrition Revenue (USD Million) By Product (2021-2032)
Table 26 South America Elderly Nutrition Revenue (USD Million) By Type (2021-2032)
Table 27 South America Elderly Nutrition Revenue (USD Million) By Application (2021-2032)
Table 28 South America Elderly Nutrition Revenue (USD Million) By Product (2021-2032)
Table 29 Middle East and Africa Elderly Nutrition Revenue (USD Million) By Type (2021-2032)
Table 30 Middle East and Africa Elderly Nutrition Revenue (USD Million) By Application (2021-2032)
Table 31 Middle East and Africa Elderly Nutrition Revenue (USD Million) By Product (2021-2032)
LIST OF FIGURES
Figure 1. Market Scope
Figure 2. Pricing Forecasts Per Unit, 2023- 2032
Figure 3. Porter’s Five Forces
Figure 4. Global Elderly Nutrition Market Revenue (USD Million) By Regions (2021-2032)
Figure 5. Global Elderly Nutrition Market Share (%) By Regions (2023)
Figure 6. North America Elderly Nutrition Revenue (USD Million) By Country (2021-2032)
Figure 7. United States Elderly Nutrition Revenue (USD Million) By Country (2021-2032)
Figure 8. Canada Elderly Nutrition Revenue (USD Million) By Country (2021-2032)
Figure 9. Mexico Elderly Nutrition Revenue (USD Million) By Country (2021-2032)
Figure 10. Europe Elderly Nutrition Revenue (USD Million) By Country (2021-2032)
Figure 11. Germany Elderly Nutrition Revenue (USD Million) By Country (2021-2032)
Figure 12. France Elderly Nutrition Revenue (USD Million) By Country (2021-2032)
Figure 13. United Kingdom Elderly Nutrition Revenue (USD Million) By Country (2021-2032)
Figure 14. Spain Elderly Nutrition Revenue (USD Million) By Country (2021-2032)
Figure 15. Italy Elderly Nutrition Revenue (USD Million) By Country (2021-2032)
Figure 16. Russia Elderly Nutrition Revenue (USD Million) By Country (2021-2032)
Figure 17. Rest of Europe Elderly Nutrition Revenue (USD Million) By Country (2021-2032)
Figure 11. Asia Pacific Elderly Nutrition Revenue (USD Million) By Country (2021-2032)
Figure 12. China Elderly Nutrition Revenue (USD Million) By Country (2021-2032)
Figure 13. Japan Elderly Nutrition Revenue (USD Million) By Country (2021-2032)
Figure 14. India Elderly Nutrition Revenue (USD Million) By Country (2021-2032)
Figure 15. South Korea Elderly Nutrition Revenue (USD Million) By Country (2021-2032)
Figure 16. Australia Elderly Nutrition Revenue (USD Million) By Country (2021-2032)
Figure 17. South East Asia Elderly Nutrition Revenue (USD Million) By Country (2021-2032)
Figure 18. South America Elderly Nutrition Revenue (USD Million) By Country (2021-2032)
Figure 19. Brazil Elderly Nutrition Revenue (USD Million) By Country (2021-2032)
Figure 20. Argentina Elderly Nutrition Revenue (USD Million) By Country (2021-2032)
Figure 21. Rest of Asia Pacific Elderly Nutrition Revenue (USD Million) By Country (2021-2032)
Figure 22. Middle East and Africa Elderly Nutrition Revenue (USD Million) By Region (2021-2032)
Figure 23. Saudi Arabia Elderly Nutrition Revenue (USD Million) By Region (2021-2032)
Figure 24. The UAE Elderly Nutrition Revenue (USD Million) By Region (2021-2032)
Figure 25. Rest of Middle East Elderly Nutrition Revenue (USD Million) By Region (2021-2032)
Figure 26. South Africa Elderly Nutrition Revenue (USD Million) By Region (2021-2032)
Figure 27. Africa Elderly Nutrition Revenue (USD Million) By Region (2021-2032)
Figure 28. North America Elderly Nutrition Revenue (USD Million) By Type (2021-2032)
Figure 29. North America Elderly Nutrition Revenue (USD Million) By Application (2021-2032)
Figure 30. North America Elderly Nutrition Revenue (USD Million) By Product (2021-2032)
Figure 31. Europe Elderly Nutrition Revenue (USD Million) By Type (2021-2032)
Figure 32. Europe Elderly Nutrition Revenue (USD Million) By Application (2021-2032)
Figure 33. Europe Elderly Nutrition Revenue (USD Million) By Product (2021-2032)
Figure 34. Asia Pacific Elderly Nutrition Revenue (USD Million) By Type (2021-2032)
Figure 35. Asia Pacific Elderly Nutrition Revenue (USD Million) By Application (2021-2032)
Figure 36. Asia Pacific Elderly Nutrition Revenue (USD Million) By Product (2021-2032)
Figure 37. South America Elderly Nutrition Revenue (USD Million) By Type (2021-2032)
Figure 38. South America Elderly Nutrition Revenue (USD Million) By Application (2021-2032)
Figure 39. South America Elderly Nutrition Revenue (USD Million) By Product (2021-2032)
Figure 40. Middle East and Africa Elderly Nutrition Revenue (USD Million) By Type (2021-2032)
Figure 41. Middle East and Africa Elderly Nutrition Revenue (USD Million) By Application (2021-2032)
Figure 42. Middle East and Africa Elderly Nutrition Revenue (USD Million) By Product (2021-2032)
By Product
Oral Nutritional Supplements (ONS)
Enteral Nutrition (EN)
Specialized Diets
Functional Foods
By Distribution Channel
Hospitals and Clinics
Retail Pharmacies
Supermarkets/Hypermarkets
Online
By End-User
Hospitals
Nursing Homes
Home Care
Independent Living
Countries Analyzed
North America (US, Canada, Mexico)
Europe (Germany, UK, France, Spain, Italy, Russia, Rest of Europe)
Asia Pacific (China, India, Japan, South Korea, Australia, South East Asia, Rest of Asia)
South America (Brazil, Argentina, Rest of South America)
Middle East and Africa (Saudi Arabia, UAE, Rest of Middle East, South Africa, Egypt, Rest of Africa)
