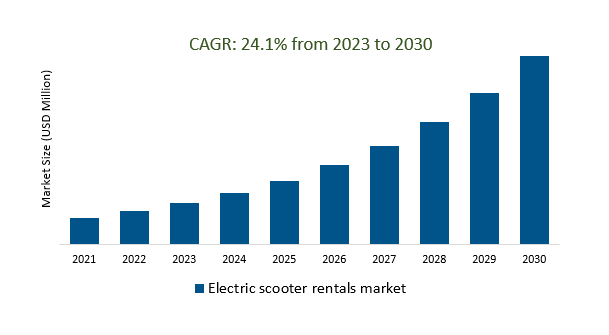
The global electric scooter rentals market Size is estimated to register 24.1% growth over the forecast period from 2023 to 2030.
The electric scooter rentals market has experienced significant growth and evolution due to factors such as urbanization, environmental concerns, government support, technological advancements, competition, safety considerations, and consumer adoption. Urbanization has led to traffic congestion and pollution issues, while environmental awareness has driven the adoption of electric scooters. The micro-mobility revolution has also influenced the market, offering a flexible and affordable way to move around cities. Governments have introduced regulations to support the safe operation of electric scooters, and venture capitalists and tech companies have invested in the market. Technological advancements have improved the performance and usability of electric scooters, and partnerships with public transportation agencies have increased their popularity. The market is highly competitive, with companies vying for market share and safety features. Expansion to new markets and consumer adoption are also driving market growth.
Addressing Urban Congestion with Electric Scooters is boosting the market.
The use of electric scooters as a solution to urban congestion has sparked a significant surge in the electric scooter rentals market. These convenient and eco-friendly modes of transportation are swiftly gaining popularity among urban dwellers looking for efficient ways to navigate crowded city streets. Electric scooters offer a sustainable alternative to traditional gas-powered vehicles, reducing air pollution and traffic congestion. Moreover, their ease of use, availability through smartphone apps, and affordability make them an attractive choice for short-distance commutes. As cities continue to invest in infrastructure to support electric scooter rentals, this market is poised for continued growth, contributing to cleaner, less congested urban environments.
The Competition of Innovation and Affordability is creating a demand in the Electric Scooter Rental Market.
The Electric Scooter Rental Market is currently witnessing a fierce competition driven by the dual forces of innovation and affordability. As technology advances, companies are constantly introducing innovative features and improvements to their electric scooters, enticing consumers with enhanced performance, safety features, and convenience. Simultaneously, affordability remains a key factor in attracting a wider customer base, as companies strive to offer competitive pricing and flexible rental options, making electric scooters an economically viable choice for urban transportation. This competitive landscape is ultimately benefiting consumers, as they gain access to cutting-edge electric scooters that are not only innovative but also cost-effective, thereby fueling the growing demand for electric scooter rentals worldwide.
Investment and Funding is Transforming the Electric Scooter Rental Market.
Investment and funding are playing a pivotal role in reshaping the landscape of the electric scooter rental market. With growing demand for eco-friendly urban transportation solutions, companies in this sector are attracting substantial investments. These financial injections are facilitating rapid expansion, allowing scooter rental platforms to enter new markets, enhance their technology, and improve overall service quality. This influx of capital is also fostering innovation, with companies developing advanced scooters equipped with cutting-edge features and improved sustainability practices. As a result, the electric scooter rental market is experiencing a significant transformation, becoming more accessible, convenient, and environmentally conscious, ultimately driving its growth and sustainability in the modern urban mobility landscape.
Market Share Analysis:
Folding electric scooters reign as the dominant choice in the rental market.
The dominance is due to their key advantages. These scooters are highly favored for their portability, as they can be easily folded and transported. Their lightweight design enhances maneuverability and ease of carrying, while their affordability makes them a preferred option for rental companies. Popular models in this category include the Bird One, Lime-S, Spin S, Razor E Prime, and Xiaomi Mi Electric Scooter M3. While other electric scooter types like retro and self-balancing scooters are also available for rental, they do not hold the same dominance, with retro scooters appealing for their classic aesthetics but being heavier and less portable than folding counterparts.
Electric propulsion dominates the electric scooter rental market.
Unlike pedal scooters, which are seldom used for rentals due to their inconvenience and inefficiency, and gasoline scooters, which are less popular due to their pollution and maintenance requirements, electric scooters offer a winning combination of convenience, efficiency, and environmental friendliness. Electric scooters are favoured because they are easy to use, require minimal physical effort, can cover longer distances and reach higher speeds on a single charge, and produce zero emissions. This growth is driven by the rising popularity of electric scooters as a transportation mode, increasing demand for convenient and cost-effective transportation choices, the growth of urban mobility, and the greater adoption of sustainable transportation solutions.
The dominant operational model in the electric scooter rental market is dockless.
Station-based scooters require users to pick up and return them to specific docking stations, dockless scooters can be parked anywhere, offering unmatched convenience. Users can easily pick up and drop off dockless scooters at their convenience, making them a popular choice. This dominance is attributed to the factors of convenience, wider accessibility, and often lower rental costs compared to station-based alternatives.
Pay-as-you-go stands out as the dominant service type in the electric scooter rental market.
Pay as you go foremost appeal lies in convenience, as users can swiftly access and ride electric scooters through a simple app without the need for long-term commitments or subscriptions. Additionally, pay-as-you-go tends to be more budget-friendly, with users only paying for the time they actively use the scooter, devoid of monthly or yearly fees. This service type also champions flexibility, permitting users to ride whenever they please without limitations. While subscription-based services have been gaining traction, they still hold a relatively modest share of the market, primarily offering discounts on per-minute rates at the cost of requiring users to commit to contractual terms.
The most dominant region is North America, particularly in the United States.
North America has experienced robust growth in the electric scooter rental industry due to factors like well-developed urban infrastructure, increased adoption of sustainable transportation, and the presence of major scooter-sharing companies. Cities like Los Angeles, San Francisco, and Austin have seen widespread use of electric scooters for last-mile transportation. Additionally, regulatory support and a high level of investment in the industry have contributed to its dominance in this region.
Electric Scooter Rentals Market Segmentation
By Type
- Retro
- Self-Balancing
- Folding
By Propulsion
By Operational Model
By Service Type
- Pay as you go
- Subscription-based
By Region
- North America (United States, Canada, Mexico)
- Europe (Germany, France, United Kingdom, Spain, Italy, Others)
- Asia Pacific (China, India, Japan, South Korea, Australia, Others)
- Latin America (Brazil, Argentina, Others)
- Middle East and Africa (Saudi Arabia, UAE, Kuwait, Other Middle East, South Africa, Nigeria, Other Africa)
Electric Scooter Rentals Market Companies
Leading Companies profiled in the study include-
- Grow Mobility (China)
- Helbiz (United States)
- Jump (United States)
- Lime (United States)
- Bird (United States)
- Ola Electric (India)
- nextbike (Germany)
- Cityscoot (France)
- Bolt (Estonia)
*List Not Exhaustive
Electric scooter rentals Market Outlook 2023
1 Market Overview
1.1 Introduction to the Electric scooter rentals Market
1.2 Scope of the Study
1.3 Research Objective
1.3.1 Key Market Scope and Segments
1.3.2 Players Covered
1.3.3 Years Considered
2 Executive Summary
2.1 2023 Electric scooter rentals Industry- Market Statistics
3 Market Dynamics
3.1 Market Drivers
3.2 Market Challenges
3.3 Market Opportunities
3.4 Market Trends
4 Market Factor Analysis
4.1 Porter’s Five Forces
4.2 Market Entropy
4.2.1 Global Electric scooter rentals Market Companies with Area Served
4.2.2 Products Offerings Global Electric scooter rentals Market
5 COVID-19 Impact Analysis and Outlook Scenarios
5.1.1 Covid-19 Impact Analysis
5.1.2 Post-COVID-19 Scenario- Low Growth Case
5.1.3 Post-COVID-19 Scenario- Reference Growth Case
5.1.4 Post-COVID-19 Scenario- Low Growth Case
6 Global Electric scooter rentals Market Trends
6.1 Global Electric scooter rentals Revenue (USD Million) and CAGR (%) by Type (2018-2030)
6.2 Global Electric scooter rentals Revenue (USD Million) and CAGR (%) by Applications (2018-2030)
6.3 Global Electric scooter rentals Revenue (USD Million) and CAGR (%) by Regions (2018-2030)
7 Global Electric scooter rentals Market Revenue (USD Million) by Type, and Applications (2018-2022)
7.1 Global Electric scooter rentals Revenue (USD Million) by Type (2018-2022)
7.1.1 Global Electric scooter rentals Revenue (USD Million), Market Share (%) by Type (2018-2022)
7.2 Global Electric scooter rentals Revenue (USD Million) by Applications (2018-2022)
7.2.1 Global Electric scooter rentals Revenue (USD Million), Market Share (%) by Applications (2018-2022)
8 Global Electric scooter rentals Development Regional Status and Outlook
8.1 Global Electric scooter rentals Revenue (USD Million) By Regions (2018-2022)
8.2 North America Electric scooter rentals Revenue (USD Million) by Type, and Application (2018-2022)
8.2.1 North America Electric scooter rentals Revenue (USD Million) by Country (2018-2022)
8.2.2 North America Electric scooter rentals Revenue (USD Million) by Type (2018-2022)
8.2.3 North America Electric scooter rentals Revenue (USD Million) by Applications (2018-2022)
8.3 Europe Electric scooter rentals Revenue (USD Million), by Type, and Applications (USD Million) (2018-2022)
8.3.1 Europe Electric scooter rentals Revenue (USD Million), by Country (2018-2022)
8.3.2 Europe Electric scooter rentals Revenue (USD Million) by Type (2018-2022)
8.3.3 Europe Electric scooter rentals Revenue (USD Million) by Applications (2018-2022)
8.4 Asia Pacific Electric scooter rentals Revenue (USD Million), and Revenue (USD Million) by Type, and Applications (2018-2022)
8.4.1 Asia Pacific Electric scooter rentals Revenue (USD Million) by Country (2018-2022)
8.4.2 Asia Pacific Electric scooter rentals Revenue (USD Million) by Type (2018-2022)
8.4.3 Asia Pacific Electric scooter rentals Revenue (USD Million) by Applications (2018-2022)
8.5 South America Electric scooter rentals Revenue (USD Million), by Type, and Applications (2018-2022)
8.5.1 South America Electric scooter rentals Revenue (USD Million), by Country (2018-2022)
8.5.2 South America Electric scooter rentals Revenue (USD Million) by Type (2018-2022)
8.5.3 South America Electric scooter rentals Revenue (USD Million) by Applications (2018-2022)
8.6 Middle East and Africa Electric scooter rentals Revenue (USD Million), by Type, Technology, Application, Thickness (2018-2022)
8.6.1 Middle East and Africa Electric scooter rentals Revenue (USD Million) by Country (2018-2022)
8.6.2 Middle East and Africa Electric scooter rentals Revenue (USD Million) by Type (2018-2022)
8.6.3 Middle East and Africa Electric scooter rentals Revenue (USD Million) by Applications (2018-2022)
9 Company Profiles
10 Global Electric scooter rentals Market Revenue (USD Million), by Type, and Applications (2023-2030)
10.1 Global Electric scooter rentals Revenue (USD Million) and Market Share (%) by Type (2023-2030)
10.1.1 Global Electric scooter rentals Revenue (USD Million), and Market Share (%) by Type (2023-2030)
10.2 Global Electric scooter rentals Revenue (USD Million) and Market Share (%) by Applications (2023-2030)
10.2.1 Global Electric scooter rentals Revenue (USD Million), and Market Share (%) by Applications (2023-2030)
11 Global Electric scooter rentals Development Regional Status and Outlook Forecast
11.1 Global Electric scooter rentals Revenue (USD Million) By Regions (2023-2030)
11.2 North America Electric scooter rentals Revenue (USD Million) by Type, and Applications (2023-2030)
11.2.1 North America Electric scooter rentals Revenue (USD) Million by Country (2023-2030)
11.2.2 North America Electric scooter rentals Revenue (USD Million), by Type (2023-2030)
11.2.3 North America Electric scooter rentals Revenue (USD Million), Market Share (%) by Applications (2023-2030)
11.3 Europe Electric scooter rentals Revenue (USD Million), by Type, and Applications (2023-2030)
11.3.1 Europe Electric scooter rentals Revenue (USD Million), by Country (2023-2030)
11.3.2 Europe Electric scooter rentals Revenue (USD Million), by Type (2023-2030)
11.3.3 Europe Electric scooter rentals Revenue (USD Million), by Applications (2023-2030)
11.4 Asia Pacific Electric scooter rentals Revenue (USD Million) by Type, and Applications (2023-2030)
11.4.1 Asia Pacific Electric scooter rentals Revenue (USD Million), by Country (2023-2030)
11.4.2 Asia Pacific Electric scooter rentals Revenue (USD Million), by Type (2023-2030)
11.4.3 Asia Pacific Electric scooter rentals Revenue (USD Million), by Applications (2023-2030)
11.5 South America Electric scooter rentals Revenue (USD Million), by Type, and Applications (2023-2030)
11.5.1 South America Electric scooter rentals Revenue (USD Million), by Country (2023-2030)
11.5.2 South America Electric scooter rentals Revenue (USD Million), by Type (2023-2030)
11.5.3 South America Electric scooter rentals Revenue (USD Million), by Applications (2023-2030)
11.6 Middle East and Africa Electric scooter rentals Revenue (USD Million), by Type, and Applications (2023-2030)
11.6.1 Middle East and Africa Electric scooter rentals Revenue (USD Million), by Region (2023-2030)
11.6.2 Middle East and Africa Electric scooter rentals Revenue (USD Million), by Type (2023-2030)
11.6.3 Middle East and Africa Electric scooter rentals Revenue (USD Million), by Applications (2023-2030)
12 Methodology and Data Sources
12.1 Methodology/Research Approach
12.1.1 Research Programs/Design
12.1.2 Market Size Estimation
12.1.3 Market Breakdown and Data Triangulation
12.2 Data Sources
12.2.1 Secondary Sources
12.2.2 Primary Sources
12.3 Disclaimer
List of Tables
Table 1 Market Segmentation Analysis
Table 2 Global Electric scooter rentals Market Companies with Areas Served
Table 3 Products Offerings Global Electric scooter rentals Market
Table 4 Low Growth Scenario Forecasts
Table 5 Reference Case Growth Scenario
Table 6 High Growth Case Scenario
Table 7 Global Electric scooter rentals Revenue (USD Million) And CAGR (%) By Type (2018-2030)
Table 8 Global Electric scooter rentals Revenue (USD Million) And CAGR (%) By Applications (2018-2030)
Table 9 Global Electric scooter rentals Revenue (USD Million) And CAGR (%) By Regions (2018-2030)
Table 10 Global Electric scooter rentals Revenue (USD Million) By Type (2018-2022)
Table 11 Global Electric scooter rentals Revenue Market Share (%) By Type (2018-2022)
Table 12 Global Electric scooter rentals Revenue (USD Million) By Applications (2018-2022)
Table 13 Global Electric scooter rentals Revenue Market Share (%) By Applications (2018-2022)
Table 14 Global Electric scooter rentals Market Revenue (USD Million) By Regions (2018-2022)
Table 15 Global Electric scooter rentals Market Share (%) By Regions (2018-2022)
Table 16 North America Electric scooter rentals Revenue (USD Million) By Country (2018-2022)
Table 17 North America Electric scooter rentals Revenue (USD Million) By Type (2018-2022)
Table 18 North America Electric scooter rentals Revenue (USD Million) By Applications (2018-2022)
Table 19 Europe Electric scooter rentals Revenue (USD Million) By Country (2018-2022)
Table 20 Europe Electric scooter rentals Revenue (USD Million) By Type (2018-2022)
Table 21 Europe Electric scooter rentals Revenue (USD Million) By Applications (2018-2022)
Table 22 Asia Pacific Electric scooter rentals Revenue (USD Million) By Country (2018-2022)
Table 23 Asia Pacific Electric scooter rentals Revenue (USD Million) By Type (2018-2022)
Table 24 Asia Pacific Electric scooter rentals Revenue (USD Million) By Applications (2018-2022)
Table 25 South America Electric scooter rentals Revenue (USD Million) By Country (2018-2022)
Table 26 South America Electric scooter rentals Revenue (USD Million) By Type (2018-2022)
Table 27 South America Electric scooter rentals Revenue (USD Million) By Applications (2018-2022)
Table 28 Middle East and Africa Electric scooter rentals Revenue (USD Million) By Region (2018-2022)
Table 29 Middle East and Africa Electric scooter rentals Revenue (USD Million) By Type (2018-2022)
Table 30 Middle East and Africa Electric scooter rentals Revenue (USD Million) By Applications (2018-2022)
Table 31 Financial Analysis
Table 32 Global Electric scooter rentals Revenue (USD Million) By Type (2023-2030)
Table 33 Global Electric scooter rentals Revenue Market Share (%) By Type (2023-2030)
Table 34 Global Electric scooter rentals Revenue (USD Million) By Applications (2023-2030)
Table 35 Global Electric scooter rentals Revenue Market Share (%) By Applications (2023-2030)
Table 36 Global Electric scooter rentals Market Revenue (USD Million), And Revenue (USD Million) By Regions (2023-2030)
Table 37 North America Electric scooter rentals Revenue (USD)By Country (2023-2030)
Table 38 North America Electric scooter rentals Revenue (USD Million) By Type (2023-2030)
Table 39 North America Electric scooter rentals Revenue (USD Million) By Applications (2023-2030)
Table 40 Europe Electric scooter rentals Revenue (USD Million) By Country (2023-2030)
Table 41 Europe Electric scooter rentals Revenue (USD Million) By Type (2023-2030)
Table 42 Europe Electric scooter rentals Revenue (USD Million) By Applications (2023-2030)
Table 43 Asia Pacific Electric scooter rentals Revenue (USD Million) By Country (2023-2030)
Table 44 Asia Pacific Electric scooter rentals Revenue (USD Million) By Type (2023-2030)
Table 45 Asia Pacific Electric scooter rentals Revenue (USD Million) By Applications (2023-2030)
Table 46 South America Electric scooter rentals Revenue (USD Million) By Country (2023-2030)
Table 47 South America Electric scooter rentals Revenue (USD Million) By Type (2023-2030)
Table 48 South America Electric scooter rentals Revenue (USD Million) By Applications (2023-2030)
Table 49 Middle East and Africa Electric scooter rentals Revenue (USD Million) By Region (2023-2030)
Table 50 Middle East and Africa Electric scooter rentals Revenue (USD Million) By Region (2023-2030)
Table 51 Middle East and Africa Electric scooter rentals Revenue (USD Million) By Type (2023-2030)
Table 52 Middle East and Africa Electric scooter rentals Revenue (USD Million) By Applications (2023-2030)
Table 53 Research Programs/Design for This Report
Table 54 Key Data Information from Secondary Sources
Table 55 Key Data Information from Primary Sources
List of Figures
Figure 1 Market Scope
Figure 2 Porter’s Five Forces
Figure 3 Global Electric scooter rentals Revenue (USD Million) By Type (2018-2022)
Figure 4 Global Electric scooter rentals Revenue Market Share (%) By Type (2022)
Figure 5 Global Electric scooter rentals Revenue (USD Million) By Applications (2018-2022)
Figure 6 Global Electric scooter rentals Revenue Market Share (%) By Applications (2022)
Figure 7 Global Electric scooter rentals Market Revenue (USD Million) By Regions (2018-2022)
Figure 8 Global Electric scooter rentals Market Share (%) By Regions (2022)
Figure 9 North America Electric scooter rentals Revenue (USD Million) By Country (2018-2022)
Figure 10 North America Electric scooter rentals Revenue (USD Million) By Type (2018-2022)
Figure 11 North America Electric scooter rentals Revenue (USD Million) By Applications (2018-2022)
Figure 12 Europe Electric scooter rentals Revenue (USD Million) By Country (2018-2022)
Figure 13 Europe Electric scooter rentals Revenue (USD Million) By Type (2018-2022)
Figure 14 Europe Electric scooter rentals Revenue (USD Million) By Applications (2018-2022)
Figure 15 Asia Pacific Electric scooter rentals Revenue (USD Million) By Country (2018-2022)
Figure 16 Asia Pacific Electric scooter rentals Revenue (USD Million) By Type (2018-2022)
Figure 17 Asia Pacific Electric scooter rentals Revenue (USD Million) By Applications (2018-2022)
Figure 18 South America Electric scooter rentals Revenue (USD Million) By Country (2018-2022)
Figure 19 South America Electric scooter rentals Revenue (USD Million) By Type (2018-2022)
Figure 20 South America Electric scooter rentals Revenue (USD Million) By Applications (2018-2022)
Figure 21 Middle East and Africa Electric scooter rentals Revenue (USD Million) By Region (2018-2022)
Figure 22 Middle East and Africa Electric scooter rentals Revenue (USD Million) By Type (2018-2022)
Figure 23 Middle East and Africa Electric scooter rentals Revenue (USD Million) By Applications (2018-2022)
Figure 24 Global Electric scooter rentals Revenue (USD Million) By Type (2023-2030)
Figure 25 Global Electric scooter rentals Revenue Market Share (%) By Type (2030)
Figure 26 Global Electric scooter rentals Revenue (USD Million) By Applications (2023-2030)
Figure 27 Global Electric scooter rentals Revenue Market Share (%) By Applications (2030)
Figure 28 Global Electric scooter rentals Market Revenue (USD Million) By Regions (2023-2030)
Figure 29 North America Electric scooter rentals Revenue (USD Million) By Country (2023-2030)
Figure 30 North America Electric scooter rentals Revenue (USD Million) By Type (2023-2030)
Figure 31 North America Electric scooter rentals Revenue (USD Million) By Applications (2023-2030)
Figure 32 Europe Electric scooter rentals Revenue (USD Million) By Country (2023-2030)
Figure 33 Europe Electric scooter rentals Revenue (USD Million) By Type (2023-2030)
Figure 34 Europe Electric scooter rentals Revenue (USD Million) By Applications (2023-2030)
Figure 35 Asia Pacific Electric scooter rentals Revenue (USD Million) By Country (2023-2030)
Figure 36 Asia Pacific Electric scooter rentals Revenue (USD Million) By Type (2023-2030)
Figure 37 Asia Pacific Electric scooter rentals Revenue (USD Million) By Applications (2023-2030)
Figure 38 South America Electric scooter rentals Revenue (USD Million) By Country (2023-2030)
Figure 39 South America Electric scooter rentals Revenue (USD Million) By Type (2023-2030)
Figure 40 South America Electric scooter rentals Revenue (USD Million) By Applications (2023-2030)
Figure 41 Middle East and Africa Electric scooter rentals Revenue (USD Million) By Region (2023-2030)
Figure 42 Middle East and Africa Electric scooter rentals Revenue (USD Million) By Region (2023-2030)
Figure 43 Middle East and Africa Electric scooter rentals Revenue (USD Million) By Type (2023-2030)
Figure 44 Middle East and Africa Electric scooter rentals Revenue (USD Million) By Applications (2023-2030)
Figure 45 Bottom-Up and Top-Down Approaches For This Report
Figure 46 Data Triangulation
