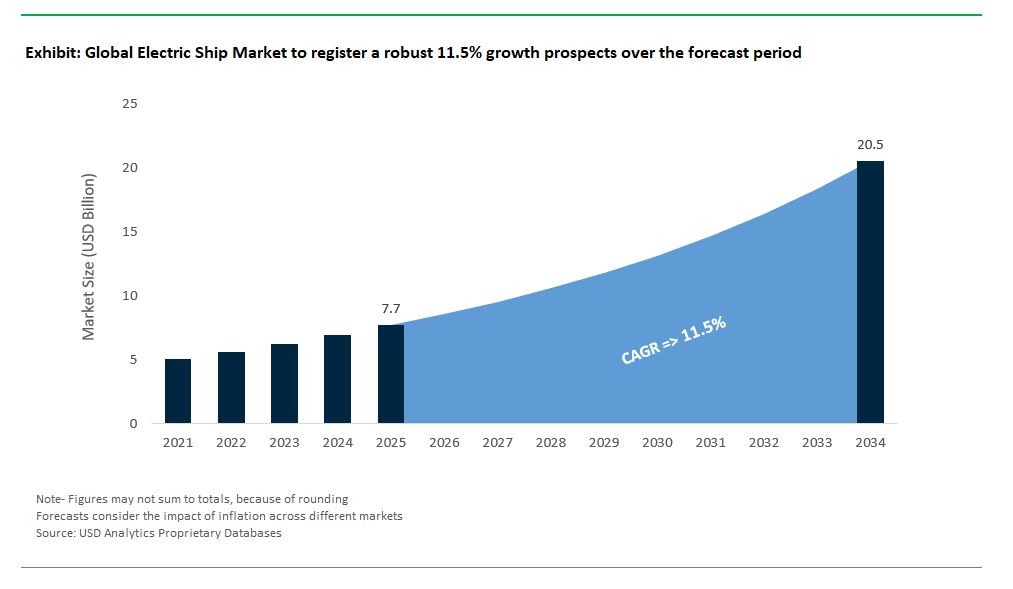
The Global Electric Ship Market Size is estimated at $7.7 Billion in 2025 and is forecast to register an annual growth rate (CAGR) of 11.5% to reach $20.5 Billion by 2034.
The global Electric Ship Market Study analyzes and forecasts the market size across 6 regions and 24 countries for diverse segments -By Power Output (Below 75 kW, 75 kW to 745kW, 745 kW to 7,560 kW, Above 7,560 kW), By Power Source (Fully Electric, Hybrid), By Type (Semi-Autonomous, Fully Autonomous), By Vessel (Commercial vessel, Defense vessel, Special vessel).
An Introduction to Electric Ship Market in 2025
The electric ship market is gaining momentum as the maritime industry explores sustainable alternatives to traditional diesel-powered vessels. With increasing concerns over environmental impact and regulatory pressures, the shift towards electric propulsion systems offers a promising solution for reducing greenhouse gas emissions and enhancing fuel efficiency. Electric ships, including ferries, cargo vessels, and recreational boats, are benefiting from advancements in battery technology, electric drive systems, and renewable energy integration. The market is driven by the need for greener shipping solutions and the potential for significant cost savings in fuel and maintenance. As the technology matures and infrastructure develops, the electric ship market is poised for substantial growth, reflecting a broader trend towards sustainability in the maritime sector.
Electric Ship Competitive Landscape
The market report analyses the leading companies in the industry including Baltic Workboats AS, Boesch Motorboote AG, Bureau Veritas SA, Canadian Electric Boat Company, Corvus Energy Ltd, Duffy Electric Boat Company, Electrovaya Inc, General Dynamics Electric Boat Corp, Kongsberg Gruppen ASA, Triton Submarines LLC, Vard Group AS, Yara International ASA, and others.
Electric Ship Market Dynamics
Market Trend: Advancements in Battery Technology and Electrification
A prominent trend in the electric ship market is the advancement in battery technology and electrification. As the maritime industry seeks to reduce its carbon footprint and comply with stringent environmental regulations, there is a growing focus on developing and deploying electric and hybrid propulsion systems. Advances in battery technology, such as improved energy density, faster charging capabilities, and longer life cycles, are driving the adoption of electric ships. Innovations in energy storage and management systems are enhancing the feasibility and efficiency of electric marine vessels, making them increasingly viable for commercial and passenger use. This trend underscores a significant shift towards sustainable and eco-friendly maritime transportation solutions.
Market Driver: Increasing Environmental Regulations and Emission Reduction Targets
Increasing environmental regulations and emission reduction targets are key drivers of the electric ship market. Governments and international bodies are implementing stricter regulations to curb emissions from the shipping industry, which is a significant contributor to global pollution. In response, shipbuilders and operators are investing in electric and hybrid technologies to meet these regulatory requirements and achieve sustainability goals. The drive towards cleaner energy sources and reduced greenhouse gas emissions is accelerating the development and deployment of electric ships, creating a robust market for innovative propulsion solutions that comply with evolving environmental standards.
Market Opportunity: Development of Charging Infrastructure and Support Services
An opportunity in the electric ship market lies in the development of charging infrastructure and support services. As the adoption of electric ships grows, there will be an increasing need for specialized charging facilities, maintenance services, and operational support tailored to electric marine vessels. Developing infrastructure such as shore-based charging stations, port facilities equipped for electric ships, and service centers for maintenance and repair presents a significant growth opportunity. By investing in these support services and infrastructure, companies can address the operational needs of electric ship operators and enhance the overall adoption and effectiveness of electric marine technologies.
Electric Ship Market Share Analysis: 745 kW to 7,560 kW generated the highest revenue in 2024
In the Electric Ship Market, the segment representing power output ranging from 745 kW to 7,560 kW is the largest. This range encompasses a broad spectrum of ship sizes and applications, making it a key area of focus for electric ship manufacturers. Vessels within this power output bracket include medium to large commercial and specialized ships, which require significant power for propulsion and onboard systems. The dominance of this segment is attributed to the growing trend of electrification in the maritime industry, where mid-range power requirements are typical for transitioning existing vessels to electric or hybrid propulsion systems. The extensive applications and the need for efficient and scalable power solutions in this range drive its leadership in the market.
Electric Ship Market Share Analysis: Hybrid is poised to register the fastest CAGR over the forecast period
In the Electric Ship Market, the hybrid power source segment is the fastest growing. Hybrid systems, which combine electric propulsion with traditional fuel sources, offer a flexible and efficient solution for modern shipping needs. This growth is fueled by the hybrid technology's ability to reduce emissions, improve fuel efficiency, and provide operational flexibility. Hybrid systems are increasingly favored for their lower environmental impact and the ability to optimize energy use based on operational conditions. The rapid adoption of hybrid solutions reflects the industry's shift towards more sustainable and adaptable power sources, driving the segment's rapid expansion compared to fully electric systems, which are still evolving in terms of infrastructure and technology.
Electric Ship Market Share Analysis: Semi-Autonomous generated the highest revenue in 2024
In the Electric Ship Market, the semi-autonomous segment is the largest. Semi-autonomous ships, which offer a blend of automated and manual operation, cater to a wide range of commercial and operational needs. These vessels provide significant advantages in terms of operational efficiency and safety while still allowing for human oversight. The semi-autonomous category appeals to the maritime industry due to its balance of advanced automation and the practicality of human intervention, making it a preferred choice for many ship operators. The large number of vessels adopting semi-autonomous technologies, coupled with regulatory approvals and technological advancements, establishes this segment as the leading type in the electric ship market.
Electric Ship Market Share Analysis: Commercial Vessel is poised to register the fastest CAGR over the forecast period
In the Electric Ship Market, the commercial vessel segment is the fastest growing. This growth is driven by the increasing demand for electric and hybrid solutions in the commercial shipping sector, where operational efficiency, cost savings, and environmental regulations are key considerations. Commercial vessels, including cargo ships and ferries, are rapidly adopting electric propulsion to meet stringent emissions standards and capitalize on fuel savings. The shift towards electrification in commercial shipping is accelerating due to technological advancements, government incentives, and the growing emphasis on sustainable practices. This segment's rapid expansion reflects the broader trend of electrification in commercial maritime operations, making it the fastest-growing vessel type in the electric ship market.
Electric Ship Market Report Scope
|
Parameter
|
Details
|
|
Market Size (2025)
|
$ 7.7 Billion
|
|
Market Size (2034)
|
$ 20.5 Billion
|
|
Market Growth Rate
|
11.5%
|
|
Segments
|
By Power Output (Below 75 kW, 75 kW to 745kW, 745 kW to 7,560 kW, Above 7,560 kW), By Power Source (Fully Electric, Hybrid), By Type (Semi-Autonomous, Fully Autonomous), By Vessel (Commercial vessel, Defense vessel, Special vessel)
|
|
Study Period
|
2019- 2024 and 2025-2034
|
|
Units
|
Revenue (USD)
|
|
Qualitative Analysis
|
Porter’s Five Forces, SWOT Profile, Market Share, Scenario Forecasts, Market Ecosystem, Company Ranking, Market Dynamics, Industry Benchmarking
|
|
Companies
|
Baltic Workboats AS, Boesch Motorboote AG, Bureau Veritas SA, Canadian Electric Boat Company, Corvus Energy Ltd, Duffy Electric Boat Company, Electrovaya Inc, General Dynamics Electric Boat Corp, Kongsberg Gruppen ASA, Triton Submarines LLC, Vard Group AS, Yara International ASA
|
|
Countries
|
US, Canada, Mexico, Germany, France, Spain, Italy, UK, Russia, China, India, Japan, South Korea, Australia, South East Asia, Brazil, Argentina, Middle East, Africa
|
Electric Ship Market Segmentation
By Power Output
Below 75 kW
75 kW to 745kW
745 kW to 7,560 kW
Above 7,560 kW
By Power Source
Fully Electric
Hybrid
By Type
Semi-Autonomous
Fully Autonomous
By Vessel
Commercial vessel
Defense vessel
Special vessel
Countries Analyzed
North America (US, Canada, Mexico)
Europe (Germany, UK, France, Spain, Italy, Russia, Rest of Europe)
Asia Pacific (China, India, Japan, South Korea, Australia, South East Asia, Rest of Asia)
South America (Brazil, Argentina, Rest of South America)
Middle East and Africa (Saudi Arabia, UAE, Rest of Middle East, South Africa, Egypt, Rest of Africa)
Electric Ship Companies Profiled in the Study
Baltic Workboats AS
Boesch Motorboote AG
Bureau Veritas SA
Canadian Electric Boat Company
Corvus Energy Ltd
Duffy Electric Boat Company
Electrovaya Inc
General Dynamics Electric Boat Corp
Kongsberg Gruppen ASA
Triton Submarines LLC
Vard Group AS
Yara International ASA
*- List Not Exhaustive
About USD Analytics
Table of Contents
List of Charts and Exhibits
List of Tables
1. Executive Summary
What’s New in 2025?
Top 10 Takeaways from the industry
Potential Opportunities for Industry Stakeholders
Strategic Imperatives
Company Market Positioning
Industry Benchmarking Matrix
2. Research Scope and Methodology
Market Definition
Market Segments
Companies Profiled
Research Methodology
Bottom-Up Method
Top-Down Method
Data Triangulation
Forecast Methodology
Data Sources
USDA Proprietary Databases
External Sources
Primary Research and Interviews
Conversion Rates for USD
Abbreviations
3. Strategic Landscape: Key Insights and Implications
Spotlight: Key Strategies opted by Business Leaders
Competitive Landscape
Market Size ($ Million) and Share (%) by Company, 2024
SWOT Analysis
- Key Market Strengths
- Key Market Weaknesses
- Potential Opportunities
- Potential Threats
Porter’s Five Force Analysis
- Summary
- Bargaining Power of Buyers- Impact Analysis
- Bargaining Power of Suppliers- Impact Analysis
- Threat of new entrants- Impact Analysis
- Intensity of Competitive Rivalry- Impact Analysis
Macro-Environmental Analysis
- Economic forecasts by Country, 2010- 2035
- Population forecasts by Country, 2010- 2035
- Inflation Outlook by Country, 2010-2035
- Impact of Russia-Ukraine Conflict, Sluggish China Growth, US Developments
5. Growth Opportunity Analysis
Trends at a Glance
- What are the most noteworthy trends in the market
- Where should leaders pay attention?
- What industries are likely to be affected by the growth?
Market Dynamics
- Charting a path forward
- Growth Drivers
- Growth Barriers
Key Industry Stakeholders
- Suppliers
- Manufacturers and Service Providers
- Distribution Channels
- End-Users and Applications
- Regulators
- Investors, Traders, and R&D Institutes
Regulatory Landscape
6. Market Size Outlook to 2034
Global Nanocoatings Market Size Forecast, USD Million, 2018- 2034
- Historic Market Size, 2018- 2024
- Forecast Market Size, 2024- 2034
Scenario Analysis
- Low Growth Scenario: Definition and Outlook to 2034
- Reference Case: Definition and Outlook to 2034
- High Growth Scenario: Definition and Outlook to 2034
Pricing Analysis and Outlook
- Nanocoatings Average Price Forecast, 2021- 2034
- Key Factors Shaping the Pricing Patterns
7. Historical Nanocoatings Market Size by Segments, 2018- 2024
Key Statistics, 2024
Nanocoatings Market Size Outlook by Type, USD Million, 2018- 2024
Growth Comparison (y-o-y) across Nanocoatings Types, 2018- 2024
Nanocoatings Market Size Outlook by Application, USD Million, 2018- 2024
Growth Comparison (y-o-y) across Nanocoatings Applications, 2018- 2024
8. Nanocoatings Market Size Outlook by Segments, 2024- 2034
By Power Output
Below 75 kW
75 kW to 745kW
745 kW to 7,560 kW
Above 7,560 kW
By Power Source
Fully Electric
Hybrid
By Type
Semi-Autonomous
Fully Autonomous
By Vessel
Commercial vessel
Defense vessel
Special vessel
9. Nanocoatings Market Size Outlook by Region
North America
Key Market Dynamics
North America Nanocoatings Market Size Outlook by Type, USD Million, 2021-2034
North America Nanocoatings Market Size Outlook by Application, USD Million, 2021-2034
North America Nanocoatings Market Size Outlook by Sales Channel, USD Million, 2021-2034
North America Nanocoatings Market Size Outlook by Country, USD Million, 2021-2034
Europe
Key Market Dynamics
Europe Nanocoatings Market Size Outlook by Type, USD Million, 2021-2034
Europe Nanocoatings Market Size Outlook by Application, USD Million, 2021-2034
Europe Nanocoatings Market Size Outlook by Sales Channel, USD Million, 2021-2034
Europe Nanocoatings Market Size Outlook by Country, USD Million, 2021-2034
Asia Pacific
Key Market Dynamics
Asia Pacific Nanocoatings Market Size Outlook by Type, USD Million, 2021-2034
Asia Pacific Nanocoatings Market Size Outlook by Application, USD Million, 2021-2034
Asia Pacific Nanocoatings Market Size Outlook by Sales Channel, USD Million, 2021-2034
Asia Pacific Nanocoatings Market Size Outlook by Country, USD Million, 2021-2034
South America
Key Market Dynamics
South America Nanocoatings Market Size Outlook by Type, USD Million, 2021-2034
South America Nanocoatings Market Size Outlook by Application, USD Million, 2021-2034
South America Nanocoatings Market Size Outlook by Sales Channel, USD Million, 2021-2034
South America Nanocoatings Market Size Outlook by Country, USD Million, 2021-2034
Middle East and Africa
Key Market Dynamics
Middle East and Africa Nanocoatings Market Size Outlook by Type, USD Million, 2021-2034
Middle East and Africa Nanocoatings Market Size Outlook by Application, USD Million, 2021-2034
Middle East and Africa Nanocoatings Market Size Outlook by Sales Channel, USD Million, 2021-2034
Middle East and Africa Nanocoatings Market Size Outlook by Country, USD Million, 2021-2034
10. United States Nanocoatings Market Analysis and Outlook, 2021- 2034
Key Statistics
United States Nanocoatings Market Size Outlook by Type, 2021- 2034
United States Nanocoatings Market Size Outlook by Application, 2021- 2034
United States Nanocoatings Market Size Outlook by End-User, 2021- 2034
11. Canada Nanocoatings Market Analysis and Outlook, 2021- 2034
Key Statistics
Canada Nanocoatings Market Size Outlook by Type, 2021- 2034
Canada Nanocoatings Market Size Outlook by Application, 2021- 2034
Canada Nanocoatings Market Size Outlook by End-User, 2021- 2034
12. Mexico Nanocoatings Market Analysis and Outlook, 2021- 2034
Key Statistics
Mexico Nanocoatings Market Size Outlook by Type, 2021- 2034
Mexico Nanocoatings Market Size Outlook by Application, 2021- 2034
Mexico Nanocoatings Market Size Outlook by End-User, 2021- 2034
13. Germany Nanocoatings Market Analysis and Outlook, 2021- 2034
Key Statistics
Germany Nanocoatings Market Size Outlook by Type, 2021- 2034
Germany Nanocoatings Market Size Outlook by Application, 2021- 2034
Germany Nanocoatings Market Size Outlook by End-User, 2021- 2034
14. France Nanocoatings Market Analysis and Outlook, 2021- 2034
Key Statistics
France Nanocoatings Market Size Outlook by Type, 2021- 2034
France Nanocoatings Market Size Outlook by Application, 2021- 2034
France Nanocoatings Market Size Outlook by End-User, 2021- 2034
15. United Kingdom Nanocoatings Market Analysis and Outlook, 2021- 2034
Key Statistics
United Kingdom Nanocoatings Market Size Outlook by Type, 2021- 2034
United Kingdom Nanocoatings Market Size Outlook by Application, 2021- 2034
United Kingdom Nanocoatings Market Size Outlook by End-User, 2021- 2034
16. Spain Nanocoatings Market Analysis and Outlook, 2021- 2034
Key Statistics
Spain Nanocoatings Market Size Outlook by Type, 2021- 2034
Spain Nanocoatings Market Size Outlook by Application, 2021- 2034
Spain Nanocoatings Market Size Outlook by End-User, 2021- 2034
17. Italy Nanocoatings Market Analysis and Outlook, 2021- 2034
Key Statistics
Italy Nanocoatings Market Size Outlook by Type, 2021- 2034
Italy Nanocoatings Market Size Outlook by Application, 2021- 2034
Italy Nanocoatings Market Size Outlook by End-User, 2021- 2034
18. Benelux Nanocoatings Market Analysis and Outlook, 2021- 2034
Key Statistics
Benelux Nanocoatings Market Size Outlook by Type, 2021- 2034
Benelux Nanocoatings Market Size Outlook by Application, 2021- 2034
Benelux Nanocoatings Market Size Outlook by End-User, 2021- 2034
19. Nordic Nanocoatings Market Analysis and Outlook, 2021- 2034
Key Statistics
Nordic Nanocoatings Market Size Outlook by Type, 2021- 2034
Nordic Nanocoatings Market Size Outlook by Application, 2021- 2034
Nordic Nanocoatings Market Size Outlook by End-User, 2021- 2034
20. Rest of Europe Nanocoatings Market Analysis and Outlook, 2021- 2034
Key Statistics
Rest of Europe Nanocoatings Market Size Outlook by Type, 2021- 2034
Rest of Europe Nanocoatings Market Size Outlook by Application, 2021- 2034
Rest of Europe Nanocoatings Market Size Outlook by End-User, 2021- 2034
21. China Nanocoatings Market Analysis and Outlook, 2021- 2034
Key Statistics
China Nanocoatings Market Size Outlook by Type, 2021- 2034
China Nanocoatings Market Size Outlook by Application, 2021- 2034
China Nanocoatings Market Size Outlook by End-User, 2021- 2034
22. India Nanocoatings Market Analysis and Outlook, 2021- 2034
Key Statistics
India Nanocoatings Market Size Outlook by Type, 2021- 2034
India Nanocoatings Market Size Outlook by Application, 2021- 2034
India Nanocoatings Market Size Outlook by End-User, 2021- 2034
23. Japan Nanocoatings Market Analysis and Outlook, 2021- 2034
Key Statistics
Japan Nanocoatings Market Size Outlook by Type, 2021- 2034
Japan Nanocoatings Market Size Outlook by Application, 2021- 2034
Japan Nanocoatings Market Size Outlook by End-User, 2021- 2034
24. South Korea Nanocoatings Market Analysis and Outlook, 2021- 2034
Key Statistics
South Korea Nanocoatings Market Size Outlook by Type, 2021- 2034
South Korea Nanocoatings Market Size Outlook by Application, 2021- 2034
South Korea Nanocoatings Market Size Outlook by End-User, 2021- 2034
25. Australia Nanocoatings Market Analysis and Outlook, 2021- 2034
Key Statistics
Australia Nanocoatings Market Size Outlook by Type, 2021- 2034
Australia Nanocoatings Market Size Outlook by Application, 2021- 2034
Australia Nanocoatings Market Size Outlook by End-User, 2021- 2034
26. South East Asia Nanocoatings Market Analysis and Outlook, 2021- 2034
Key Statistics
South East Asia Nanocoatings Market Size Outlook by Type, 2021- 2034
South East Asia Nanocoatings Market Size Outlook by Application, 2021- 2034
South East Asia Nanocoatings Market Size Outlook by End-User, 2021- 2034
27. Rest of Asia Pacific Nanocoatings Market Analysis and Outlook, 2021- 2034
Key Statistics
Rest of Asia Pacific Nanocoatings Market Size Outlook by Type, 2021- 2034
Rest of Asia Pacific Nanocoatings Market Size Outlook by Application, 2021- 2034
Rest of Asia Pacific Nanocoatings Market Size Outlook by End-User, 2021- 2034
28. Brazil Nanocoatings Market Analysis and Outlook, 2021- 2034
Key Statistics
Brazil Nanocoatings Market Size Outlook by Type, 2021- 2034
Brazil Nanocoatings Market Size Outlook by Application, 2021- 2034
Brazil Nanocoatings Market Size Outlook by End-User, 2021- 2034
29. Argentina Nanocoatings Market Analysis and Outlook, 2021- 2034
Key Statistics
Argentina Nanocoatings Market Size Outlook by Type, 2021- 2034
Argentina Nanocoatings Market Size Outlook by Application, 2021- 2034
Argentina Nanocoatings Market Size Outlook by End-User, 2021- 2034
30. Rest of South America Nanocoatings Market Analysis and Outlook, 2021- 2034
Key Statistics
Rest of South America Nanocoatings Market Size Outlook by Type, 2021- 2034
Rest of South America Nanocoatings Market Size Outlook by Application, 2021- 2034
Rest of South America Nanocoatings Market Size Outlook by End-User, 2021- 2034
31. United Arab Emirates Nanocoatings Market Analysis and Outlook, 2021- 2034
Key Statistics
United Arab Emirates Nanocoatings Market Size Outlook by Type, 2021- 2034
United Arab Emirates Nanocoatings Market Size Outlook by Application, 2021- 2034
United Arab Emirates Nanocoatings Market Size Outlook by End-User, 2021- 2034
32. Saudi Arabia Nanocoatings Market Analysis and Outlook, 2021- 2034
Key Statistics
Saudi Arabia Nanocoatings Market Size Outlook by Type, 2021- 2034
Saudi Arabia Nanocoatings Market Size Outlook by Application, 2021- 2034
Saudi Arabia Nanocoatings Market Size Outlook by End-User, 2021- 2034
33. Rest of Middle East Nanocoatings Market Analysis and Outlook, 2021- 2034
Key Statistics
Rest of Middle East Nanocoatings Market Size Outlook by Type, 2021- 2034
Rest of Middle East Nanocoatings Market Size Outlook by Application, 2021- 2034
Rest of Middle East Nanocoatings Market Size Outlook by End-User, 2021- 2034
34. South Africa Nanocoatings Market Analysis and Outlook, 2021- 2034
Key Statistics
South Africa Nanocoatings Market Size Outlook by Type, 2021- 2034
South Africa Nanocoatings Market Size Outlook by Application, 2021- 2034
South Africa Nanocoatings Market Size Outlook by End-User, 2021- 2034
35. Rest of Africa Nanocoatings Market Analysis and Outlook, 2021- 2034
Key Statistics
Rest of Africa Nanocoatings Market Size Outlook by Type, 2021- 2034
Rest of Africa Nanocoatings Market Size Outlook by Application, 2021- 2034
Rest of Africa Nanocoatings Market Size Outlook by End-User, 2021- 2034
36. Key Companies
Market Share Analysis
Baltic Workboats AS
Boesch Motorboote AG
Bureau Veritas SA
Canadian Electric Boat Company
Corvus Energy Ltd
Duffy Electric Boat Company
Electrovaya Inc
General Dynamics Electric Boat Corp
Kongsberg Gruppen ASA
Triton Submarines LLC
Vard Group AS
Yara International ASA
Company Benchmarking
Financial Analysis
37. Recent Market Developments
38. Appendix
Looking Ahead
Research Methodology
Legal Disclaimer
