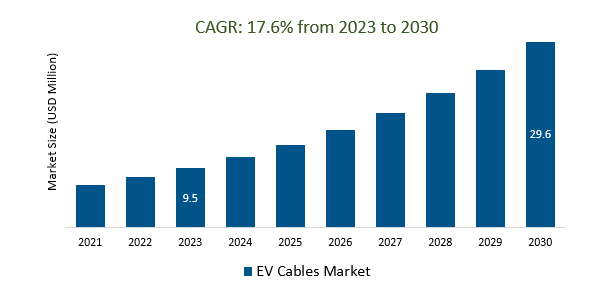
The global Electric Vehicle (EV) cable market Size is estimated to be US$ 9.5 Billion in 2023 and is poised to register 17.6% growth over the forecast period from 2023 to 2030 to reach US $ 29.6 billion in 2030.
The Electric Vehicle (EV) cable market is driven by various factors, including rising EV adoption, government incentives, environmental regulations, advancements in EV technology, expanding charging infrastructure, and growing awareness of climate change. High-power charging cables, wireless charging, smart charging cables, lightweight and flexible materials, and global standardization are driving the demand for EV cables. The market is also influenced by the increasing popularity of electric vehicles, the need for charging infrastructure, and the growing awareness of the benefits of electric vehicles. The demand for EV cables is driven by the increasing popularity of electric vehicles, government incentives, environmental regulations, and advancements in EV technology. The market is also influenced by the increasing demand for sustainable materials, increased investments, increased competition, and global market expansion.
The Soaring Demand for EV Cables in the Age of Rising Electric Vehicle Adoption is boosting the market.
The increasing popularity and adoption of electric vehicles (EVs) have led to a significant surge in demand for EV cables. These specialized cables are essential components in the EV charging infrastructure, serving as the lifeline that connects power sources to the vehicles. As more consumers and businesses transition to electric transportation to reduce their carbon footprint and dependence on fossil fuels, the EV cables market is experiencing remarkable growth. The rapid expansion of the EV market has prompted investments in charging stations and infrastructure development, further propelling the demand for high-quality and efficient EV cables. Manufacturers are innovating to produce cables that can handle high power levels, offer fast charging capabilities, and ensure safety. This burgeoning market not only reflects the global shift towards sustainable transportation but also presents opportunities for technological advancements and market expansion in the electric mobility sector. As governments worldwide implement stricter emissions regulations and incentives for EV adoption, the growth of the EV cables market is expected to continue its upward trajectory.
The Rise of High-Power Charging Cables for Faster Electric Vehicle Charging is creating a demand in the market.
The rapid adoption of electric vehicles (EVs) has ushered in a growing demand for high-power charging cables, revolutionizing the EV cables market. These advanced cables are designed to facilitate faster charging, addressing one of the key concerns of EV owners - charging time. As EV manufacturers continue to push for greater charging speeds, high-power cables are becoming indispensable infrastructure. They enable EV owners to charge their vehicles more quickly, making EVs more practical and accessible for daily use. This trend is not only driving innovation in cable technology but also bolstering the overall EV ecosystem, further accelerating the transition to sustainable transportation.
Lightweight and Flexible Cables for Enhanced Convenience is attracting a wide customer base.
The EV cable market is experiencing a significant surge in popularity due to the introduction of lightweight and flexible cable solutions. These innovative cables not only offer enhanced convenience but also address the evolving needs of electric vehicle owners. Their lightweight nature makes them easier to handle and store, while their flexibility allows for easier manoeuvrability during charging. This combination of attributes has attracted a wide customer base, including both individual EV owners and commercial charging station operators. As the demand for electric vehicles continues to grow, the adoption of these lightweight and flexible cables is expected to play a pivotal role in shaping the future of EV charging infrastructure.
Market Share Analysis:
High-voltage cables have emerged as the predominant choice within the rapidly evolving electric vehicle (EV) cables market.
The cables are designed to efficiently transmit the substantial electrical power required for modern electric vehicles, enabling them to deliver impressive performance and range. Their robust construction ensures they can withstand the demands of high voltage systems, providing reliability and safety for EV owners. One key advantage of high-voltage cables is their ability to minimize energy loss during power transmission, enhancing overall vehicle efficiency. Manufacturers are continually innovating to produce high-quality, durable cables that meet stringent industry standards. As EV adoption continues to surge worldwide, the demand for these high-voltage cables is set to grow exponentially, driving further advancements in EV technology and contributing to a sustainable future of transportation.
Battery Electric Vehicles (BEVs) have established themselves as the unrivaled leaders in the electric vehicle (EV) cable market.
The surging popularity is attributed to their eco-friendly operation and ever-improving range capabilities. BEVs have effectively eclipsed other EV types, such as plug-in hybrids and hydrogen fuel cell vehicles, owing to their zero-emission status and lower operational costs. The demand for specialized EV charging cables has surged in tandem with the proliferation of BEVs. These cables are designed to efficiently transmit electricity from charging stations to BEV batteries, ensuring swift and safe charging experiences. With advancements in charging technology and infrastructure, the market for BEV-related cables continues to expand rapidly, reflecting the remarkable growth of the BEV industry itself. In the quest for a greener future, BEVs and their associated cables are at the forefront of transportation innovation.
Charging Management stands as the undisputed leader within the thriving domain of the EV Cables Market.
The pivotal role in facilitating the seamless and efficient recharging of electric vehicles has catapulted it to the forefront. As the demand for electric mobility skyrockets, Charging Management assumes paramount importance in orchestrating a well-organized and reliable charging infrastructure. Its ability to optimize charging times, manage power distribution, and enhance user experience cements its dominance. Moreover, Charging Management systems play a crucial role in supporting various charging standards and protocols, ensuring compatibility across a wide range of electric vehicles. This adaptability further solidifies its position as the cornerstone of the industry, fostering the widespread adoption of electric vehicles. With innovation driving the development of smarter and more advanced charging solutions, the influence of Charging Management is set to expand even further, driving the evolution of the EV Cables Market.
Wire is the most dominant component in the EV cables market.
Wire serves as the backbone of the burgeoning electric vehicle (EV) cables market, underpinning the entire infrastructure of these eco-friendly automobiles. Its pivotal role lies in facilitating the seamless flow of electricity from the charging station to the vehicle's battery, enabling efficient and rapid charging. As EV adoption continues to surge globally, the demand for high-quality, durable, and conductive wires has reached unprecedented levels. Manufacturers are engaged in constant innovation to enhance wire technology, striving to create lightweight yet robust cables that can withstand the rigors of daily EV usage. Copper and aluminium, renowned for their conductivity, are the preferred materials, ensuring minimal energy loss during transmission. This dominance of wire in the EV cables market underscores its critical role in advancing the electric mobility revolution, with continual advancements driving increased performance, safety, and sustainability in the automotive industry.
Electric Vehicle (EV) Cable Market Segmentation
Type
- Low Voltage
- Medium Voltage
- High Voltage
Vehicle
Application
- Engine and Powertrain
- Battery and Battery Management
- Charging Management
- Power Electronics
- Motor Cables
- Others
Components
- Wire
- Connectors
- Fuse
- Others
By Region
- North America (United States, Canada, Mexico)
- Europe (Germany, France, United Kingdom, Spain, Italy, Others)
- Asia Pacific (China, India, Japan, South Korea, Australia, Others)
- Latin America (Brazil, Argentina, Others)
- Middle East and Africa (Saudi Arabia, UAE, Kuwait, Other Middle East, South Africa, Nigeria, Other Africa)
Some of the major players operating in this market include:
- Leoni AG
- Huber+Suhner
- Sumitomo Electric Industries Ltd
- APTIV
- Nexans
- TE Connectivity
- Eland Cables
- Acome
- Elkem
- Coroplast
- Champlaian Cable Corp
- Sinbon Electronics
- Philatron Wire and Cable
*List not exhaustive
Electric Vehicle Cable Market Outlook 2023
1 Market Overview
1.1 Introduction to the Electric Vehicle Cable Market
1.2 Scope of the Study
1.3 Research Objective
1.3.1 Key Market Scope and Segments
1.3.2 Players Covered
1.3.3 Years Considered
2 Executive Summary
2.1 2023 Electric Vehicle Cable Industry- Market Statistics
3 Market Dynamics
3.1 Market Drivers
3.2 Market Challenges
3.3 Market Opportunities
3.4 Market Trends
4 Market Factor Analysis
4.1 Porter’s Five Forces
4.2 Market Entropy
4.2.1 Global Electric Vehicle Cable Market Companies with Area Served
4.2.2 Products Offerings Global Electric Vehicle Cable Market
5 COVID-19 Impact Analysis and Outlook Scenarios
5.1.1 Covid-19 Impact Analysis
5.1.2 Post-COVID-19 Scenario- Low Growth Case
5.1.3 Post-COVID-19 Scenario- Reference Growth Case
5.1.4 Post-COVID-19 Scenario- Low Growth Case
6 Global Electric Vehicle Cable Market Trends
6.1 Global Electric Vehicle Cable Revenue (USD Million) and CAGR (%) by Type (2018-2030)
6.2 Global Electric Vehicle Cable Revenue (USD Million) and CAGR (%) by Applications (2018-2030)
6.3 Global Electric Vehicle Cable Revenue (USD Million) and CAGR (%) by Regions (2018-2030)
7 Global Electric Vehicle Cable Market Revenue (USD Million) by Type, and Applications (2018-2022)
7.1 Global Electric Vehicle Cable Revenue (USD Million) by Type (2018-2022)
7.1.1 Global Electric Vehicle Cable Revenue (USD Million), Market Share (%) by Type (2018-2022)
7.2 Global Electric Vehicle Cable Revenue (USD Million) by Applications (2018-2022)
7.2.1 Global Electric Vehicle Cable Revenue (USD Million), Market Share (%) by Applications (2018-2022)
8 Global Electric Vehicle Cable Development Regional Status and Outlook
8.1 Global Electric Vehicle Cable Revenue (USD Million) By Regions (2018-2022)
8.2 North America Electric Vehicle Cable Revenue (USD Million) by Type, and Application (2018-2022)
8.2.1 North America Electric Vehicle Cable Revenue (USD Million) by Country (2018-2022)
8.2.2 North America Electric Vehicle Cable Revenue (USD Million) by Type (2018-2022)
8.2.3 North America Electric Vehicle Cable Revenue (USD Million) by Applications (2018-2022)
8.3 Europe Electric Vehicle Cable Revenue (USD Million), by Type, and Applications (USD Million) (2018-2022)
8.3.1 Europe Electric Vehicle Cable Revenue (USD Million), by Country (2018-2022)
8.3.2 Europe Electric Vehicle Cable Revenue (USD Million) by Type (2018-2022)
8.3.3 Europe Electric Vehicle Cable Revenue (USD Million) by Applications (2018-2022)
8.4 Asia Pacific Electric Vehicle Cable Revenue (USD Million), and Revenue (USD Million) by Type, and Applications (2018-2022)
8.4.1 Asia Pacific Electric Vehicle Cable Revenue (USD Million) by Country (2018-2022)
8.4.2 Asia Pacific Electric Vehicle Cable Revenue (USD Million) by Type (2018-2022)
8.4.3 Asia Pacific Electric Vehicle Cable Revenue (USD Million) by Applications (2018-2022)
8.5 South America Electric Vehicle Cable Revenue (USD Million), by Type, and Applications (2018-2022)
8.5.1 South America Electric Vehicle Cable Revenue (USD Million), by Country (2018-2022)
8.5.2 South America Electric Vehicle Cable Revenue (USD Million) by Type (2018-2022)
8.5.3 South America Electric Vehicle Cable Revenue (USD Million) by Applications (2018-2022)
8.6 Middle East and Africa Electric Vehicle Cable Revenue (USD Million), by Type, Technology, Application, Thickness (2018-2022)
8.6.1 Middle East and Africa Electric Vehicle Cable Revenue (USD Million) by Country (2018-2022)
8.6.2 Middle East and Africa Electric Vehicle Cable Revenue (USD Million) by Type (2018-2022)
8.6.3 Middle East and Africa Electric Vehicle Cable Revenue (USD Million) by Applications (2018-2022)
9 Company Profiles
10 Global Electric Vehicle Cable Market Revenue (USD Million), by Type, and Applications (2023-2030)
10.1 Global Electric Vehicle Cable Revenue (USD Million) and Market Share (%) by Type (2023-2030)
10.1.1 Global Electric Vehicle Cable Revenue (USD Million), and Market Share (%) by Type (2023-2030)
10.2 Global Electric Vehicle Cable Revenue (USD Million) and Market Share (%) by Applications (2023-2030)
10.2.1 Global Electric Vehicle Cable Revenue (USD Million), and Market Share (%) by Applications (2023-2030)
11 Global Electric Vehicle Cable Development Regional Status and Outlook Forecast
11.1 Global Electric Vehicle Cable Revenue (USD Million) By Regions (2023-2030)
11.2 North America Electric Vehicle Cable Revenue (USD Million) by Type, and Applications (2023-2030)
11.2.1 North America Electric Vehicle Cable Revenue (USD) Million by Country (2023-2030)
11.2.2 North America Electric Vehicle Cable Revenue (USD Million), by Type (2023-2030)
11.2.3 North America Electric Vehicle Cable Revenue (USD Million), Market Share (%) by Applications (2023-2030)
11.3 Europe Electric Vehicle Cable Revenue (USD Million), by Type, and Applications (2023-2030)
11.3.1 Europe Electric Vehicle Cable Revenue (USD Million), by Country (2023-2030)
11.3.2 Europe Electric Vehicle Cable Revenue (USD Million), by Type (2023-2030)
11.3.3 Europe Electric Vehicle Cable Revenue (USD Million), by Applications (2023-2030)
11.4 Asia Pacific Electric Vehicle Cable Revenue (USD Million) by Type, and Applications (2023-2030)
11.4.1 Asia Pacific Electric Vehicle Cable Revenue (USD Million), by Country (2023-2030)
11.4.2 Asia Pacific Electric Vehicle Cable Revenue (USD Million), by Type (2023-2030)
11.4.3 Asia Pacific Electric Vehicle Cable Revenue (USD Million), by Applications (2023-2030)
11.5 South America Electric Vehicle Cable Revenue (USD Million), by Type, and Applications (2023-2030)
11.5.1 South America Electric Vehicle Cable Revenue (USD Million), by Country (2023-2030)
11.5.2 South America Electric Vehicle Cable Revenue (USD Million), by Type (2023-2030)
11.5.3 South America Electric Vehicle Cable Revenue (USD Million), by Applications (2023-2030)
11.6 Middle East and Africa Electric Vehicle Cable Revenue (USD Million), by Type, and Applications (2023-2030)
11.6.1 Middle East and Africa Electric Vehicle Cable Revenue (USD Million), by Region (2023-2030)
11.6.2 Middle East and Africa Electric Vehicle Cable Revenue (USD Million), by Type (2023-2030)
11.6.3 Middle East and Africa Electric Vehicle Cable Revenue (USD Million), by Applications (2023-2030)
12 Methodology and Data Sources
12.1 Methodology/Research Approach
12.1.1 Research Programs/Design
12.1.2 Market Size Estimation
12.1.3 Market Breakdown and Data Triangulation
12.2 Data Sources
12.2.1 Secondary Sources
12.2.2 Primary Sources
12.3 Disclaimer
List of Tables
Table 1 Market Segmentation Analysis
Table 2 Global Electric Vehicle Cable Market Companies with Areas Served
Table 3 Products Offerings Global Electric Vehicle Cable Market
Table 4 Low Growth Scenario Forecasts
Table 5 Reference Case Growth Scenario
Table 6 High Growth Case Scenario
Table 7 Global Electric Vehicle Cable Revenue (USD Million) And CAGR (%) By Type (2018-2030)
Table 8 Global Electric Vehicle Cable Revenue (USD Million) And CAGR (%) By Applications (2018-2030)
Table 9 Global Electric Vehicle Cable Revenue (USD Million) And CAGR (%) By Regions (2018-2030)
Table 10 Global Electric Vehicle Cable Revenue (USD Million) By Type (2018-2022)
Table 11 Global Electric Vehicle Cable Revenue Market Share (%) By Type (2018-2022)
Table 12 Global Electric Vehicle Cable Revenue (USD Million) By Applications (2018-2022)
Table 13 Global Electric Vehicle Cable Revenue Market Share (%) By Applications (2018-2022)
Table 14 Global Electric Vehicle Cable Market Revenue (USD Million) By Regions (2018-2022)
Table 15 Global Electric Vehicle Cable Market Share (%) By Regions (2018-2022)
Table 16 North America Electric Vehicle Cable Revenue (USD Million) By Country (2018-2022)
Table 17 North America Electric Vehicle Cable Revenue (USD Million) By Type (2018-2022)
Table 18 North America Electric Vehicle Cable Revenue (USD Million) By Applications (2018-2022)
Table 19 Europe Electric Vehicle Cable Revenue (USD Million) By Country (2018-2022)
Table 20 Europe Electric Vehicle Cable Revenue (USD Million) By Type (2018-2022)
Table 21 Europe Electric Vehicle Cable Revenue (USD Million) By Applications (2018-2022)
Table 22 Asia Pacific Electric Vehicle Cable Revenue (USD Million) By Country (2018-2022)
Table 23 Asia Pacific Electric Vehicle Cable Revenue (USD Million) By Type (2018-2022)
Table 24 Asia Pacific Electric Vehicle Cable Revenue (USD Million) By Applications (2018-2022)
Table 25 South America Electric Vehicle Cable Revenue (USD Million) By Country (2018-2022)
Table 26 South America Electric Vehicle Cable Revenue (USD Million) By Type (2018-2022)
Table 27 South America Electric Vehicle Cable Revenue (USD Million) By Applications (2018-2022)
Table 28 Middle East and Africa Electric Vehicle Cable Revenue (USD Million) By Region (2018-2022)
Table 29 Middle East and Africa Electric Vehicle Cable Revenue (USD Million) By Type (2018-2022)
Table 30 Middle East and Africa Electric Vehicle Cable Revenue (USD Million) By Applications (2018-2022)
Table 31 Financial Analysis
Table 32 Global Electric Vehicle Cable Revenue (USD Million) By Type (2023-2030)
Table 33 Global Electric Vehicle Cable Revenue Market Share (%) By Type (2023-2030)
Table 34 Global Electric Vehicle Cable Revenue (USD Million) By Applications (2023-2030)
Table 35 Global Electric Vehicle Cable Revenue Market Share (%) By Applications (2023-2030)
Table 36 Global Electric Vehicle Cable Market Revenue (USD Million), And Revenue (USD Million) By Regions (2023-2030)
Table 37 North America Electric Vehicle Cable Revenue (USD)By Country (2023-2030)
Table 38 North America Electric Vehicle Cable Revenue (USD Million) By Type (2023-2030)
Table 39 North America Electric Vehicle Cable Revenue (USD Million) By Applications (2023-2030)
Table 40 Europe Electric Vehicle Cable Revenue (USD Million) By Country (2023-2030)
Table 41 Europe Electric Vehicle Cable Revenue (USD Million) By Type (2023-2030)
Table 42 Europe Electric Vehicle Cable Revenue (USD Million) By Applications (2023-2030)
Table 43 Asia Pacific Electric Vehicle Cable Revenue (USD Million) By Country (2023-2030)
Table 44 Asia Pacific Electric Vehicle Cable Revenue (USD Million) By Type (2023-2030)
Table 45 Asia Pacific Electric Vehicle Cable Revenue (USD Million) By Applications (2023-2030)
Table 46 South America Electric Vehicle Cable Revenue (USD Million) By Country (2023-2030)
Table 47 South America Electric Vehicle Cable Revenue (USD Million) By Type (2023-2030)
Table 48 South America Electric Vehicle Cable Revenue (USD Million) By Applications (2023-2030)
Table 49 Middle East and Africa Electric Vehicle Cable Revenue (USD Million) By Region (2023-2030)
Table 50 Middle East and Africa Electric Vehicle Cable Revenue (USD Million) By Region (2023-2030)
Table 51 Middle East and Africa Electric Vehicle Cable Revenue (USD Million) By Type (2023-2030)
Table 52 Middle East and Africa Electric Vehicle Cable Revenue (USD Million) By Applications (2023-2030)
Table 53 Research Programs/Design for This Report
Table 54 Key Data Information from Secondary Sources
Table 55 Key Data Information from Primary Sources
List of Figures
Figure 1 Market Scope
Figure 2 Porter’s Five Forces
Figure 3 Global Electric Vehicle Cable Revenue (USD Million) By Type (2018-2022)
Figure 4 Global Electric Vehicle Cable Revenue Market Share (%) By Type (2022)
Figure 5 Global Electric Vehicle Cable Revenue (USD Million) By Applications (2018-2022)
Figure 6 Global Electric Vehicle Cable Revenue Market Share (%) By Applications (2022)
Figure 7 Global Electric Vehicle Cable Market Revenue (USD Million) By Regions (2018-2022)
Figure 8 Global Electric Vehicle Cable Market Share (%) By Regions (2022)
Figure 9 North America Electric Vehicle Cable Revenue (USD Million) By Country (2018-2022)
Figure 10 North America Electric Vehicle Cable Revenue (USD Million) By Type (2018-2022)
Figure 11 North America Electric Vehicle Cable Revenue (USD Million) By Applications (2018-2022)
Figure 12 Europe Electric Vehicle Cable Revenue (USD Million) By Country (2018-2022)
Figure 13 Europe Electric Vehicle Cable Revenue (USD Million) By Type (2018-2022)
Figure 14 Europe Electric Vehicle Cable Revenue (USD Million) By Applications (2018-2022)
Figure 15 Asia Pacific Electric Vehicle Cable Revenue (USD Million) By Country (2018-2022)
Figure 16 Asia Pacific Electric Vehicle Cable Revenue (USD Million) By Type (2018-2022)
Figure 17 Asia Pacific Electric Vehicle Cable Revenue (USD Million) By Applications (2018-2022)
Figure 18 South America Electric Vehicle Cable Revenue (USD Million) By Country (2018-2022)
Figure 19 South America Electric Vehicle Cable Revenue (USD Million) By Type (2018-2022)
Figure 20 South America Electric Vehicle Cable Revenue (USD Million) By Applications (2018-2022)
Figure 21 Middle East and Africa Electric Vehicle Cable Revenue (USD Million) By Region (2018-2022)
Figure 22 Middle East and Africa Electric Vehicle Cable Revenue (USD Million) By Type (2018-2022)
Figure 23 Middle East and Africa Electric Vehicle Cable Revenue (USD Million) By Applications (2018-2022)
Figure 24 Global Electric Vehicle Cable Revenue (USD Million) By Type (2023-2030)
Figure 25 Global Electric Vehicle Cable Revenue Market Share (%) By Type (2030)
Figure 26 Global Electric Vehicle Cable Revenue (USD Million) By Applications (2023-2030)
Figure 27 Global Electric Vehicle Cable Revenue Market Share (%) By Applications (2030)
Figure 28 Global Electric Vehicle Cable Market Revenue (USD Million) By Regions (2023-2030)
Figure 29 North America Electric Vehicle Cable Revenue (USD Million) By Country (2023-2030)
Figure 30 North America Electric Vehicle Cable Revenue (USD Million) By Type (2023-2030)
Figure 31 North America Electric Vehicle Cable Revenue (USD Million) By Applications (2023-2030)
Figure 32 Europe Electric Vehicle Cable Revenue (USD Million) By Country (2023-2030)
Figure 33 Europe Electric Vehicle Cable Revenue (USD Million) By Type (2023-2030)
Figure 34 Europe Electric Vehicle Cable Revenue (USD Million) By Applications (2023-2030)
Figure 35 Asia Pacific Electric Vehicle Cable Revenue (USD Million) By Country (2023-2030)
Figure 36 Asia Pacific Electric Vehicle Cable Revenue (USD Million) By Type (2023-2030)
Figure 37 Asia Pacific Electric Vehicle Cable Revenue (USD Million) By Applications (2023-2030)
Figure 38 South America Electric Vehicle Cable Revenue (USD Million) By Country (2023-2030)
Figure 39 South America Electric Vehicle Cable Revenue (USD Million) By Type (2023-2030)
Figure 40 South America Electric Vehicle Cable Revenue (USD Million) By Applications (2023-2030)
Figure 41 Middle East and Africa Electric Vehicle Cable Revenue (USD Million) By Region (2023-2030)
Figure 42 Middle East and Africa Electric Vehicle Cable Revenue (USD Million) By Region (2023-2030)
Figure 43 Middle East and Africa Electric Vehicle Cable Revenue (USD Million) By Type (2023-2030)
Figure 44 Middle East and Africa Electric Vehicle Cable Revenue (USD Million) By Applications (2023-2030)
Figure 45 Bottom-Up and Top-Down Approaches For This Report
Figure 46 Data Triangulation
