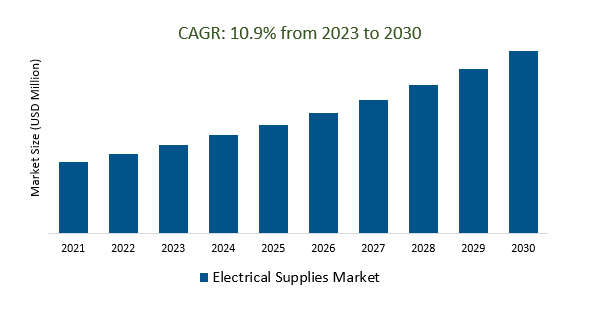
The Global Electrical Supplies Market Size is estimated to register 10.9% growth over the forecast period from 2023 to 2030.
The market growth is driven by the increasing adoption of renewable energy sources like solar and wind power has led to a growing demand for electrical components and equipment, including inverters, cables, and connectors. Leading companies that are focused on Renewable Energy Integration, Electrification of Transportation, Smart Grid Expansion, Electrical Supplies for Data Centers, Infrastructure Development, and others to boost market shares in the industry.
Market Overview
The Electrical Supplies Market includes a wide range of products used in electrical systems across various sectors. Key drivers of this market are rapid urbanization, a focus on energy efficiency and renewable energy, electrification of transportation and industrial processes, smart technology integration, and the growth of data centers. Challenges include supply chain disruptions, evolving technology, regulatory changes, competition, and sustainability concerns. Notable global trends include the rise of e-commerce platforms, IoT integration, and the increasing importance of energy storage solutions.
Market Dynamics
Market Trends - Powering the Future of Manufacturing
Powering the Future of Manufacturing in the Electrical Supplies Market refers to the integration of advanced technologies like automation, Industry 4.0 practices, and sustainable energy sources to enhance manufacturing processes and create more efficient, environmentally friendly, and competitive electrical supply products. This transformation aims to meet the growing demand for energy-efficient, smart, and eco-friendly electrical solutions while optimizing production and supply chain operations for manufacturers in the industry.
Market Driver- Data Centers Demand Electrical Supplies Market
The demand for data centers is a key driver of the Electrical Supplies Market, as these facilities require various electrical components such as PDUs, UPS systems, cooling solutions, and wiring to ensure reliable and efficient operations. With the ongoing growth in data usage and storage needs driven by cloud computing and digital services, the demand for electrical supplies for data centers is expected to continue to rise.
Market Opportunity-Introduction of Industrial Automation
Industrial automation is revolutionizing the Electrical Supplies Market by integrating advanced technologies like robotics, AI, and IIoT to enhance manufacturing efficiency, reduce costs, and improve product quality. This transformative shift is reshaping how electrical supplies are designed and produced, making the industry more competitive and aligned with modern market demands and sustainability requirements.
Market Share Analysis- Cables Electrical Supplies Market will register the Significant growth
The Global Electrical Supplies Market is analyzed across Cables, Lighting, Wiring Accessories, Circuit Protection, Switchgear, Heating, Fire and Security Systems, and others. Cables are poised to register significant growth. Cables are integral to the Electrical Supplies Market, serving as vital conduits for electrical power and data transmission across diverse applications in residential, commercial, industrial, and infrastructure contexts. They enable connectivity, data transfer, and efficient power distribution, driven by factors like infrastructure growth and technological advancements in an interconnected world, shaping the demand for cables in the market.
Market Share Analysis- Customer Mix of Electrical Wholesalers held a significant market share in 2023
The Global Electrical Supplies Market is analyzed across various applications including Customer Mix of Electrical Wholesalers, Review of Electrical Contracting, Facilities Management, Panel Builders, and others. Of these, Customer Mix of Electrical Wholesalers held a significant market share in 2023. Electrical wholesalers in the Electrical Supplies Market cater to a diverse customer mix, including electrical contractors, construction firms, industrial manufacturers, utilities, retailers, government entities, and individual consumers, offering a wide array of electrical products to meet the varied needs across residential, commercial, and industrial sectors.
Electrical Supplies Market Segmentation
By Type
- Cables
- Lighting
- Wiring Accessories
- Circuit Protection
- Switchgear
- Heating
- Fire & Security Systems
- Others
By Application
- Customer Mix of Electrical Wholesalers
- Review of the Electrical Contracting
- Facilities Management
- Panel Builders
By Region
- North America (United States, Canada, Mexico)
- Europe (Germany, France, United Kingdom, Spain, Italy, Others)
- Asia Pacific (China, India, Japan, South Korea, Australia, Others)
- Latin America (Brazil, Argentina, Others)
- Middle East and Africa (Saudi Arabia, UAE, Kuwait, Other Middle East, South Africa, Nigeria, Other Africa)
Electrical Supplies Market Companies
- WESCO International
- Rexel Holdings USA
- Anixter International Inc.
- Border States Electric
- Crescent Electric Supply Company
- Graybar
- TLC Electrical Supplies
- Edmundson Electrical
- Kew Electrical
- Lincs Electrical Wholesalers
- Screwfix
- Eyre & Elliston
*List not exhaustive
Electrical Supplies Market Outlook 2023
1 Market Overview
1.1 Introduction to the Electrical Supplies Market
1.2 Scope of the Study
1.3 Research Objective
1.3.1 Key Market Scope and Segments
1.3.2 Players Covered
1.3.3 Years Considered
2 Executive Summary
2.1 2023 Electrical Supplies Industry- Market Statistics
3 Market Dynamics
3.1 Market Drivers
3.2 Market Challenges
3.3 Market Opportunities
3.4 Market Trends
4 Market Factor Analysis
4.1 Porter’s Five Forces
4.2 Market Entropy
4.2.1 Global Electrical Supplies Market Companies with Area Served
4.2.2 Products Offerings Global Electrical Supplies Market
5 COVID-19 Impact Analysis and Outlook Scenarios
5.1.1 Covid-19 Impact Analysis
5.1.2 post-COVID-19 Scenario- Low Growth Case
5.1.3 post-COVID-19 Scenario- Reference Growth Case
5.1.4 post-COVID-19 Scenario- Low Growth Case
6 Global Electrical Supplies Market Trends
6.1 Global Electrical Supplies Revenue (USD Million) and CAGR (%) by Type (2018-2030)
6.2 Global Electrical Supplies Revenue (USD Million) and CAGR (%) by Applications (2018-2030)
6.3 Global Electrical Supplies Revenue (USD Million) and CAGR (%) by regions (2018-2030)
7 Global Electrical Supplies Market Revenue (USD Million) by Type, and Applications (2018-2022)
7.1 Global Electrical Supplies Revenue (USD Million) by Type (2018-2022)
7.1.1 Global Electrical Supplies Revenue (USD Million), Market Share (%) by Type (2018-2022)
7.2 Global Electrical Supplies Revenue (USD Million) by Applications (2018-2022)
7.2.1 Global Electrical Supplies Revenue (USD Million), Market Share (%) by Applications (2018-2022)
8 Global Electrical Supplies Development Regional Status and Outlook
8.1 Global Electrical Supplies Revenue (USD Million) By Regions (2018-2022)
8.2 North America Electrical Supplies Revenue (USD Million) by Type, and Application (2018-2022)
8.2.1 North America Electrical Supplies Revenue (USD Million) by Country (2018-2022)
8.2.2 North America Electrical Supplies Revenue (USD Million) by Type (2018-2022)
8.2.3 North America Electrical Supplies Revenue (USD Million) by Applications (2018-2022)
8.3 Europe Electrical Supplies Revenue (USD Million), by Type, and Applications (USD Million) (2018-2022)
8.3.1 Europe Electrical Supplies Revenue (USD Million), by Country (2018-2022)
8.3.2 Europe Electrical Supplies Revenue (USD Million) by Type (2018-2022)
8.3.3 Europe Electrical Supplies Revenue (USD Million) by Applications (2018-2022)
8.4 Asia Pacific Electrical Supplies Revenue (USD Million), and Revenue (USD Million) by Type, and Applications (2018-2022)
8.4.1 Asia Pacific Electrical Supplies Revenue (USD Million) by Country (2018-2022)
8.4.2 Asia Pacific Electrical Supplies Revenue (USD Million) by Type (2018-2022)
8.4.3 Asia Pacific Electrical Supplies Revenue (USD Million) by Applications (2018-2022)
8.5 South America Electrical Supplies Revenue (USD Million), by Type, and Applications (2018-2022)
8.5.1 South America Electrical Supplies Revenue (USD Million), by Country (2018-2022)
8.5.2 South America Electrical Supplies Revenue (USD Million) by Type (2018-2022)
8.5.3 South America Electrical Supplies Revenue (USD Million) by Applications (2018-2022)
8.6 Middle East and Africa Electrical Supplies Revenue (USD Million), by Type, Technology, Application, Thickness (2018-2022)
8.6.1 Middle East and Africa Electrical Supplies Revenue (USD Million) by Country (2018-2022)
8.6.2 Middle East and Africa Electrical Supplies Revenue (USD Million) by Type (2018-2022)
8.6.3 Middle East and Africa Electrical Supplies Revenue (USD Million) by Applications (2018-2022)
9 Company Profiles
10 Global Electrical Supplies Market Revenue (USD Million), by Type, and Applications (2023-2030)
10.1 Global Electrical Supplies Revenue (USD Million) and Market Share (%) by Type (2023-2030)
10.1.1 Global Electrical Supplies Revenue (USD Million), and Market Share (%) by Type (2023-2030)
10.2 Global Electrical Supplies Revenue (USD Million) and Market Share (%) by Applications (2023-2030)
10.2.1 Global Electrical Supplies Revenue (USD Million), and Market Share (%) by Applications (2023-2030)
11 Global Electrical Supplies Development Regional Status and Outlook Forecast
11.1 Global Electrical Supplies Revenue (USD Million) By Regions (2023-2030)
11.2 North America Electrical Supplies Revenue (USD Million) by Type, and Applications (2023-2030)
11.2.1 North America Electrical Supplies Revenue (USD) Million by Country (2023-2030)
11.2.2 North America Electrical Supplies Revenue (USD Million), by Type (2023-2030)
11.2.3 North America Electrical Supplies Revenue (USD Million), Market Share (%) by Applications (2023-2030)
11.3 Europe Electrical Supplies Revenue (USD Million), by Type, and Applications (2023-2030)
11.3.1 Europe Electrical Supplies Revenue (USD Million), by Country (2023-2030)
11.3.2 Europe Electrical Supplies Revenue (USD Million), by Type (2023-2030)
11.3.3 Europe Electrical Supplies Revenue (USD Million), by Applications (2023-2030)
11.4 Asia Pacific Electrical Supplies Revenue (USD Million) by Type, and Applications (2023-2030)
11.4.1 Asia Pacific Electrical Supplies Revenue (USD Million), by Country (2023-2030)
11.4.2 Asia Pacific Electrical Supplies Revenue (USD Million), by Type (2023-2030)
11.4.3 Asia Pacific Electrical Supplies Revenue (USD Million), by Applications (2023-2030)
11.5 South America Electrical Supplies Revenue (USD Million), by Type, and Applications (2023-2030)
11.5.1 South America Electrical Supplies Revenue (USD Million), by Country (2023-2030)
11.5.2 South America Electrical Supplies Revenue (USD Million), by Type (2023-2030)
11.5.3 South America Electrical Supplies Revenue (USD Million), by Applications (2023-2030)
11.6 Middle East and Africa Electrical Supplies Revenue (USD Million), by Type, and Applications (2023-2030)
11.6.1 Middle East and Africa Electrical Supplies Revenue (USD Million), by region (2023-2030)
11.6.2 Middle East and Africa Electrical Supplies Revenue (USD Million), by Type (2023-2030)
11.6.3 Middle East and Africa Electrical Supplies Revenue (USD Million), by Applications (2023-2030)
12 Methodology and Data Sources
12.1 Methodology/Research Approach
12.1.1 Research Programs/Design
12.1.2 Market Size Estimation
12.1.3 Market Breakdown and Data Triangulation
12.2 Data Sources
12.2.1 Secondary Sources
12.2.2 Primary Sources
12.3 Disclaimer
List of Tables
Table 1 Market Segmentation Analysis
Table 2 Global Electrical Supplies Market Companies with Areas Served
Table 3 Products Offerings Global Electrical Supplies Market
Table 4 Low Growth Scenario Forecasts
Table 5 Reference Case Growth Scenario
Table 6 High Growth Case Scenario
Table 7 Global Electrical Supplies Revenue (USD Million) And CAGR (%) By Type (2018-2030)
Table 8 Global Electrical Supplies Revenue (USD Million) And CAGR (%) By Applications (2018-2030)
Table 9 Global Electrical Supplies Revenue (USD Million) And CAGR (%) By Regions (2018-2030)
Table 10 Global Electrical Supplies Revenue (USD Million) By Type (2018-2022)
Table 11 Global Electrical Supplies Revenue Market Share (%) By Type (2018-2022)
Table 12 Global Electrical Supplies Revenue (USD Million) By Applications (2018-2022)
Table 13 Global Electrical Supplies Revenue Market Share (%) By Applications (2018-2022)
Table 14 Global Electrical Supplies Market Revenue (USD Million) By Regions (2018-2022)
Table 15 Global Electrical Supplies Market Share (%) By Regions (2018-2022)
Table 16 North America Electrical Supplies Revenue (USD Million) By Country (2018-2022)
Table 17 North America Electrical Supplies Revenue (USD Million) By Type (2018-2022)
Table 18 North America Electrical Supplies Revenue (USD Million) By Applications (2018-2022)
Table 19 Europe Electrical Supplies Revenue (USD Million) By Country (2018-2022)
Table 20 Europe Electrical Supplies Revenue (USD Million) By Type (2018-2022)
Table 21 Europe Electrical Supplies Revenue (USD Million) By Applications (2018-2022)
Table 22 Asia Pacific Electrical Supplies Revenue (USD Million) By Country (2018-2022)
Table 23 Asia Pacific Electrical Supplies Revenue (USD Million) By Type (2018-2022)
Table 24 Asia Pacific Electrical Supplies Revenue (USD Million) By Applications (2018-2022)
Table 25 South America Electrical Supplies Revenue (USD Million) By Country (2018-2022)
Table 26 South America Electrical Supplies Revenue (USD Million) By Type (2018-2022)
Table 27 South America Electrical Supplies Revenue (USD Million) By Applications (2018-2022)
Table 28 Middle East and Africa Electrical Supplies Revenue (USD Million) By Region (2018-2022)
Table 29 Middle East and Africa Electrical Supplies Revenue (USD Million) By Type (2018-2022)
Table 30 Middle East and Africa Electrical Supplies Revenue (USD Million) By Applications (2018-2022)
Table 31 Financial Analysis
Table 32 Global Electrical Supplies Revenue (USD Million) By Type (2023-2030)
Table 33 Global Electrical Supplies Revenue Market Share (%) By Type (2023-2030)
Table 34 Global Electrical Supplies Revenue (USD Million) By Applications (2023-2030)
Table 35 Global Electrical Supplies Revenue Market Share (%) By Applications (2023-2030)
Table 36 Global Electrical Supplies Market Revenue (USD Million), And Revenue (USD Million) By Regions (2023-2030)
Table 37 North America Electrical Supplies Revenue (USD)By Country (2023-2030)
Table 38 North America Electrical Supplies Revenue (USD Million) By Type (2023-2030)
Table 39 North America Electrical Supplies Revenue (USD Million) By Applications (2023-2030)
Table 40 Europe Electrical Supplies Revenue (USD Million) By Country (2023-2030)
Table 41 Europe Electrical Supplies Revenue (USD Million) By Type (2023-2030)
Table 42 Europe Electrical Supplies Revenue (USD Million) By Applications (2023-2030)
Table 43 Asia Pacific Electrical Supplies Revenue (USD Million) By Country (2023-2030)
Table 44 Asia Pacific Electrical Supplies Revenue (USD Million) By Type (2023-2030)
Table 45 Asia Pacific Electrical Supplies Revenue (USD Million) By Applications (2023-2030)
Table 46 South America Electrical Supplies Revenue (USD Million) By Country (2023-2030)
Table 47 South America Electrical Supplies Revenue (USD Million) By Type (2023-2030)
Table 48 South America Electrical Supplies Revenue (USD Million) By Applications (2023-2030)
Table 49 Middle East and Africa Electrical Supplies Revenue (USD Million) By Region (2023-2030)
Table 50 Middle East and Africa Electrical Supplies Revenue (USD Million) By Region (2023-2030)
Table 51 Middle East and Africa Electrical Supplies Revenue (USD Million) By Type (2023-2030)
Table 52 Middle East and Africa Electrical Supplies Revenue (USD Million) By Applications (2023-2030)
Table 53 Research Programs/Design for This Report
Table 54 Key Data Information from Secondary Sources
Table 55 Key Data Information from Primary Sources
List of Figures
Figure 1 Market Scope
Figure 2 Porter’s Five Forces
Figure 3 Global Electrical Supplies Revenue (USD Million) By Type (2018-2022)
Figure 4 Global Electrical Supplies Revenue Market Share (%) By Type (2022)
Figure 5 Global Electrical Supplies Revenue (USD Million) By Applications (2018-2022)
Figure 6 Global Electrical Supplies Revenue Market Share (%) By Applications (2022)
Figure 7 Global Electrical Supplies Market Revenue (USD Million) By Regions (2018-2022)
Figure 8 Global Electrical Supplies Market Share (%) By Regions (2022)
Figure 9 North America Electrical Supplies Revenue (USD Million) By Country (2018-2022)
Figure 10 North America Electrical Supplies Revenue (USD Million) By Type (2018-2022)
Figure 11 North America Electrical Supplies Revenue (USD Million) By Applications (2018-2022)
Figure 12 Europe Electrical Supplies Revenue (USD Million) By Country (2018-2022)
Figure 13 Europe Electrical Supplies Revenue (USD Million) By Type (2018-2022)
Figure 14 Europe Electrical Supplies Revenue (USD Million) By Applications (2018-2022)
Figure 15 Asia Pacific Electrical Supplies Revenue (USD Million) By Country (2018-2022)
Figure 16 Asia Pacific Electrical Supplies Revenue (USD Million) By Type (2018-2022)
Figure 17 Asia Pacific Electrical Supplies Revenue (USD Million) By Applications (2018-2022)
Figure 18 South America Electrical Supplies Revenue (USD Million) By Country (2018-2022)
Figure 19 South America Electrical Supplies Revenue (USD Million) By Type (2018-2022)
Figure 20 South America Electrical Supplies Revenue (USD Million) By Applications (2018-2022)
Figure 21 Middle East and Africa Electrical Supplies Revenue (USD Million) By Region (2018-2022)
Figure 22 Middle East and Africa Electrical Supplies Revenue (USD Million) By Type (2018-2022)
Figure 23 Middle East and Africa Electrical Supplies Revenue (USD Million) By Applications (2018-2022)
Figure 24 Global Electrical Supplies Revenue (USD Million) By Type (2023-2030)
Figure 25 Global Electrical Supplies Revenue Market Share (%) By Type (2030)
Figure 26 Global Electrical Supplies Revenue (USD Million) By Applications (2023-2030)
Figure 27 Global Electrical Supplies Revenue Market Share (%) By Applications (2030)
Figure 28 Global Electrical Supplies Market Revenue (USD Million) By Regions (2023-2030)
Figure 29 North America Electrical Supplies Revenue (USD Million) By Country (2023-2030)
Figure 30 North America Electrical Supplies Revenue (USD Million) By Type (2023-2030)
Figure 31 North America Electrical Supplies Revenue (USD Million) By Applications (2023-2030)
Figure 32 Europe Electrical Supplies Revenue (USD Million) By Country (2023-2030)
Figure 33 Europe Electrical Supplies Revenue (USD Million) By Type (2023-2030)
Figure 34 Europe Electrical Supplies Revenue (USD Million) By Applications (2023-2030)
Figure 35 Asia Pacific Electrical Supplies Revenue (USD Million) By Country (2023-2030)
Figure 36 Asia Pacific Electrical Supplies Revenue (USD Million) By Type (2023-2030)
Figure 37 Asia Pacific Electrical Supplies Revenue (USD Million) By Applications (2023-2030)
Figure 38 South America Electrical Supplies Revenue (USD Million) By Country (2023-2030)
Figure 39 South America Electrical Supplies Revenue (USD Million) By Type (2023-2030)
Figure 40 South America Electrical Supplies Revenue (USD Million) By Applications (2023-2030)
Figure 41 Middle East and Africa Electrical Supplies Revenue (USD Million) By Region (2023-2030)
Figure 42 Middle East and Africa Electrical Supplies Revenue (USD Million) By Region (2023-2030)
Figure 43 Middle East and Africa Electrical Supplies Revenue (USD Million) By Type (2023-2030)
Figure 44 Middle East and Africa Electrical Supplies Revenue (USD Million) By Applications (2023-2030)
Figure 45 Bottom-Up and Top-Down Approaches for This Report
Figure 46 Data Triangulation
