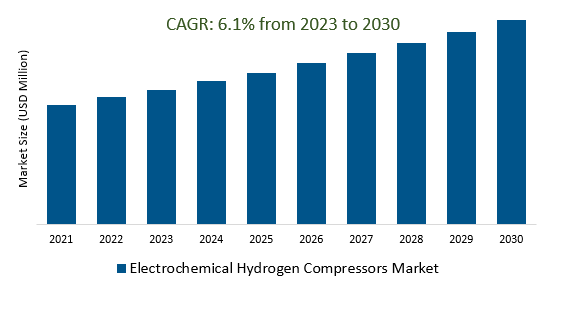
The Global Electrochemical Hydrogen Compressors Market is estimated to register 6.1% growth over the forecast period from 2023 to 2030
The market growth is driven by the increasing global transition towards clean and sustainable energy sources, particularly in sectors like transportation and industrial processes, which drive the demand for hydrogen as a clean fuel and energy carrier. Electrochemical hydrogen compressors play a crucial role in the hydrogen supply chain. Leading companies are focusing on Rapid Growth, Hydrogen Infrastructure Development, Hydrogen Fueling Stations, International Collaboration, Diversification of Applications, and others to boost market shares in the industry.
Market Overview
The Electrochemical Hydrogen Compressors Market is one of the rapidly emerging sectors within the hydrogen industry, driven by the global shift towards clean energy solutions. These compressors use electrochemical reactions for efficient hydrogen gas compression, offering high energy efficiency and reduced environmental impact compared to traditional mechanical compressors.
Market Dynamics
Market Trends- Benefits of EHCs for Hydrogen Refueling Infrastructure
Electrochemical Hydrogen Compressors (EHCs) bring notable advantages to hydrogen refueling infrastructure, including high energy efficiency, reduced environmental impact, reliability, quick response times, compatibility with renewable energy sources, safety compliance, potential for on-site hydrogen production, long-term cost savings, scalability, and ongoing technological advancements, making them an essential component in expanding and improving hydrogen refueling networks within the Electrochemical Hydrogen Compressors Market.
Market Driver- Hydrogen Economy Development Demand for Electrochemical Hydrogen Compressors Market
The development of the hydrogen economy is significantly increasing demand for Electrochemical Hydrogen Compressors (EHCs) as hydrogen's role as a clean energy carrier expands in various sectors. EHCs, known for their efficiency and environmental friendliness, are crucial for the reliable and cost-effective distribution of hydrogen, particularly in the growth of hydrogen infrastructure, including refueling stations and decentralized production facilities, making them a vital component in the evolving hydrogen economy.
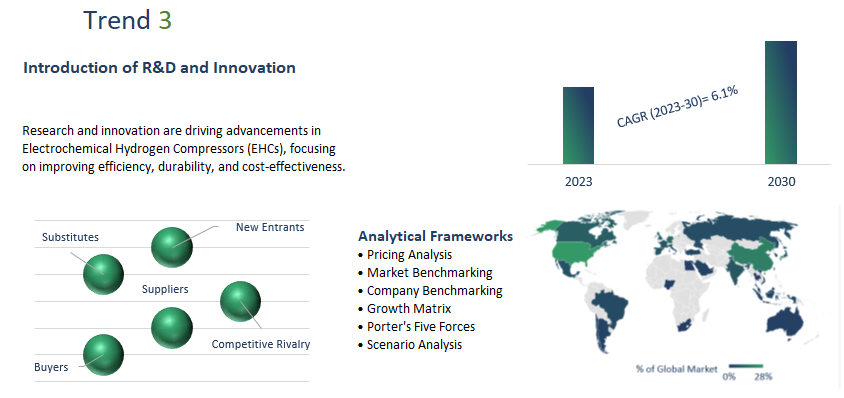
Market Opportunity-Introduction of R&D and Innovation
Research and innovation are driving advancements in Electrochemical Hydrogen Compressors (EHCs), focusing on improving efficiency, durability, and cost-effectiveness. These efforts enhance EHCs' competitiveness, support integration into emerging applications, and contribute to the broader adoption of hydrogen as a clean energy solution.
Market Share Analysis- Above 1000 Bar Electrochemical Hydrogen Compressors Market will register the fastest growth
The Global Electrochemical Hydrogen Compressors Market is analyzed by less than 100 Bar, 100 to 500 Bar, 500 to 1000 Bar, Above 1000 Bar, and others. Of these, Above 1000 Bar will register the fastest growth. The demand for Electrochemical Hydrogen Compressors (EHCs) exceeding 1000 bar is rising, primarily driven by aerospace, advanced materials, and specialized research sectors requiring exceptionally high-pressure hydrogen for applications like rocket propulsion, high-pressure testing, and advanced materials synthesis.
Market Share Analysis – HVAC held a significant market share in 2023
The Global Electrochemical Hydrogen Compressors Market is analyzed across various applications including Chemicals, Oil and Gas, HVAC, and Others. Of these, HVAC held a significant market share in 2023. Electrochemical Hydrogen Compressors (EHCs) are not directly related to Heating, Ventilation, and Air Conditioning (HVAC) systems, as EHCs are primarily designed for hydrogen compression and not for HVAC applications. However, hydrogen technology, including fuel cells, can indirectly impact HVAC by providing clean and efficient power sources for HVAC systems, although EHCs are not integrated into HVAC systems.
Electrochemical Hydrogen Compressors Market Segmentation
By Type
- Less than 100 Bar
- 100 to 500 Bar
- 500 to 1000 Bar
- Above 1000 Bar
By Application
- Chemical
- Oil & Gas
- HVAC
- Others
By Region
- North America (United States, Canada, Mexico)
- Europe (Germany, France, United Kingdom, Spain, Italy, Others)
- Asia Pacific (China, India, Japan, South Korea, Australia, Others)
- Latin America (Brazil, Argentina, Others)
- Middle East and Africa (Saudi Arabia, UAE, Kuwait, Other Middle East, South Africa, Nigeria, Other Africa)
Electrochemical Hydrogen Compressors Market Companies
- Skyre Inc
- HyET Hydrogen B.V.
- Nuvera Fuel Cells LLC
- Fuel Cell Energy Inc
* List not exhaustive
Electrochemical Hydrogen Compressors Market Outlook 2023
1 Market Overview
1.1 Introduction to the Electrochemical Hydrogen Compressors Market
1.2 Scope of the Study
1.3 Research Objective
1.3.1 Key Market Scope and Segments
1.3.2 Players Covered
1.3.3 Years Considered
2 Executive Summary
2.1 2023 Electrochemical Hydrogen Compressors Industry- Market Statistics
3 Market Dynamics
3.1 Market Drivers
3.2 Market Challenges
3.3 Market Opportunities
3.4 Market Trends
4 Market Factor Analysis
4.1 Porter’s Five Forces
4.2 Market Entropy
4.2.1 Global Electrochemical Hydrogen Compressors Market Companies with Area Served
4.2.2 Products Offerings Global Electrochemical Hydrogen Compressors Market
5 COVID-19 Impact Analysis and Outlook Scenarios
5.1.1 Covid-19 Impact Analysis
5.1.2 post-COVID-19 Scenario- Low Growth Case
5.1.3 post-COVID-19 Scenario- Reference Growth Case
5.1.4 post-COVID-19 Scenario- Low Growth Case
6 Global Electrochemical Hydrogen Compressors Market Trends
6.1 Global Electrochemical Hydrogen Compressors Revenue (USD Million) and CAGR (%) by Type (2018-2030)
6.2 Global Electrochemical Hydrogen Compressors Revenue (USD Million) and CAGR (%) by Applications (2018-2030)
6.3 Global Electrochemical Hydrogen Compressors Revenue (USD Million) and CAGR (%) by regions (2018-2030)
7 Global Electrochemical Hydrogen Compressors Market Revenue (USD Million) by Type, and Applications (2018-2022)
7.1 Global Electrochemical Hydrogen Compressors Revenue (USD Million) by Type (2018-2022)
7.1.1 Global Electrochemical Hydrogen Compressors Revenue (USD Million), Market Share (%) by Type (2018-2022)
7.2 Global Electrochemical Hydrogen Compressors Revenue (USD Million) by Applications (2018-2022)
7.2.1 Global Electrochemical Hydrogen Compressors Revenue (USD Million), Market Share (%) by Applications (2018-2022)
8 Global Electrochemical Hydrogen Compressors Development Regional Status and Outlook
8.1 Global Electrochemical Hydrogen Compressors Revenue (USD Million) By Regions (2018-2022)
8.2 North America Electrochemical Hydrogen Compressors Revenue (USD Million) by Type, and Application (2018-2022)
8.2.1 North America Electrochemical Hydrogen Compressors Revenue (USD Million) by Country (2018-2022)
8.2.2 North America Electrochemical Hydrogen Compressors Revenue (USD Million) by Type (2018-2022)
8.2.3 North America Electrochemical Hydrogen Compressors Revenue (USD Million) by Applications (2018-2022)
8.3 Europe Electrochemical Hydrogen Compressors Revenue (USD Million), by Type, and Applications (USD Million) (2018-2022)
8.3.1 Europe Electrochemical Hydrogen Compressors Revenue (USD Million), by Country (2018-2022)
8.3.2 Europe Electrochemical Hydrogen Compressors Revenue (USD Million) by Type (2018-2022)
8.3.3 Europe Electrochemical Hydrogen Compressors Revenue (USD Million) by Applications (2018-2022)
8.4 Asia Pacific Electrochemical Hydrogen Compressors Revenue (USD Million), and Revenue (USD Million) by Type, and Applications (2018-2022)
8.4.1 Asia Pacific Electrochemical Hydrogen Compressors Revenue (USD Million) by Country (2018-2022)
8.4.2 Asia Pacific Electrochemical Hydrogen Compressors Revenue (USD Million) by Type (2018-2022)
8.4.3 Asia Pacific Electrochemical Hydrogen Compressors Revenue (USD Million) by Applications (2018-2022)
8.5 South America Electrochemical Hydrogen Compressors Revenue (USD Million), by Type, and Applications (2018-2022)
8.5.1 South America Electrochemical Hydrogen Compressors Revenue (USD Million), by Country (2018-2022)
8.5.2 South America Electrochemical Hydrogen Compressors Revenue (USD Million) by Type (2018-2022)
8.5.3 South America Electrochemical Hydrogen Compressors Revenue (USD Million) by Applications (2018-2022)
8.6 Middle East and Africa Electrochemical Hydrogen Compressors Revenue (USD Million), by Type, Technology, Application, Thickness (2018-2022)
8.6.1 Middle East and Africa Electrochemical Hydrogen Compressors Revenue (USD Million) by Country (2018-2022)
8.6.2 Middle East and Africa Electrochemical Hydrogen Compressors Revenue (USD Million) by Type (2018-2022)
8.6.3 Middle East and Africa Electrochemical Hydrogen Compressors Revenue (USD Million) by Applications (2018-2022)
9 Company Profiles
10 Global Electrochemical Hydrogen Compressors Market Revenue (USD Million), by Type, and Applications (2023-2030)
10.1 Global Electrochemical Hydrogen Compressors Revenue (USD Million) and Market Share (%) by Type (2023-2030)
10.1.1 Global Electrochemical Hydrogen Compressors Revenue (USD Million), and Market Share (%) by Type (2023-2030)
10.2 Global Electrochemical Hydrogen Compressors Revenue (USD Million) and Market Share (%) by Applications (2023-2030)
10.2.1 Global Electrochemical Hydrogen Compressors Revenue (USD Million), and Market Share (%) by Applications (2023-2030)
11 Global Electrochemical Hydrogen Compressors Development Regional Status and Outlook Forecast
11.1 Global Electrochemical Hydrogen Compressors Revenue (USD Million) By Regions (2023-2030)
11.2 North America Electrochemical Hydrogen Compressors Revenue (USD Million) by Type, and Applications (2023-2030)
11.2.1 North America Electrochemical Hydrogen Compressors Revenue (USD) Million by Country (2023-2030)
11.2.2 North America Electrochemical Hydrogen Compressors Revenue (USD Million), by Type (2023-2030)
11.2.3 North America Electrochemical Hydrogen Compressors Revenue (USD Million), Market Share (%) by Applications (2023-2030)
11.3 Europe Electrochemical Hydrogen Compressors Revenue (USD Million), by Type, and Applications (2023-2030)
11.3.1 Europe Electrochemical Hydrogen Compressors Revenue (USD Million), by Country (2023-2030)
11.3.2 Europe Electrochemical Hydrogen Compressors Revenue (USD Million), by Type (2023-2030)
11.3.3 Europe Electrochemical Hydrogen Compressors Revenue (USD Million), by Applications (2023-2030)
11.4 Asia Pacific Electrochemical Hydrogen Compressors Revenue (USD Million) by Type, and Applications (2023-2030)
11.4.1 Asia Pacific Electrochemical Hydrogen Compressors Revenue (USD Million), by Country (2023-2030)
11.4.2 Asia Pacific Electrochemical Hydrogen Compressors Revenue (USD Million), by Type (2023-2030)
11.4.3 Asia Pacific Electrochemical Hydrogen Compressors Revenue (USD Million), by Applications (2023-2030)
11.5 South America Electrochemical Hydrogen Compressors Revenue (USD Million), by Type, and Applications (2023-2030)
11.5.1 South America Electrochemical Hydrogen Compressors Revenue (USD Million), by Country (2023-2030)
11.5.2 South America Electrochemical Hydrogen Compressors Revenue (USD Million), by Type (2023-2030)
11.5.3 South America Electrochemical Hydrogen Compressors Revenue (USD Million), by Applications (2023-2030)
11.6 Middle East and Africa Electrochemical Hydrogen Compressors Revenue (USD Million), by Type, and Applications (2023-2030)
11.6.1 Middle East and Africa Electrochemical Hydrogen Compressors Revenue (USD Million), by region (2023-2030)
11.6.2 Middle East and Africa Electrochemical Hydrogen Compressors Revenue (USD Million), by Type (2023-2030)
11.6.3 Middle East and Africa Electrochemical Hydrogen Compressors Revenue (USD Million), by Applications (2023-2030)
12 Methodology and Data Sources
12.1 Methodology/Research Approach
12.1.1 Research Programs/Design
12.1.2 Market Size Estimation
12.1.3 Market Breakdown and Data Triangulation
12.2 Data Sources
12.2.1 Secondary Sources
12.2.2 Primary Sources
12.3 Disclaimer
List of Tables
Table 1 Market Segmentation Analysis
Table 2 Global Electrochemical Hydrogen Compressors Market Companies with Areas Served
Table 3 Products Offerings Global Electrochemical Hydrogen Compressors Market
Table 4 Low Growth Scenario Forecasts
Table 5 Reference Case Growth Scenario
Table 6 High Growth Case Scenario
Table 7 Global Electrochemical Hydrogen Compressors Revenue (USD Million) And CAGR (%) By Type (2018-2030)
Table 8 Global Electrochemical Hydrogen Compressors Revenue (USD Million) And CAGR (%) By Applications (2018-2030)
Table 9 Global Electrochemical Hydrogen Compressors Revenue (USD Million) And CAGR (%) By Regions (2018-2030)
Table 10 Global Electrochemical Hydrogen Compressors Revenue (USD Million) By Type (2018-2022)
Table 11 Global Electrochemical Hydrogen Compressors Revenue Market Share (%) By Type (2018-2022)
Table 12 Global Electrochemical Hydrogen Compressors Revenue (USD Million) By Applications (2018-2022)
Table 13 Global Electrochemical Hydrogen Compressors Revenue Market Share (%) By Applications (2018-2022)
Table 14 Global Electrochemical Hydrogen Compressors Market Revenue (USD Million) By Regions (2018-2022)
Table 15 Global Electrochemical Hydrogen Compressors Market Share (%) By Regions (2018-2022)
Table 16 North America Electrochemical Hydrogen Compressors Revenue (USD Million) By Country (2018-2022)
Table 17 North America Electrochemical Hydrogen Compressors Revenue (USD Million) By Type (2018-2022)
Table 18 North America Electrochemical Hydrogen Compressors Revenue (USD Million) By Applications (2018-2022)
Table 19 Europe Electrochemical Hydrogen Compressors Revenue (USD Million) By Country (2018-2022)
Table 20 Europe Electrochemical Hydrogen Compressors Revenue (USD Million) By Type (2018-2022)
Table 21 Europe Electrochemical Hydrogen Compressors Revenue (USD Million) By Applications (2018-2022)
Table 22 Asia Pacific Electrochemical Hydrogen Compressors Revenue (USD Million) By Country (2018-2022)
Table 23 Asia Pacific Electrochemical Hydrogen Compressors Revenue (USD Million) By Type (2018-2022)
Table 24 Asia Pacific Electrochemical Hydrogen Compressors Revenue (USD Million) By Applications (2018-2022)
Table 25 South America Electrochemical Hydrogen Compressors Revenue (USD Million) By Country (2018-2022)
Table 26 South America Electrochemical Hydrogen Compressors Revenue (USD Million) By Type (2018-2022)
Table 27 South America Electrochemical Hydrogen Compressors Revenue (USD Million) By Applications (2018-2022)
Table 28 Middle East and Africa Electrochemical Hydrogen Compressors Revenue (USD Million) By Region (2018-2022)
Table 29 Middle East and Africa Electrochemical Hydrogen Compressors Revenue (USD Million) By Type (2018-2022)
Table 30 Middle East and Africa Electrochemical Hydrogen Compressors Revenue (USD Million) By Applications (2018-2022)
Table 31 Financial Analysis
Table 32 Global Electrochemical Hydrogen Compressors Revenue (USD Million) By Type (2023-2030)
Table 33 Global Electrochemical Hydrogen Compressors Revenue Market Share (%) By Type (2023-2030)
Table 34 Global Electrochemical Hydrogen Compressors Revenue (USD Million) By Applications (2023-2030)
Table 35 Global Electrochemical Hydrogen Compressors Revenue Market Share (%) By Applications (2023-2030)
Table 36 Global Electrochemical Hydrogen Compressors Market Revenue (USD Million), And Revenue (USD Million) By Regions (2023-2030)
Table 37 North America Electrochemical Hydrogen Compressors Revenue (USD)By Country (2023-2030)
Table 38 North America Electrochemical Hydrogen Compressors Revenue (USD Million) By Type (2023-2030)
Table 39 North America Electrochemical Hydrogen Compressors Revenue (USD Million) By Applications (2023-2030)
Table 40 Europe Electrochemical Hydrogen Compressors Revenue (USD Million) By Country (2023-2030)
Table 41 Europe Electrochemical Hydrogen Compressors Revenue (USD Million) By Type (2023-2030)
Table 42 Europe Electrochemical Hydrogen Compressors Revenue (USD Million) By Applications (2023-2030)
Table 43 Asia Pacific Electrochemical Hydrogen Compressors Revenue (USD Million) By Country (2023-2030)
Table 44 Asia Pacific Electrochemical Hydrogen Compressors Revenue (USD Million) By Type (2023-2030)
Table 45 Asia Pacific Electrochemical Hydrogen Compressors Revenue (USD Million) By Applications (2023-2030)
Table 46 South America Electrochemical Hydrogen Compressors Revenue (USD Million) By Country (2023-2030)
Table 47 South America Electrochemical Hydrogen Compressors Revenue (USD Million) By Type (2023-2030)
Table 48 South America Electrochemical Hydrogen Compressors Revenue (USD Million) By Applications (2023-2030)
Table 49 Middle East and Africa Electrochemical Hydrogen Compressors Revenue (USD Million) By Region (2023-2030)
Table 50 Middle East and Africa Electrochemical Hydrogen Compressors Revenue (USD Million) By Region (2023-2030)
Table 51 Middle East and Africa Electrochemical Hydrogen Compressors Revenue (USD Million) By Type (2023-2030)
Table 52 Middle East and Africa Electrochemical Hydrogen Compressors Revenue (USD Million) By Applications (2023-2030)
Table 53 Research Programs/Design for This Report
Table 54 Key Data Information from Secondary Sources
Table 55 Key Data Information from Primary Sources
List of Figures
Figure 1 Market Scope
Figure 2 Porter’s Five Forces
Figure 3 Global Electrochemical Hydrogen Compressors Revenue (USD Million) By Type (2018-2022)
Figure 4 Global Electrochemical Hydrogen Compressors Revenue Market Share (%) By Type (2022)
Figure 5 Global Electrochemical Hydrogen Compressors Revenue (USD Million) By Applications (2018-2022)
Figure 6 Global Electrochemical Hydrogen Compressors Revenue Market Share (%) By Applications (2022)
Figure 7 Global Electrochemical Hydrogen Compressors Market Revenue (USD Million) By Regions (2018-2022)
Figure 8 Global Electrochemical Hydrogen Compressors Market Share (%) By Regions (2022)
Figure 9 North America Electrochemical Hydrogen Compressors Revenue (USD Million) By Country (2018-2022)
Figure 10 North America Electrochemical Hydrogen Compressors Revenue (USD Million) By Type (2018-2022)
Figure 11 North America Electrochemical Hydrogen Compressors Revenue (USD Million) By Applications (2018-2022)
Figure 12 Europe Electrochemical Hydrogen Compressors Revenue (USD Million) By Country (2018-2022)
Figure 13 Europe Electrochemical Hydrogen Compressors Revenue (USD Million) By Type (2018-2022)
Figure 14 Europe Electrochemical Hydrogen Compressors Revenue (USD Million) By Applications (2018-2022)
Figure 15 Asia Pacific Electrochemical Hydrogen Compressors Revenue (USD Million) By Country (2018-2022)
Figure 16 Asia Pacific Electrochemical Hydrogen Compressors Revenue (USD Million) By Type (2018-2022)
Figure 17 Asia Pacific Electrochemical Hydrogen Compressors Revenue (USD Million) By Applications (2018-2022)
Figure 18 South America Electrochemical Hydrogen Compressors Revenue (USD Million) By Country (2018-2022)
Figure 19 South America Electrochemical Hydrogen Compressors Revenue (USD Million) By Type (2018-2022)
Figure 20 South America Electrochemical Hydrogen Compressors Revenue (USD Million) By Applications (2018-2022)
Figure 21 Middle East and Africa Electrochemical Hydrogen Compressors Revenue (USD Million) By Region (2018-2022)
Figure 22 Middle East and Africa Electrochemical Hydrogen Compressors Revenue (USD Million) By Type (2018-2022)
Figure 23 Middle East and Africa Electrochemical Hydrogen Compressors Revenue (USD Million) By Applications (2018-2022)
Figure 24 Global Electrochemical Hydrogen Compressors Revenue (USD Million) By Type (2023-2030)
Figure 25 Global Electrochemical Hydrogen Compressors Revenue Market Share (%) By Type (2030)
Figure 26 Global Electrochemical Hydrogen Compressors Revenue (USD Million) By Applications (2023-2030)
Figure 27 Global Electrochemical Hydrogen Compressors Revenue Market Share (%) By Applications (2030)
Figure 28 Global Electrochemical Hydrogen Compressors Market Revenue (USD Million) By Regions (2023-2030)
Figure 29 North America Electrochemical Hydrogen Compressors Revenue (USD Million) By Country (2023-2030)
Figure 30 North America Electrochemical Hydrogen Compressors Revenue (USD Million) By Type (2023-2030)
Figure 31 North America Electrochemical Hydrogen Compressors Revenue (USD Million) By Applications (2023-2030)
Figure 32 Europe Electrochemical Hydrogen Compressors Revenue (USD Million) By Country (2023-2030)
Figure 33 Europe Electrochemical Hydrogen Compressors Revenue (USD Million) By Type (2023-2030)
Figure 34 Europe Electrochemical Hydrogen Compressors Revenue (USD Million) By Applications (2023-2030)
Figure 35 Asia Pacific Electrochemical Hydrogen Compressors Revenue (USD Million) By Country (2023-2030)
Figure 36 Asia Pacific Electrochemical Hydrogen Compressors Revenue (USD Million) By Type (2023-2030)
Figure 37 Asia Pacific Electrochemical Hydrogen Compressors Revenue (USD Million) By Applications (2023-2030)
Figure 38 South America Electrochemical Hydrogen Compressors Revenue (USD Million) By Country (2023-2030)
Figure 39 South America Electrochemical Hydrogen Compressors Revenue (USD Million) By Type (2023-2030)
Figure 40 South America Electrochemical Hydrogen Compressors Revenue (USD Million) By Applications (2023-2030)
Figure 41 Middle East and Africa Electrochemical Hydrogen Compressors Revenue (USD Million) By Region (2023-2030)
Figure 42 Middle East and Africa Electrochemical Hydrogen Compressors Revenue (USD Million) By Region (2023-2030)
Figure 43 Middle East and Africa Electrochemical Hydrogen Compressors Revenue (USD Million) By Type (2023-2030)
Figure 44 Middle East and Africa Electrochemical Hydrogen Compressors Revenue (USD Million) By Applications (2023-2030)
Figure 45 Bottom-Up and Top-Down Approaches for This Report
Figure 46 Data Triangulation
