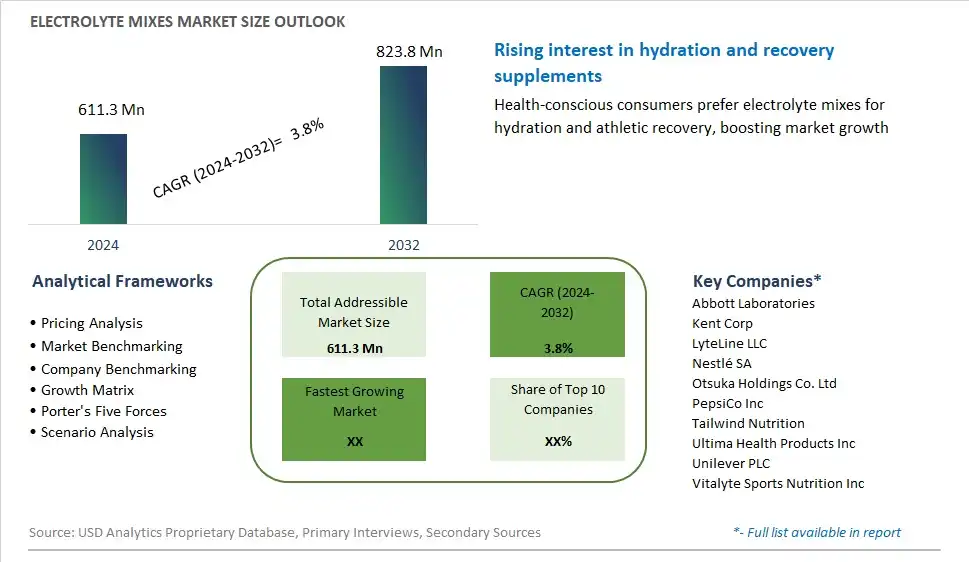
Global Electrolyte Mixes Market Size is valued at $611.3 Million in 2024 and is forecast to register a growth rate (CAGR) of 3.8% to reach $823.8 Million by 2032.
The global Electrolyte Mixes Market Comprehensive Study analyzes and forecasts the market size across 6 regions and 24 countries for diverse segments -By Product (RTD Beverages, Electrolyte Powders, Tablets), By Flavor (Flavored, Unflavored), By Distribution Channel (Supermarkets/Hypermarkets, Convenience Stores, Pharmacies/Drug Stores, Online Retail Stores, Others)
An Introduction to Electrolyte Mixes Market
In 2024, the market for electrolyte mixes is experiencing significant growth, driven by factors such as increasing health consciousness, active lifestyles, and rising demand for hydration solutions. Electrolyte mixes, formulated with essential minerals such as sodium, potassium, and magnesium, replenish electrolyte levels lost through sweat during physical activity or illness, helping to maintain hydration, muscle function, and overall well-being. With consumers seeking convenient and effective ways to stay hydrated and replenish electrolytes, electrolyte mixes offer a portable and customizable solution that can be easily added to water or sports drinks. Moreover, innovations in flavor variety, sugar-free options, and functional additives such as vitamins and antioxidants cater to diverse taste preferences and nutritional needs. Additionally, the market is witnessing a rise in electrolyte mixes tailored for specific activities and health goals, such as pre-workout, post-workout, and immune support formulations. As consumers prioritize hydration and seek functional beverages that support their active lifestyles, the electrolyte mixes market presents opportunities for product innovation, branding, and market expansion to meet evolving consumer needs and preferences in the health and wellness sector.
Electrolyte Mixes Competitive Landscape
The market report analyses the leading companies in the industry including Abbott Laboratories, Kent Corp, LyteLine LLC, Nestlé SA, Otsuka Holdings Co. Ltd, PepsiCo Inc, Tailwind Nutrition, Ultima Health Products Inc, Unilever PLC, Vitalyte Sports Nutrition Inc, and Others.
Electrolyte Mixes Market Dynamics
Electrolyte Mixes Market Trend: Rising Demand for Hydration and Wellness Solutions
A significant trend in the electrolyte mixes market is the rising demand for hydration and wellness solutions. With increasing awareness of the importance of proper hydration for overall health and athletic performance, consumers are seeking convenient and effective ways to replenish electrolytes lost through sweating during exercise, outdoor activities, and daily routines. This trend is driven by factors such as growing interest in fitness and wellness lifestyles, rising temperatures and humidity levels in many regions, and the popularity of sports and outdoor recreational activities. Electrolyte mixes offer a convenient and portable solution for replenishing essential minerals such as sodium, potassium, magnesium, and calcium, helping to maintain hydration levels, prevent dehydration, and support optimal muscle function and recovery. Additionally, the availability of electrolyte mixes in various flavors, formats, and formulations caters to the diverse preferences and needs of consumers seeking hydration and wellness solutions for different occasions and lifestyles. The rising demand for hydration and wellness solutions drives market growth and innovation in the electrolyte mixes industry as manufacturers respond to consumer preferences and seek to capitalize on opportunities in the dynamic and competitive market landscape.
Market Driver: Growing Emphasis on Sports and Fitness Performance
A key driver behind the demand for electrolyte mixes is the growing emphasis on sports and fitness performance among athletes, fitness enthusiasts, and active individuals. With an increasing focus on achieving peak performance, optimizing recovery, and maintaining endurance during physical activities, consumers are turning to electrolyte mixes as essential supplements to support their training and exercise routines. This driver is fueled by factors such as the popularity of sports nutrition products, the rise of competitive sports events, and the growing influence of health and wellness trends on consumer behavior. Electrolyte mixes provide a convenient and efficient way to replenish electrolytes lost through sweat during intense workouts, endurance activities, and prolonged exertion, helping to prevent muscle cramps, fatigue, and dehydration. Additionally, the inclusion of additional ingredients such as carbohydrates, vitamins, and antioxidants in some electrolyte mixes enhances their effectiveness in supporting energy production, immune function, and recovery, further driving their appeal among active individuals seeking holistic solutions for sports and fitness performance enhancement. The growing emphasis on sports and fitness performance drives market demand for electrolyte mixes as essential supplements for optimizing hydration and supporting peak physical performance, creating opportunities for manufacturers to innovate and expand their product offerings to meet the evolving needs of athletes and fitness enthusiasts.
Market Opportunity: Expansion into Functional and Specialty Formulations
An opportunity for the electrolyte mixes market lies in expansion into functional and specialty formulations to address specific health and wellness needs and cater to niche consumer segments. Manufacturers can explore opportunities to develop electrolyte mixes with added functional ingredients such as adaptogens, probiotics, amino acids, and natural extracts, offering targeted benefits for hydration, energy, recovery, and immune support. By incorporating scientifically-backed ingredients and formulations, manufacturers can differentiate their products and appeal to consumers seeking specialized solutions for sports performance, hydration optimization, and overall well-being. Additionally, targeting niche market segments such as endurance athletes, outdoor enthusiasts, travelers, and individuals with specific dietary preferences or health conditions provides opportunities to create tailored electrolyte mixes that address unique hydration and wellness needs. Furthermore, offering customizable options such as electrolyte mixes with adjustable flavor profiles, sugar-free formulations, and eco-friendly packaging appeals to environmentally conscious consumers seeking sustainable and personalized hydration solutions. By expanding into functional and specialty formulations, manufacturers can diversify their product portfolios, capture new market segments, and enhance their competitive position in the electrolyte mixes industry.
Electrolyte Mixes Market Share Analysis: Electrolyte Powders held the dominant market share in 2024
In the Electrolyte Mixes Market categorized by product, electrolyte powders emerge as the largest segment, driven by their versatility, convenience, and widespread application across various consumer preferences and lifestyles. Electrolyte powders offer consumers a convenient way to replenish electrolytes lost during physical activity, exercise, or periods of dehydration. Their powdered form allows for easy mixing with water or other beverages, providing a portable and customizable hydration solution suitable for on-the-go consumption. Further, electrolyte powders often come in a variety of flavors and formulations, catering to diverse tastes and dietary preferences. This versatility, coupled with the growing awareness of the importance of hydration for overall health and wellness, fuels the dominance of the electrolyte powder segment in the market. As consumers increasingly prioritize hydration and seek convenient ways to maintain electrolyte balance, the demand for electrolyte powders is expected to continue driving the growth of this segment in the Electrolyte Mixes Market.
Electrolyte Mixes Market Share Analysis: Flavored market is poised to register the fastest growth rae over the forecast period to 2032
In the Electrolyte Mixes Market segmented by flavor, the flavored segment is experiencing rapid growth, driven by evolving consumer preferences, increasing demand for enhanced hydration experiences, and innovative product offerings. Flavored electrolyte mixes offer consumers a refreshing and enjoyable way to replenish electrolytes lost during physical activity or periods of dehydration, enticing them to consume more fluids and stay hydrated. With a wide array of flavors ranging from fruit-infused to exotic blends, flavored electrolyte mixes cater to diverse taste preferences, appealing to a broader consumer base. Additionally, the growing trend of health-conscious consumption and wellness-oriented lifestyles encourages consumers to seek out flavored electrolyte mixes that are low in sugar and free from artificial additives, further driving the growth of this segment. As manufacturers continue to introduce new and innovative flavor profiles and formulations, the flavored segment of the Electrolyte Mixes Market is poised for sustained expansion in the foreseeable future.
Electrolyte Mixes Market Share Analysis: Supermarkets/Hypermarkets held the dominant market share in 2024
In the Electrolyte Mixes Market segmented by distribution channel, supermarkets and hypermarkets emerge as the largest segment, driven by their extensive reach, diverse product offerings, and consumer preference for one-stop shopping convenience. Supermarkets and hypermarkets provide a convenient and accessible shopping experience, offering a wide selection of electrolyte mixes alongside other beverages and health-related products. Their large floor space allows for prominent product placement and visibility, attracting consumers and facilitating impulse purchases. Additionally, the established presence of supermarkets and hypermarkets in urban and suburban areas ensures widespread availability of electrolyte mixes to a broad consumer base. As consumers increasingly prioritize convenience and seek out hydration solutions during their routine grocery shopping trips, supermarkets and hypermarkets continue to dominate the distribution landscape of the Electrolyte Mixes Market.
Electrolyte Mixes Market Segmentation
By Product
RTD Beverages
Electrolyte Powders
Tablets
By Flavor
Flavored
Unflavored
By Distribution Channel
Supermarkets/Hypermarkets
Convenience Stores
Pharmacies/Drug Stores
Online Retail Stores
Others
Countries Analyzed
North America (US, Canada, Mexico)
Europe (Germany, UK, France, Spain, Italy, Russia, Rest of Europe)
Asia Pacific (China, India, Japan, South Korea, Australia, South East Asia, Rest of Asia)
South America (Brazil, Argentina, Rest of South America)
Middle East and Africa (Saudi Arabia, UAE, Rest of Middle East, South Africa, Egypt, Rest of Africa)
Electrolyte Mixes Companies Profiled in the Study
Abbott Laboratories
Kent Corp
LyteLine LLC
Nestlé SA
Otsuka Holdings Co. Ltd
PepsiCo Inc
Tailwind Nutrition
Ultima Health Products Inc
Unilever PLC
Vitalyte Sports Nutrition Inc
*- List Not Exhaustive
Chapter 1. TABLE OF CONTENTS
Chapter 2. Introduction to Electrolyte Mixes Market
2.1. Market Overview
2.2. Key Statistics and Report Highlights
2.3. Scope of the Comprehensive Study
2.3.1. Market Definition
2.3.2 Countries and Regions Covered
2.3.3 Research Objective
2.3.4 Units, Currency, and Conversions
2.3.5 Industry Value Chain
2.4. Key Market Segments
2.5. Key Companies
2.6. Study Period
Chapter 3. Strategic Analysis Review
3.1. Electrolyte Mixes Pricing Analysis and Forecast
3.2. Porter’s Five Forces
3.3. Market Ecosystem
3.4. SWOT Analysis
3.5. Regulatory Scenario
3.3. Effects of Inflation, Russia-Ukraine War, moderating economic growth, and other macroeconomic factors
Chapter 4. Competitive Landscape
4.1. Market Share Analysis
4.1.1. Global Electrolyte Mixes Market Share by Company, 2023
4.1.2. Product Offerings of Leading Electrolyte Mixes Companies
4.2. Market Entropy
4.2.1. New Product Launches in the Industry
4.2.2. Mergers, Acquisitions, Joint ventures, and Partnerships
4.3. Key Strategies and Best Practices
Chapter 5. Global Market Projections: Best, Reference, and Low Case Scenarios
5.1. Growth Analysis- Case Scenario Definitions
5.2. Low Growth Case Scenario Forecasts
5.3. Reference Growth Case Scenario Forecasts
5.4. High Growth Case Scenario Forecasts
Chapter 6. Market Dynamics
6.1. Electrolyte Mixes Market Drivers
6.2. Electrolyte Mixes Market Challenges
6.6. Electrolyte Mixes Market Opportunities
6.4. Electrolyte Mixes Market Trends
Chapter 7. Global Electrolyte Mixes Market Outlook Trends
7.1. Global Electrolyte Mixes Revenue (USD Million) and CAGR (%) by Type (2021-2032)
7.2. Global Electrolyte Mixes Revenue (USD Million) and CAGR (%) by Application (2021-2032)
7.3. Global Electrolyte Mixes Revenue (USD Million) and CAGR (%) by Product (2021-2032)
By Product
RTD Beverages
Electrolyte Powders
Tablets
By Flavor
Flavored
Unflavored
By Distribution Channel
Supermarkets/Hypermarkets
Convenience Stores
Pharmacies/Drug Stores
Online Retail Stores
Others
Chapter 8. Global Electrolyte Mixes Regional Analysis and Outlook
8.1. Global Electrolyte Mixes Revenue (USD Million) By Regions (2021- 2032)
8.2. North America Electrolyte Mixes Revenue (USD Million) by Country (2021-2032)
8.2.1. United States Electrolyte Mixes Regional Analysis and Outlook
8.2.2. Canada Electrolyte Mixes Regional Analysis and Outlook
8.2.3. Mexico Electrolyte Mixes Regional Analysis and Outlook
8.3. Europe Electrolyte Mixes Revenue (USD Million), by Country (2021-2032)
8.3.1. Germany Electrolyte Mixes Regional Analysis and Outlook
8.3.2. France Electrolyte Mixes Regional Analysis and Outlook
8.3.3. United Kingdom Electrolyte Mixes Regional Analysis and Outlook
8.3.4. Spain Electrolyte Mixes Regional Analysis and Outlook
8.3.5. Italy Electrolyte Mixes Regional Analysis and Outlook
8.3.6. Russia Electrolyte Mixes Regional Analysis and Outlook
8.3.7. Rest of Europe Electrolyte Mixes Regional Analysis and Outlook
8.4. Asia Pacific Electrolyte Mixes Revenue (USD Million) by Country (2021-2032)
8.4.1. China Electrolyte Mixes Regional Analysis and Outlook
8.4.2. Japan Electrolyte Mixes Regional Analysis and Outlook
8.4.3. India Electrolyte Mixes Regional Analysis and Outlook
8.4.4. South Korea Electrolyte Mixes Regional Analysis and Outlook
8.4.5. Australia Electrolyte Mixes Regional Analysis and Outlook
8.4.6. South East Asia Electrolyte Mixes Regional Analysis and Outlook
8.4.7. Rest of Asia Pacific Electrolyte Mixes Regional Analysis and Outlook
8.5. South America Electrolyte Mixes Revenue (USD Million), by Country (2021-2032)
8.5.1. Brazil Electrolyte Mixes Regional Analysis and Outlook
8.5.2. Argentina Electrolyte Mixes Regional Analysis and Outlook
8.5.3. Rest of South America Electrolyte Mixes Regional Analysis and Outlook
8.6. Middle East and Africa Electrolyte Mixes Revenue (USD Million) by Country (2021-2032)
8.6.1. Middle East Electrolyte Mixes Regional Analysis and Outlook
8.6.2. Africa Electrolyte Mixes Regional Analysis and Outlook
Chapter 9. North America Electrolyte Mixes Analysis and Outlook
9.1. North America Electrolyte Mixes Revenue (USD Million) by Segments (2021-2032)
9.1.1. North America Electrolyte Mixes Revenue (USD Million) by Type (2021-2032)
9.1.2. North America Electrolyte Mixes Revenue (USD Million) by Application (2021-2032)
9.1.3. North America Electrolyte Mixes Revenue (USD Million) by Product (2021-2032)
By Product
RTD Beverages
Electrolyte Powders
Tablets
By Flavor
Flavored
Unflavored
By Distribution Channel
Supermarkets/Hypermarkets
Convenience Stores
Pharmacies/Drug Stores
Online Retail Stores
Others
Chapter 10. Europe Electrolyte Mixes Analysis and Outlook
10.1. Europe Electrolyte Mixes Revenue (USD Million), by Segments (USD Million) (2021-2032)
10.1.1. Europe Electrolyte Mixes Revenue (USD Million) by Type (2021-2032)
10.1.2. Europe Electrolyte Mixes Revenue (USD Million) by Application (2021-2032)
10.1.3. Europe Electrolyte Mixes Revenue (USD Million) by Product (2021-2032)
By Product
RTD Beverages
Electrolyte Powders
Tablets
By Flavor
Flavored
Unflavored
By Distribution Channel
Supermarkets/Hypermarkets
Convenience Stores
Pharmacies/Drug Stores
Online Retail Stores
Others
Chapter 11. Asia Pacific Electrolyte Mixes Analysis and Outlook
11.1. Asia Pacific Electrolyte Mixes Revenue (USD Million), and Revenue (USD Million) by Segments (2021-2032)
11.1.1. Asia Pacific Electrolyte Mixes Revenue (USD Million) by Type (2021-2032)
11.1.2. Asia Pacific Electrolyte Mixes Revenue (USD Million) by Application (2021-2032)
11.1.3. Asia Pacific Electrolyte Mixes Revenue (USD Million) by Product (2021-2032)
By Product
RTD Beverages
Electrolyte Powders
Tablets
By Flavor
Flavored
Unflavored
By Distribution Channel
Supermarkets/Hypermarkets
Convenience Stores
Pharmacies/Drug Stores
Online Retail Stores
Others
Chapter 12. South America Electrolyte Mixes Analysis and Outlook
12.1. South America Electrolyte Mixes Revenue (USD Million), by Segments (2021-2032)
12.1.1. South America Electrolyte Mixes Revenue (USD Million) by Type (2021-2032)
12.1.2. South America Electrolyte Mixes Revenue (USD Million) by Application (2021-2032)
12.1.3. South America Electrolyte Mixes Revenue (USD Million) by Product (2021-2032)
By Product
RTD Beverages
Electrolyte Powders
Tablets
By Flavor
Flavored
Unflavored
By Distribution Channel
Supermarkets/Hypermarkets
Convenience Stores
Pharmacies/Drug Stores
Online Retail Stores
Others
Chapter 13. Middle East and Africa Electrolyte Mixes Analysis and Outlook
13.1. Middle East and Africa Electrolyte Mixes Revenue (USD Million), by Segments (2021-2032)
13.1.1. Middle East and Africa Electrolyte Mixes Revenue (USD Million) by Type (2021-2032)
13.1.2. Middle East and Africa Electrolyte Mixes Revenue (USD Million) by Application (2021-2032)
13.1.3. Middle East and Africa Electrolyte Mixes Revenue (USD Million) by Product (2021-2032)
By Product
RTD Beverages
Electrolyte Powders
Tablets
By Flavor
Flavored
Unflavored
By Distribution Channel
Supermarkets/Hypermarkets
Convenience Stores
Pharmacies/Drug Stores
Online Retail Stores
Others
Chapter 14. Electrolyte Mixes Company Profiles
14.1 Business Overview
14.2 Product Profiles
14.3 SWOT Profiles
14.5 Recent Developments
14.6 Financial Profile
List of Companies
Abbott Laboratories
Kent Corp
LyteLine LLC
Nestlé SA
Otsuka Holdings Co. Ltd
PepsiCo Inc
Tailwind Nutrition
Ultima Health Products Inc
Unilever PLC
Vitalyte Sports Nutrition Inc
15. Methodology and Data Sources
15.1 Customization Offerings
15.2 Subscription Services
15.3 Related Reports
15.4 Publisher Expertise
LIST OF TABLES
Table 1 Market Segmentation Analysis
Table 2 Global Electrolyte Mixes Market Share of Leading Companies, 2023
Table 3 Product Offerings of Leading Companies
Table 4 Low Growth Scenario Forecasts
Table 5 Reference Case Growth Scenario
Table 6 High Growth Case Scenario
Table 7 Global Electrolyte Mixes Revenue (USD Million) And CAGR (%) By Type (2021-2032)
Table 8 Global Electrolyte Mixes Revenue (USD Million) And CAGR (%) By Application (2021-2032)
Table 9 Global Electrolyte Mixes Revenue (USD Million) And CAGR (%) By Product (2021-2032)
Table 10 Global Electrolyte Mixes Market Revenue (USD Million) By Regions (2021-2032)
Table 11 Global Electrolyte Mixes Market Share (%) By Regions (2021-2032)
Table 12 North America Electrolyte Mixes Revenue (USD Million) By Country (2021-2032)
Table 13 Europe Electrolyte Mixes Revenue (USD Million) By Country (2021-2032)
Table 14 Asia Pacific Electrolyte Mixes Revenue (USD Million) By Country (2021-2032)
Table 15 South America Electrolyte Mixes Revenue (USD Million) By Country (2021-2032)
Table 16 Middle East and Africa Electrolyte Mixes Revenue (USD Million) By Region (2021-2032)
Table 17 North America Electrolyte Mixes Revenue (USD Million) By Type (2021-2032)
Table 18 North America Electrolyte Mixes Revenue (USD Million) By Application (2021-2032)
Table 19 North America Electrolyte Mixes Revenue (USD Million) By Product (2021-2032)
Table 20 Europe Electrolyte Mixes Revenue (USD Million) By Type (2021-2032)
Table 21 Europe Electrolyte Mixes Revenue (USD Million) By Application (2021-2032)
Table 22 Europe Electrolyte Mixes Revenue (USD Million) By Product (2021-2032)
Table 23 Asia Pacific Electrolyte Mixes Revenue (USD Million) By Type (2021-2032)
Table 24 Asia Pacific Electrolyte Mixes Revenue (USD Million) By Application (2021-2032)
Table 25 Asia Pacific Electrolyte Mixes Revenue (USD Million) By Product (2021-2032)
Table 26 South America Electrolyte Mixes Revenue (USD Million) By Type (2021-2032)
Table 27 South America Electrolyte Mixes Revenue (USD Million) By Application (2021-2032)
Table 28 South America Electrolyte Mixes Revenue (USD Million) By Product (2021-2032)
Table 29 Middle East and Africa Electrolyte Mixes Revenue (USD Million) By Type (2021-2032)
Table 30 Middle East and Africa Electrolyte Mixes Revenue (USD Million) By Application (2021-2032)
Table 31 Middle East and Africa Electrolyte Mixes Revenue (USD Million) By Product (2021-2032)
LIST OF FIGURES
Figure 1. Market Scope
Figure 2. Pricing Forecasts Per Unit, 2023- 2032
Figure 3. Porter’s Five Forces
Figure 4. Global Electrolyte Mixes Market Revenue (USD Million) By Regions (2021-2032)
Figure 5. Global Electrolyte Mixes Market Share (%) By Regions (2023)
Figure 6. North America Electrolyte Mixes Revenue (USD Million) By Country (2021-2032)
Figure 7. United States Electrolyte Mixes Revenue (USD Million) By Country (2021-2032)
Figure 8. Canada Electrolyte Mixes Revenue (USD Million) By Country (2021-2032)
Figure 9. Mexico Electrolyte Mixes Revenue (USD Million) By Country (2021-2032)
Figure 10. Europe Electrolyte Mixes Revenue (USD Million) By Country (2021-2032)
Figure 11. Germany Electrolyte Mixes Revenue (USD Million) By Country (2021-2032)
Figure 12. France Electrolyte Mixes Revenue (USD Million) By Country (2021-2032)
Figure 13. United Kingdom Electrolyte Mixes Revenue (USD Million) By Country (2021-2032)
Figure 14. Spain Electrolyte Mixes Revenue (USD Million) By Country (2021-2032)
Figure 15. Italy Electrolyte Mixes Revenue (USD Million) By Country (2021-2032)
Figure 16. Russia Electrolyte Mixes Revenue (USD Million) By Country (2021-2032)
Figure 17. Rest of Europe Electrolyte Mixes Revenue (USD Million) By Country (2021-2032)
Figure 11. Asia Pacific Electrolyte Mixes Revenue (USD Million) By Country (2021-2032)
Figure 12. China Electrolyte Mixes Revenue (USD Million) By Country (2021-2032)
Figure 13. Japan Electrolyte Mixes Revenue (USD Million) By Country (2021-2032)
Figure 14. India Electrolyte Mixes Revenue (USD Million) By Country (2021-2032)
Figure 15. South Korea Electrolyte Mixes Revenue (USD Million) By Country (2021-2032)
Figure 16. Australia Electrolyte Mixes Revenue (USD Million) By Country (2021-2032)
Figure 17. South East Asia Electrolyte Mixes Revenue (USD Million) By Country (2021-2032)
Figure 18. South America Electrolyte Mixes Revenue (USD Million) By Country (2021-2032)
Figure 19. Brazil Electrolyte Mixes Revenue (USD Million) By Country (2021-2032)
Figure 20. Argentina Electrolyte Mixes Revenue (USD Million) By Country (2021-2032)
Figure 21. Rest of Asia Pacific Electrolyte Mixes Revenue (USD Million) By Country (2021-2032)
Figure 22. Middle East and Africa Electrolyte Mixes Revenue (USD Million) By Region (2021-2032)
Figure 23. Saudi Arabia Electrolyte Mixes Revenue (USD Million) By Region (2021-2032)
Figure 24. The UAE Electrolyte Mixes Revenue (USD Million) By Region (2021-2032)
Figure 25. Rest of Middle East Electrolyte Mixes Revenue (USD Million) By Region (2021-2032)
Figure 26. South Africa Electrolyte Mixes Revenue (USD Million) By Region (2021-2032)
Figure 27. Africa Electrolyte Mixes Revenue (USD Million) By Region (2021-2032)
Figure 28. North America Electrolyte Mixes Revenue (USD Million) By Type (2021-2032)
Figure 29. North America Electrolyte Mixes Revenue (USD Million) By Application (2021-2032)
Figure 30. North America Electrolyte Mixes Revenue (USD Million) By Product (2021-2032)
Figure 31. Europe Electrolyte Mixes Revenue (USD Million) By Type (2021-2032)
Figure 32. Europe Electrolyte Mixes Revenue (USD Million) By Application (2021-2032)
Figure 33. Europe Electrolyte Mixes Revenue (USD Million) By Product (2021-2032)
Figure 34. Asia Pacific Electrolyte Mixes Revenue (USD Million) By Type (2021-2032)
Figure 35. Asia Pacific Electrolyte Mixes Revenue (USD Million) By Application (2021-2032)
Figure 36. Asia Pacific Electrolyte Mixes Revenue (USD Million) By Product (2021-2032)
Figure 37. South America Electrolyte Mixes Revenue (USD Million) By Type (2021-2032)
Figure 38. South America Electrolyte Mixes Revenue (USD Million) By Application (2021-2032)
Figure 39. South America Electrolyte Mixes Revenue (USD Million) By Product (2021-2032)
Figure 40. Middle East and Africa Electrolyte Mixes Revenue (USD Million) By Type (2021-2032)
Figure 41. Middle East and Africa Electrolyte Mixes Revenue (USD Million) By Application (2021-2032)
Figure 42. Middle East and Africa Electrolyte Mixes Revenue (USD Million) By Product (2021-2032)
By Product
RTD Beverages
Electrolyte Powders
Tablets
By Flavor
Flavored
Unflavored
By Distribution Channel
Supermarkets/Hypermarkets
Convenience Stores
Pharmacies/Drug Stores
Online Retail Stores
Others
Countries Analyzed
North America (US, Canada, Mexico)
Europe (Germany, UK, France, Spain, Italy, Russia, Rest of Europe)
Asia Pacific (China, India, Japan, South Korea, Australia, South East Asia, Rest of Asia)
South America (Brazil, Argentina, Rest of South America)
Middle East and Africa (Saudi Arabia, UAE, Rest of Middle East, South Africa, Egypt, Rest of Africa)
