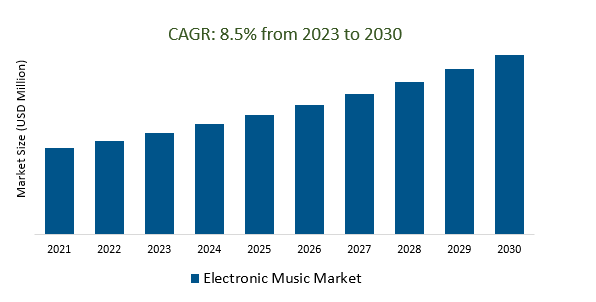
The Global Electronic Music Market Size is estimated to register 8.5% growth over the forecast period from 2023 to 2030.
The market growth is driven by increasing electronic music is featured in many video games and esports events, broadening its exposure to a younger demographic. Leading Companies focusing on Continued Growth of Streaming, Live Events and Virtual Experiences, NFTs and Digital Collectibles, Innovations in Music Production, and others to boost market shares in the industry.
Market Overview
The electronic music market was a significant part of the music industry, with revenue primarily from streaming, live events, and merchandise. It encompassed diverse sub-genres and experienced technological advancements, collaboration with other genres, growth in the global scene, and concerns about sustainability. Streaming services dominated music consumption, and festivals like Tomorrowland were crucial. Independent labels and underground scenes thrived, but copyright issues and licensing challenges remained. The industry had a global reach, and a strong online presence, and explored virtual reality and augmented reality technologies.
Market Dynamics
Market Trends- Streaming services are the unrivaled force shaping the electronic music landscape.
Streaming services have become the driving force that's fundamentally reshaping the electronic music market. With their user-friendly interfaces, vast music libraries, and personalized playlists, platforms like Spotify, Apple Music, and Amazon Music have revolutionized the way listeners access and consume electronic music. This digital paradigm shift has not only revitalized the industry but has also provided independent artists with a global stage to showcase their talent.
Market Driver- Live events and festivals fuel demand for electronic music in the market.
Live events and festivals play a pivotal role in driving the demand for electronic music in the market. These electrifying gatherings provide a platform for fans to immerse themselves in the immersive world of electronic music, fostering a sense of community and connection. Major festivals such as Tomorrowland, Ultra Music Festival, and Electric Daisy Carnival attract a global audience, showcasing top-tier DJs and cutting-edge production. The experience of dancing to pulsating beats amidst dazzling visuals and intricate stage designs is an unparalleled draw for enthusiasts. Beyond the traditional concert setting, electronic music's dynamic presence at clubs and underground venues further fuels its popularity.
Market Opportunity- Licensing and copyright underpin the electronic music market.
Licensing and copyright are the linchpins of the electronic music market. In this rapidly evolving industry, the protection of intellectual property and the establishment of licensing agreements are critical for artists, producers, and record labels. They ensure that creators are fairly compensated for their work while granting access to music distribution and synchronization in various media, from streaming platforms to advertising and film. The complex landscape of copyright and licensing, including issues related to sample clearance and royalties, has spurred the development of specialized agencies and technology solutions to navigate these intricacies.
Market Share Analysis- Trance Music Electronic Music Market will register the fastest growth
The Global Electronic Music Market is analyzed across Trance Music, House Music, Hip Hop Music, Techno/Electro Music, Drum and bass Music, and others. Trance Music is poised to register the fastest growth. Trance music is a significant subgenre in the electronic music market, known for its hypnotic beats and melodic elements. It has a dedicated global following, contributes to the industry's diversity, and is showcased at major events and festivals. Trance artists and digital platforms play key roles in its popularity and accessibility, making it a driving force in electronic music.
Market Share Analysis- Clubs & Festivals held a significant market share in 2023
The Global Electronic Music Market is analyzed across various applications including Clubs & Festivals, DJs & Live Acts, and others. Of these, Clubs & Festivals held a significant market share in 2023. Clubs and festivals are pivotal to the electronic music market, with clubs offering intimate settings for live experiences and nurturing local scenes, while global festivals like Tomorrowland and Ultra Music Festival attract worldwide audiences and serve as influential platforms for artists and labels, driving demand and shaping the genre's cultural and commercial landscape.
Electronic Music Market Segmentation
By Type
- Trance Music
- House Music
- Hip Hop Music
- Techno/Electro Music
- Drum & Bass Music
By Application
- Clubs & Festivals
- DJs & Live Acts
- Others
By Sales Channel
· Direct Channel
· Distribution Channel
By Region
- North America (United States, Canada, Mexico)
- Europe (Germany, France, United Kingdom, Spain, Italy, Others)
- Asia Pacific (China, India, Japan, South Korea, Australia, Others)
- Latin America (Brazil, Argentina, Others)
- Middle East and Africa (Saudi Arabia, UAE, Kuwait, Other Middle East, South Africa, Nigeria, Other Africa)
Electronic Music Market companies
- Armada Music
- Mad Decent
- BMG
- Monstercat
- Ministry of Sound
- Spinnin’ Records
- Revealed Recordings
- Dim Mak
- OWSLA
- Defected
- KAA Production
- District 6 Music Publishing
- Pacha Group
- Ultra International Music Publishing
- Downtown Music Publishing
- Budde Music
- Pulse Music Group
- Kobalt Music Group
- MusicAllStars
*List not exhaustive
Electronic Music Market Outlook 2023
1 Market Overview
1.1 Introduction to the Electronic Music Market
1.2 Scope of the Study
1.3 Research Objective
1.3.1 Key Market Scope and Segments
1.3.2 Players Covered
1.3.3 Years Considered
2 Executive Summary
2.1 2023 Electronic Music Industry- Market Statistics
3 Market Dynamics
3.1 Market Drivers
3.2 Market Challenges
3.3 Market Opportunities
3.4 Market Trends
4 Market Factor Analysis
4.1 Porter’s Five Forces
4.2 Market Entropy
4.2.1 Global Electronic Music Market Companies with Area Served
4.2.2 Products Offerings Global Electronic Music Market
5 COVID-19 Impact Analysis and Outlook Scenarios
5.1.1 Covid-19 Impact Analysis
5.1.2 Post-COVID-19 Scenario- Low Growth Case
5.1.3 Post-COVID-19 Scenario- Reference Growth Case
5.1.4 Post-COVID-19 Scenario- Low Growth Case
6 Global Electronic Music Market Trends
6.1 Global Electronic Music Revenue (USD Million) and CAGR (%) by Type (2018-2030)
6.2 Global Electronic Music Revenue (USD Million) and CAGR (%) by Applications (2018-2030)
6.3 Global Electronic Music Revenue (USD Million) and CAGR (%) by Regions (2018-2030)
7 Global Electronic Music Market Revenue (USD Million) by Type, and Applications (2018-2022)
7.1 Global Electronic Music Revenue (USD Million) by Type (2018-2022)
7.1.1 Global Electronic Music Revenue (USD Million), Market Share (%) by Type (2018-2022)
7.2 Global Electronic Music Revenue (USD Million) by Applications (2018-2022)
7.2.1 Global Electronic Music Revenue (USD Million), Market Share (%) by Applications (2018-2022)
8 Global Electronic Music Development Regional Status and Outlook
8.1 Global Electronic Music Revenue (USD Million) By Regions (2018-2022)
8.2 North America Electronic Music Revenue (USD Million) by Type, and Application (2018-2022)
8.2.1 North America Electronic Music Revenue (USD Million) by Country (2018-2022)
8.2.2 North America Electronic Music Revenue (USD Million) by Type (2018-2022)
8.2.3 North America Electronic Music Revenue (USD Million) by Applications (2018-2022)
8.3 Europe Electronic Music Revenue (USD Million), by Type, and Applications (USD Million) (2018-2022)
8.3.1 Europe Electronic Music Revenue (USD Million), by Country (2018-2022)
8.3.2 Europe Electronic Music Revenue (USD Million) by Type (2018-2022)
8.3.3 Europe Electronic Music Revenue (USD Million) by Applications (2018-2022)
8.4 Asia Pacific Electronic Music Revenue (USD Million), and Revenue (USD Million) by Type, and Applications (2018-2022)
8.4.1 Asia Pacific Electronic Music Revenue (USD Million) by Country (2018-2022)
8.4.2 Asia Pacific Electronic Music Revenue (USD Million) by Type (2018-2022)
8.4.3 Asia Pacific Electronic Music Revenue (USD Million) by Applications (2018-2022)
8.5 South America Electronic Music Revenue (USD Million), by Type, and Applications (2018-2022)
8.5.1 South America Electronic Music Revenue (USD Million), by Country (2018-2022)
8.5.2 South America Electronic Music Revenue (USD Million) by Type (2018-2022)
8.5.3 South America Electronic Music Revenue (USD Million) by Applications (2018-2022)
8.6 Middle East and Africa Electronic Music Revenue (USD Million), by Type, Technology, Application, Thickness (2018-2022)
8.6.1 Middle East and Africa Electronic Music Revenue (USD Million) by Country (2018-2022)
8.6.2 Middle East and Africa Electronic Music Revenue (USD Million) by Type (2018-2022)
8.6.3 Middle East and Africa Electronic Music Revenue (USD Million) by Applications (2018-2022)
9 Company Profiles
10 Global Electronic Music Market Revenue (USD Million), by Type, and Applications (2023-2030)
10.1 Global Electronic Music Revenue (USD Million) and Market Share (%) by Type (2023-2030)
10.1.1 Global Electronic Music Revenue (USD Million), and Market Share (%) by Type (2023-2030)
10.2 Global Electronic Music Revenue (USD Million) and Market Share (%) by Applications (2023-2030)
10.2.1 Global Electronic Music Revenue (USD Million), and Market Share (%) by Applications (2023-2030)
11 Global Electronic Music Development Regional Status and Outlook Forecast
11.1 Global Electronic Music Revenue (USD Million) By Regions (2023-2030)
11.2 North America Electronic Music Revenue (USD Million) by Type, and Applications (2023-2030)
11.2.1 North America Electronic Music Revenue (USD) Million by Country (2023-2030)
11.2.2 North America Electronic Music Revenue (USD Million), by Type (2023-2030)
11.2.3 North America Electronic Music Revenue (USD Million), Market Share (%) by Applications (2023-2030)
11.3 Europe Electronic Music Revenue (USD Million), by Type, and Applications (2023-2030)
11.3.1 Europe Electronic Music Revenue (USD Million), by Country (2023-2030)
11.3.2 Europe Electronic Music Revenue (USD Million), by Type (2023-2030)
11.3.3 Europe Electronic Music Revenue (USD Million), by Applications (2023-2030)
11.4 Asia Pacific Electronic Music Revenue (USD Million) by Type, and Applications (2023-2030)
11.4.1 Asia Pacific Electronic Music Revenue (USD Million), by Country (2023-2030)
11.4.2 Asia Pacific Electronic Music Revenue (USD Million), by Type (2023-2030)
11.4.3 Asia Pacific Electronic Music Revenue (USD Million), by Applications (2023-2030)
11.5 South America Electronic Music Revenue (USD Million), by Type, and Applications (2023-2030)
11.5.1 South America Electronic Music Revenue (USD Million), by Country (2023-2030)
11.5.2 South America Electronic Music Revenue (USD Million), by Type (2023-2030)
11.5.3 South America Electronic Music Revenue (USD Million), by Applications (2023-2030)
11.6 Middle East and Africa Electronic Music Revenue (USD Million), by Type, and Applications (2023-2030)
11.6.1 Middle East and Africa Electronic Music Revenue (USD Million), by Region (2023-2030)
11.6.2 Middle East and Africa Electronic Music Revenue (USD Million), by Type (2023-2030)
11.6.3 Middle East and Africa Electronic Music Revenue (USD Million), by Applications (2023-2030)
12 Methodology and Data Sources
12.1 Methodology/Research Approach
12.1.1 Research Programs/Design
12.1.2 Market Size Estimation
12.1.3 Market Breakdown and Data Triangulation
12.2 Data Sources
12.2.1 Secondary Sources
12.2.2 Primary Sources
12.3 Disclaimer
List of Tables
Table 1 Market Segmentation Analysis
Table 2 Global Electronic Music Market Companies with Areas Served
Table 3 Products Offerings Global Electronic Music Market
Table 4 Low Growth Scenario Forecasts
Table 5 Reference Case Growth Scenario
Table 6 High Growth Case Scenario
Table 7 Global Electronic Music Revenue (USD Million) And CAGR (%) By Type (2018-2030)
Table 8 Global Electronic Music Revenue (USD Million) And CAGR (%) By Applications (2018-2030)
Table 9 Global Electronic Music Revenue (USD Million) And CAGR (%) By Regions (2018-2030)
Table 10 Global Electronic Music Revenue (USD Million) By Type (2018-2022)
Table 11 Global Electronic Music Revenue Market Share (%) By Type (2018-2022)
Table 12 Global Electronic Music Revenue (USD Million) By Applications (2018-2022)
Table 13 Global Electronic Music Revenue Market Share (%) By Applications (2018-2022)
Table 14 Global Electronic Music Market Revenue (USD Million) By Regions (2018-2022)
Table 15 Global Electronic Music Market Share (%) By Regions (2018-2022)
Table 16 North America Electronic Music Revenue (USD Million) By Country (2018-2022)
Table 17 North America Electronic Music Revenue (USD Million) By Type (2018-2022)
Table 18 North America Electronic Music Revenue (USD Million) By Applications (2018-2022)
Table 19 Europe Electronic Music Revenue (USD Million) By Country (2018-2022)
Table 20 Europe Electronic Music Revenue (USD Million) By Type (2018-2022)
Table 21 Europe Electronic Music Revenue (USD Million) By Applications (2018-2022)
Table 22 Asia Pacific Electronic Music Revenue (USD Million) By Country (2018-2022)
Table 23 Asia Pacific Electronic Music Revenue (USD Million) By Type (2018-2022)
Table 24 Asia Pacific Electronic Music Revenue (USD Million) By Applications (2018-2022)
Table 25 South America Electronic Music Revenue (USD Million) By Country (2018-2022)
Table 26 South America Electronic Music Revenue (USD Million) By Type (2018-2022)
Table 27 South America Electronic Music Revenue (USD Million) By Applications (2018-2022)
Table 28 Middle East and Africa Electronic Music Revenue (USD Million) By Region (2018-2022)
Table 29 Middle East and Africa Electronic Music Revenue (USD Million) By Type (2018-2022)
Table 30 Middle East and Africa Electronic Music Revenue (USD Million) By Applications (2018-2022)
Table 31 Financial Analysis
Table 32 Global Electronic Music Revenue (USD Million) By Type (2023-2030)
Table 33 Global Electronic Music Revenue Market Share (%) By Type (2023-2030)
Table 34 Global Electronic Music Revenue (USD Million) By Applications (2023-2030)
Table 35 Global Electronic Music Revenue Market Share (%) By Applications (2023-2030)
Table 36 Global Electronic Music Market Revenue (USD Million), And Revenue (USD Million) By Regions (2023-2030)
Table 37 North America Electronic Music Revenue (USD)By Country (2023-2030)
Table 38 North America Electronic Music Revenue (USD Million) By Type (2023-2030)
Table 39 North America Electronic Music Revenue (USD Million) By Applications (2023-2030)
Table 40 Europe Electronic Music Revenue (USD Million) By Country (2023-2030)
Table 41 Europe Electronic Music Revenue (USD Million) By Type (2023-2030)
Table 42 Europe Electronic Music Revenue (USD Million) By Applications (2023-2030)
Table 43 Asia Pacific Electronic Music Revenue (USD Million) By Country (2023-2030)
Table 44 Asia Pacific Electronic Music Revenue (USD Million) By Type (2023-2030)
Table 45 Asia Pacific Electronic Music Revenue (USD Million) By Applications (2023-2030)
Table 46 South America Electronic Music Revenue (USD Million) By Country (2023-2030)
Table 47 South America Electronic Music Revenue (USD Million) By Type (2023-2030)
Table 48 South America Electronic Music Revenue (USD Million) By Applications (2023-2030)
Table 49 Middle East and Africa Electronic Music Revenue (USD Million) By Region (2023-2030)
Table 50 Middle East and Africa Electronic Music Revenue (USD Million) By Region (2023-2030)
Table 51 Middle East and Africa Electronic Music Revenue (USD Million) By Type (2023-2030)
Table 52 Middle East and Africa Electronic Music Revenue (USD Million) By Applications (2023-2030)
Table 53 Research Programs/Design for This Report
Table 54 Key Data Information from Secondary Sources
Table 55 Key Data Information from Primary Sources
List of Figures
Figure 1 Market Scope
Figure 2 Porter’s Five Forces
Figure 3 Global Electronic Music Revenue (USD Million) By Type (2018-2022)
Figure 4 Global Electronic Music Revenue Market Share (%) By Type (2022)
Figure 5 Global Electronic Music Revenue (USD Million) By Applications (2018-2022)
Figure 6 Global Electronic Music Revenue Market Share (%) By Applications (2022)
Figure 7 Global Electronic Music Market Revenue (USD Million) By Regions (2018-2022)
Figure 8 Global Electronic Music Market Share (%) By Regions (2022)
Figure 9 North America Electronic Music Revenue (USD Million) By Country (2018-2022)
Figure 10 North America Electronic Music Revenue (USD Million) By Type (2018-2022)
Figure 11 North America Electronic Music Revenue (USD Million) By Applications (2018-2022)
Figure 12 Europe Electronic Music Revenue (USD Million) By Country (2018-2022)
Figure 13 Europe Electronic Music Revenue (USD Million) By Type (2018-2022)
Figure 14 Europe Electronic Music Revenue (USD Million) By Applications (2018-2022)
Figure 15 Asia Pacific Electronic Music Revenue (USD Million) By Country (2018-2022)
Figure 16 Asia Pacific Electronic Music Revenue (USD Million) By Type (2018-2022)
Figure 17 Asia Pacific Electronic Music Revenue (USD Million) By Applications (2018-2022)
Figure 18 South America Electronic Music Revenue (USD Million) By Country (2018-2022)
Figure 19 South America Electronic Music Revenue (USD Million) By Type (2018-2022)
Figure 20 South America Electronic Music Revenue (USD Million) By Applications (2018-2022)
Figure 21 Middle East and Africa Electronic Music Revenue (USD Million) By Region (2018-2022)
Figure 22 Middle East and Africa Electronic Music Revenue (USD Million) By Type (2018-2022)
Figure 23 Middle East and Africa Electronic Music Revenue (USD Million) By Applications (2018-2022)
Figure 24 Global Electronic Music Revenue (USD Million) By Type (2023-2030)
Figure 25 Global Electronic Music Revenue Market Share (%) By Type (2030)
Figure 26 Global Electronic Music Revenue (USD Million) By Applications (2023-2030)
Figure 27 Global Electronic Music Revenue Market Share (%) By Applications (2030)
Figure 28 Global Electronic Music Market Revenue (USD Million) By Regions (2023-2030)
Figure 29 North America Electronic Music Revenue (USD Million) By Country (2023-2030)
Figure 30 North America Electronic Music Revenue (USD Million) By Type (2023-2030)
Figure 31 North America Electronic Music Revenue (USD Million) By Applications (2023-2030)
Figure 32 Europe Electronic Music Revenue (USD Million) By Country (2023-2030)
Figure 33 Europe Electronic Music Revenue (USD Million) By Type (2023-2030)
Figure 34 Europe Electronic Music Revenue (USD Million) By Applications (2023-2030)
Figure 35 Asia Pacific Electronic Music Revenue (USD Million) By Country (2023-2030)
Figure 36 Asia Pacific Electronic Music Revenue (USD Million) By Type (2023-2030)
Figure 37 Asia Pacific Electronic Music Revenue (USD Million) By Applications (2023-2030)
Figure 38 South America Electronic Music Revenue (USD Million) By Country (2023-2030)
Figure 39 South America Electronic Music Revenue (USD Million) By Type (2023-2030)
Figure 40 South America Electronic Music Revenue (USD Million) By Applications (2023-2030)
Figure 41 Middle East and Africa Electronic Music Revenue (USD Million) By Region (2023-2030)
Figure 42 Middle East and Africa Electronic Music Revenue (USD Million) By Region (2023-2030)
Figure 43 Middle East and Africa Electronic Music Revenue (USD Million) By Type (2023-2030)
Figure 44 Middle East and Africa Electronic Music Revenue (USD Million) By Applications (2023-2030)
Figure 45 Bottom-Up and Top-Down Approaches For This Report
Figure 46 Data Triangulation
