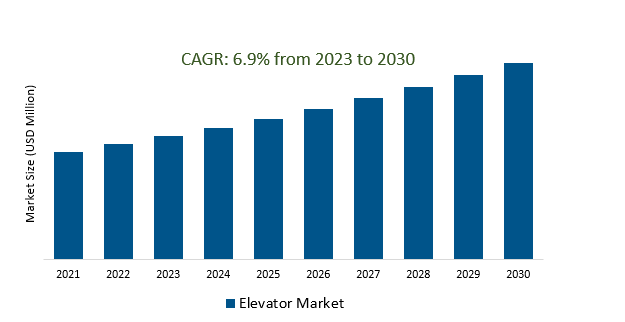
The Global Elevator Market Size is estimated to register 6.9% growth over the forecast period from 2023 to 2030.
Elevator Market Overview
The rapid pace of urbanization, coupled with the construction of high-rise buildings and mega-cities, is a significant driver for the Elevator Market. Elevators are increasingly incorporating smart and connected technologies, which utilize IoT (Internet of Things) devices, sensors, and data analytics to offer predictive maintenance, improved efficiency, and enhanced safety features, driving the market growth. Manufacturers are developing elevators with regenerative drives, LED lighting, energy-efficient motors, and standby mode features to reduce power consumption, lower operational costs, and meet environmental standards. Elevators play a crucial role in providing mobility for elderly and disabled individuals which is contributing to the growth in demand.
Elevator Market Dynamics
Market Trends- Urbanization and Infrastructure Development is driving the market.
Constructing tall buildings in urban areas to accommodate increasing populations fuels the demand for advanced vertical transportation solutions. Elevator systems with connectivity features are contributing to the efficiency and sustainability of smart buildings, promoting seamless mobility and energy conservation is fueling the demand. Further, the concept of transit-oriented development emphasizes compact, walkable communities centered around public transportation hubs. Additionally, manufacturers are designing energy-efficient systems with regenerative drives, eco-friendly materials, and standby mode features to align with green building certifications.
Market Driver- Adoption of smart solutions significantly drives innovation and growth within the Elevator Market.
Touchless controls, biometric authentication, and destination dispatch systems enhance passenger convenience and security are the key factors.
The implementation of predictive maintenance solutions using IoT-connected sensors and data analytics is enabling proactive monitoring of elevator health before they lead to breakdowns and is driving the market growth. AI-driven algorithms are analyzing data patterns to optimize elevator dispatching, reduce wait times, and improve traffic flow within buildings, thereby increasing the market growth.
Market Opportunity- Rising adoption of Machine Room Less (MRL) elevators is increasing the demand.
Space-saving design and lower installation costs are the key factors driving the market growth. Architects and developers are opting for MRL elevators due to their compact design, enabling greater flexibility in building construction and space utilization, especially in modern urban development’s where space is at a premium. By utilizing compact gearless traction systems and employing regenerative drives, MRL elevators are minimizing energy consumption compared to traditional traction elevators with separate machine rooms. The absence of a dedicated machine room reduces construction and installation costs, making MRL elevators an attractive choice for developers and building owners. Additionally, flexibility in installation, allowing for easier retrofitting in existing buildings is driving the market.
Market Share Analysis- Traction elevator will register the fastest growth.
The Global Elevator market is analyzed across Hydraulic, Traction, Machine Room-Less Traction & Others. Traction elevators are poised to register the fastest growth. Machine Room-Less (MRL) Traction elevators have been gaining prominence due to their advantages in terms of space efficiency, energy savings, and suitability for modern high-rise buildings. These elevators eliminate the need for a separate machine room, utilizing compact gearless traction systems and regenerative drives to save space and energy. Their popularity is driven by the increasing construction of tall buildings and the demand for energy-efficient, high-performance elevator systems. y incorporating permanent magnet motors and regenerative drives, these elevators optimize energy consumption, aligning with sustainability objectives and green building certifications.
Market Share Analysis- Residential held a significant market share in 2023.
The Global Elevator market is analyzed across various applications including Residential, Commercial & Industrial. Of these, Residential held a significant market share in 2023. Elevators are becoming a necessity rather than a luxury, offering convenience and accessibility for occupants, especially in taller buildings where climbing multiple flights of stairs is impractical. With a growing number of elderly individuals and people with mobility challenges, residential elevators provide essential accessibility features, allowing inhabitants to move easily between floors and enhancing their quality of life is driving the demand. Additionally, smart home integration allows for convenient elevator operation through smartphone apps or home automation systems. Residential elevators prioritize safety features such as emergency brakes, door interlocks, and backup power systems. Additionally, manufacturers are focusing on providing smooth rides and quiet operation, ensuring that residents experience comfort and reliability while using the elevators within their homes.
Elevator Market Segmentation
By Type
- Hydraulic
- Traction
- Machine Room-Less Traction
- Others
By Business
- New Equipment
- Maintenance
- Modernization
By Application
- Residential
- Commercial
- Industrial
By Region
- North America (United States, Canada, Mexico)
- Europe (Germany, France, United Kingdom, Spain, Italy, Others)
- Asia Pacific (China, India, Japan, South Korea, Australia, Others)
- Latin America (Brazil, Argentina, Others)
- Middle East and Africa (Saudi Arabia, UAE, Kuwait, Other Middle East, South Africa, Nigeria, Other Africa)
Elevator Market Companies
- TK Elevator
- Schindler
- KONE Corporation
- Hitachi Ltd
- Hyundai Elevator Co Ltd
- Mitsubishi Electric Corporation
- Toshiba Group
- Fujitec Co Ltd
- Aritco Lift AB
- Canny Elevator Co Ltd
- Sigma Elevator Company
- Schumacher Elevator Company
- ESCON Elevators Pvt Limited
- Electra Elevators
*List not exhaustive
Elevator Market Outlook 2023
1 Market Overview
1.1 Introduction to the Elevator Market
1.2 Scope of the Study
1.3 Research Objective
1.3.1 Key Market Scope and Segments
1.3.2 Players Covered
1.3.3 Years Considered
2 Executive Summary
2.1 2023 Elevator Industry- Market Statistics
3 Market Dynamics
3.1 Market Drivers
3.2 Market Challenges
3.3 Market Opportunities
3.4 Market Trends
4 Market Factor Analysis
4.1 Porter’s Five Forces
4.2 Market Entropy
4.2.1 Global Elevator Market Companies with Area Served
4.2.2 Products Offerings Global Elevator Market
5 COVID-19 Impact Analysis and Outlook Scenarios
5.1.1 Covid-19 Impact Analysis
5.1.2 post-COVID-19 Scenario- Low Growth Case
5.1.3 post-COVID-19 Scenario- Reference Growth Case
5.1.4 post-COVID-19 Scenario- Low Growth Case
6 Global Elevator Market Trends
6.1 Global Elevator Revenue (USD Million) and CAGR (%) by Type (2018-2030)
6.2 Global Elevator Revenue (USD Million) and CAGR (%) by Applications (2018-2030)
6.3 Global Elevator Revenue (USD Million) and CAGR (%) by regions (2018-2030)
7 Global Elevator Market Revenue (USD Million) by Type, and Applications (2018-2022)
7.1 Global Elevator Revenue (USD Million) by Type (2018-2022)
7.1.1 Global Elevator Revenue (USD Million), Market Share (%) by Type (2018-2022)
7.2 Global Elevator Revenue (USD Million) by Applications (2018-2022)
7.2.1 Global Elevator Revenue (USD Million), Market Share (%) by Applications (2018-2022)
8 Global Elevator Development Regional Status and Outlook
8.1 Global Elevator Revenue (USD Million) By Regions (2018-2022)
8.2 North America Elevator Revenue (USD Million) by Type, and Application (2018-2022)
8.2.1 North America Elevator Revenue (USD Million) by Country (2018-2022)
8.2.2 North America Elevator Revenue (USD Million) by Type (2018-2022)
8.2.3 North America Elevator Revenue (USD Million) by Applications (2018-2022)
8.3 Europe Elevator Revenue (USD Million), by Type, and Applications (USD Million) (2018-2022)
8.3.1 Europe Elevator Revenue (USD Million), by Country (2018-2022)
8.3.2 Europe Elevator Revenue (USD Million) by Type (2018-2022)
8.3.3 Europe Elevator Revenue (USD Million) by Applications (2018-2022)
8.4 Asia Pacific Elevator Revenue (USD Million), and Revenue (USD Million) by Type, and Applications (2018-2022)
8.4.1 Asia Pacific Elevator Revenue (USD Million) by Country (2018-2022)
8.4.2 Asia Pacific Elevator Revenue (USD Million) by Type (2018-2022)
8.4.3 Asia Pacific Elevator Revenue (USD Million) by Applications (2018-2022)
8.5 South America Elevator Revenue (USD Million), by Type, and Applications (2018-2022)
8.5.1 South America Elevator Revenue (USD Million), by Country (2018-2022)
8.5.2 South America Elevator Revenue (USD Million) by Type (2018-2022)
8.5.3 South America Elevator Revenue (USD Million) by Applications (2018-2022)
8.6 Middle East and Africa Elevator Revenue (USD Million), by Type, Technology, Application, Thickness (2018-2022)
8.6.1 Middle East and Africa Elevator Revenue (USD Million) by Country (2018-2022)
8.6.2 Middle East and Africa Elevator Revenue (USD Million) by Type (2018-2022)
8.6.3 Middle East and Africa Elevator Revenue (USD Million) by Applications (2018-2022)
9 Company Profiles
10 Global Elevator Market Revenue (USD Million), by Type, and Applications (2023-2030)
10.1 Global Elevator Revenue (USD Million) and Market Share (%) by Type (2023-2030)
10.1.1 Global Elevator Revenue (USD Million), and Market Share (%) by Type (2023-2030)
10.2 Global Elevator Revenue (USD Million) and Market Share (%) by Applications (2023-2030)
10.2.1 Global Elevator Revenue (USD Million), and Market Share (%) by Applications (2023-2030)
11 Global Elevator Development Regional Status and Outlook Forecast
11.1 Global Elevator Revenue (USD Million) By Regions (2023-2030)
11.2 North America Elevator Revenue (USD Million) by Type, and Applications (2023-2030)
11.2.1 North America Elevator Revenue (USD) Million by Country (2023-2030)
11.2.2 North America Elevator Revenue (USD Million), by Type (2023-2030)
11.2.3 North America Elevator Revenue (USD Million), Market Share (%) by Applications (2023-2030)
11.3 Europe Elevator Revenue (USD Million), by Type, and Applications (2023-2030)
11.3.1 Europe Elevator Revenue (USD Million), by Country (2023-2030)
11.3.2 Europe Elevator Revenue (USD Million), by Type (2023-2030)
11.3.3 Europe Elevator Revenue (USD Million), by Applications (2023-2030)
11.4 Asia Pacific Elevator Revenue (USD Million) by Type, and Applications (2023-2030)
11.4.1 Asia Pacific Elevator Revenue (USD Million), by Country (2023-2030)
11.4.2 Asia Pacific Elevator Revenue (USD Million), by Type (2023-2030)
11.4.3 Asia Pacific Elevator Revenue (USD Million), by Applications (2023-2030)
11.5 South America Elevator Revenue (USD Million), by Type, and Applications (2023-2030)
11.5.1 South America Elevator Revenue (USD Million), by Country (2023-2030)
11.5.2 South America Elevator Revenue (USD Million), by Type (2023-2030)
11.5.3 South America Elevator Revenue (USD Million), by Applications (2023-2030)
11.6 Middle East and Africa Elevator Revenue (USD Million), by Type, and Applications (2023-2030)
11.6.1 Middle East and Africa Elevator Revenue (USD Million), by region (2023-2030)
11.6.2 Middle East and Africa Elevator Revenue (USD Million), by Type (2023-2030)
11.6.3 Middle East and Africa Elevator Revenue (USD Million), by Applications (2023-2030)
12 Methodology and Data Sources
12.1 Methodology/Research Approach
12.1.1 Research Programs/Design
12.1.2 Market Size Estimation
12.1.3 Market Breakdown and Data Triangulation
12.2 Data Sources
12.2.1 Secondary Sources
12.2.2 Primary Sources
12.3 Disclaimer
List of Tables
Table 1 Market Segmentation Analysis
Table 2 Global Elevator Market Companies with Areas Served
Table 3 Products Offerings Global Elevator Market
Table 4 Low Growth Scenario Forecasts
Table 5 Reference Case Growth Scenario
Table 6 High Growth Case Scenario
Table 7 Global Elevator Revenue (USD Million) And CAGR (%) By Type (2018-2030)
Table 8 Global Elevator Revenue (USD Million) And CAGR (%) By Applications (2018-2030)
Table 9 Global Elevator Revenue (USD Million) And CAGR (%) By Regions (2018-2030)
Table 10 Global Elevator Revenue (USD Million) By Type (2018-2022)
Table 11 Global Elevator Revenue Market Share (%) By Type (2018-2022)
Table 12 Global Elevator Revenue (USD Million) By Applications (2018-2022)
Table 13 Global Elevator Revenue Market Share (%) By Applications (2018-2022)
Table 14 Global Elevator Market Revenue (USD Million) By Regions (2018-2022)
Table 15 Global Elevator Market Share (%) By Regions (2018-2022)
Table 16 North America Elevator Revenue (USD Million) By Country (2018-2022)
Table 17 North America Elevator Revenue (USD Million) By Type (2018-2022)
Table 18 North America Elevator Revenue (USD Million) By Applications (2018-2022)
Table 19 Europe Elevator Revenue (USD Million) By Country (2018-2022)
Table 20 Europe Elevator Revenue (USD Million) By Type (2018-2022)
Table 21 Europe Elevator Revenue (USD Million) By Applications (2018-2022)
Table 22 Asia Pacific Elevator Revenue (USD Million) By Country (2018-2022)
Table 23 Asia Pacific Elevator Revenue (USD Million) By Type (2018-2022)
Table 24 Asia Pacific Elevator Revenue (USD Million) By Applications (2018-2022)
Table 25 South America Elevator Revenue (USD Million) By Country (2018-2022)
Table 26 South America Elevator Revenue (USD Million) By Type (2018-2022)
Table 27 South America Elevator Revenue (USD Million) By Applications (2018-2022)
Table 28 Middle East and Africa Elevator Revenue (USD Million) By Region (2018-2022)
Table 29 Middle East and Africa Elevator Revenue (USD Million) By Type (2018-2022)
Table 30 Middle East and Africa Elevator Revenue (USD Million) By Applications (2018-2022)
Table 31 Financial Analysis
Table 32 Global Elevator Revenue (USD Million) By Type (2023-2030)
Table 33 Global Elevator Revenue Market Share (%) By Type (2023-2030)
Table 34 Global Elevator Revenue (USD Million) By Applications (2023-2030)
Table 35 Global Elevator Revenue Market Share (%) By Applications (2023-2030)
Table 36 Global Elevator Market Revenue (USD Million), And Revenue (USD Million) By Regions (2023-2030)
Table 37 North America Elevator Revenue (USD)By Country (2023-2030)
Table 38 North America Elevator Revenue (USD Million) By Type (2023-2030)
Table 39 North America Elevator Revenue (USD Million) By Applications (2023-2030)
Table 40 Europe Elevator Revenue (USD Million) By Country (2023-2030)
Table 41 Europe Elevator Revenue (USD Million) By Type (2023-2030)
Table 42 Europe Elevator Revenue (USD Million) By Applications (2023-2030)
Table 43 Asia Pacific Elevator Revenue (USD Million) By Country (2023-2030)
Table 44 Asia Pacific Elevator Revenue (USD Million) By Type (2023-2030)
Table 45 Asia Pacific Elevator Revenue (USD Million) By Applications (2023-2030)
Table 46 South America Elevator Revenue (USD Million) By Country (2023-2030)
Table 47 South America Elevator Revenue (USD Million) By Type (2023-2030)
Table 48 South America Elevator Revenue (USD Million) By Applications (2023-2030)
Table 49 Middle East and Africa Elevator Revenue (USD Million) By Region (2023-2030)
Table 50 Middle East and Africa Elevator Revenue (USD Million) By Region (2023-2030)
Table 51 Middle East and Africa Elevator Revenue (USD Million) By Type (2023-2030)
Table 52 Middle East and Africa Elevator Revenue (USD Million) By Applications (2023-2030)
Table 53 Research Programs/Design for This Report
Table 54 Key Data Information from Secondary Sources
Table 55 Key Data Information from Primary Sources
List of Figures
Figure 1 Market Scope
Figure 2 Porter’s Five Forces
Figure 3 Global Elevator Revenue (USD Million) By Type (2018-2022)
Figure 4 Global Elevator Revenue Market Share (%) By Type (2022)
Figure 5 Global Elevator Revenue (USD Million) By Applications (2018-2022)
Figure 6 Global Elevator Revenue Market Share (%) By Applications (2022)
Figure 7 Global Elevator Market Revenue (USD Million) By Regions (2018-2022)
Figure 8 Global Elevator Market Share (%) By Regions (2022)
Figure 9 North America Elevator Revenue (USD Million) By Country (2018-2022)
Figure 10 North America Elevator Revenue (USD Million) By Type (2018-2022)
Figure 11 North America Elevator Revenue (USD Million) By Applications (2018-2022)
Figure 12 Europe Elevator Revenue (USD Million) By Country (2018-2022)
Figure 13 Europe Elevator Revenue (USD Million) By Type (2018-2022)
Figure 14 Europe Elevator Revenue (USD Million) By Applications (2018-2022)
Figure 15 Asia Pacific Elevator Revenue (USD Million) By Country (2018-2022)
Figure 16 Asia Pacific Elevator Revenue (USD Million) By Type (2018-2022)
Figure 17 Asia Pacific Elevator Revenue (USD Million) By Applications (2018-2022)
Figure 18 South America Elevator Revenue (USD Million) By Country (2018-2022)
Figure 19 South America Elevator Revenue (USD Million) By Type (2018-2022)
Figure 20 South America Elevator Revenue (USD Million) By Applications (2018-2022)
Figure 21 Middle East and Africa Elevator Revenue (USD Million) By Region (2018-2022)
Figure 22 Middle East and Africa Elevator Revenue (USD Million) By Type (2018-2022)
Figure 23 Middle East and Africa Elevator Revenue (USD Million) By Applications (2018-2022)
Figure 24 Global Elevator Revenue (USD Million) By Type (2023-2030)
Figure 25 Global Elevator Revenue Market Share (%) By Type (2030)
Figure 26 Global Elevator Revenue (USD Million) By Applications (2023-2030)
Figure 27 Global Elevator Revenue Market Share (%) By Applications (2030)
Figure 28 Global Elevator Market Revenue (USD Million) By Regions (2023-2030)
Figure 29 North America Elevator Revenue (USD Million) By Country (2023-2030)
Figure 30 North America Elevator Revenue (USD Million) By Type (2023-2030)
Figure 31 North America Elevator Revenue (USD Million) By Applications (2023-2030)
Figure 32 Europe Elevator Revenue (USD Million) By Country (2023-2030)
Figure 33 Europe Elevator Revenue (USD Million) By Type (2023-2030)
Figure 34 Europe Elevator Revenue (USD Million) By Applications (2023-2030)
Figure 35 Asia Pacific Elevator Revenue (USD Million) By Country (2023-2030)
Figure 36 Asia Pacific Elevator Revenue (USD Million) By Type (2023-2030)
Figure 37 Asia Pacific Elevator Revenue (USD Million) By Applications (2023-2030)
Figure 38 South America Elevator Revenue (USD Million) By Country (2023-2030)
Figure 39 South America Elevator Revenue (USD Million) By Type (2023-2030)
Figure 40 South America Elevator Revenue (USD Million) By Applications (2023-2030)
Figure 41 Middle East and Africa Elevator Revenue (USD Million) By Region (2023-2030)
Figure 42 Middle East and Africa Elevator Revenue (USD Million) By Region (2023-2030)
Figure 43 Middle East and Africa Elevator Revenue (USD Million) By Type (2023-2030)
Figure 44 Middle East and Africa Elevator Revenue (USD Million) By Applications (2023-2030)
Figure 45 Bottom-Up and Top-Down Approaches for This Report
Figure 46 Data Triangulation
