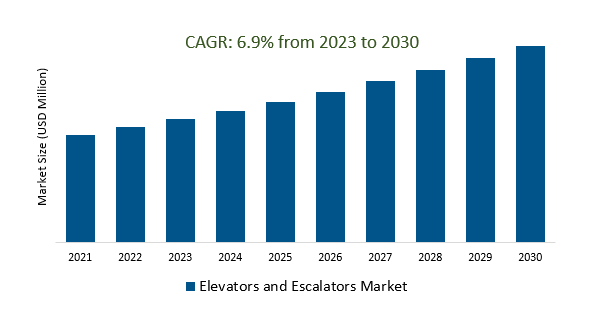
The Global Elevators and Escalators Market Size is estimated to register 6.9% growth over the forecast period from 2023 to 2030.
The market growth is driven by the increasing awareness of the importance of accessibility for people with disabilities is driving demand for elevators and escalators that meet or exceed accessibility standards. Leading companies that are focused on Energy Efficiency and Sustainability, Smart Buildings and IoT Integration, Urbanization and High-Rise Construction, Safety and Accessibility, Maintenance as a Service, Market Consolidation, and others to boost market shares in the industry.
Market Overview
The Elevators and Escalators Market is a global industry encompassing the production, installation, and maintenance of vertical transportation systems in various applications. Urbanization, stringent safety regulations, and the need to modernize aging infrastructure have been key drivers of market growth. Elevators are used for passenger and freight transportation, while escalators serve commercial and public spaces. Notable market players include Otis, KONE, Schindler, and Thyssenkrupp. Future growth is anticipated through technological advancements, sustainability concerns, and the ongoing demand for vertical transportation in urban areas.
Market Dynamics
Market Trends- Aging infrastructure is driving demand for elevator and escalator replacement
Aging infrastructure is a major driver for elevator and escalator replacement. As buildings and facilities grow older, their existing vertical transportation systems become outdated and may not meet modern safety and efficiency standards. This creates a demand for modernization or complete replacement of elevators and escalators to ensure compliance and maintain safety. This trend offers opportunities for manufacturers and service providers to retrofit or replace older systems in various types of buildings, including commercial, residential, and public spaces, contributing to market growth.
Market Driver- The growing demand for smart elevators and escalators is driving growth in the elevators and escalators market
The elevators and escalators market is experiencing growth due to the increasing demand for smart systems. Smart elevators and escalators incorporate advanced technologies like IoT connectivity, predictive maintenance, energy efficiency, and enhanced security. They offer improved user experiences and cost-effective operation. The rising adoption of these smart solutions by building owners and operators looking to optimize efficiency and safety is a major driver of market expansion.
Market Opportunity-Introduction of Technological Advancements
Technological advancements in the Elevators and Escalators Market are transforming the industry. These innovations include IoT integration for real-time monitoring and predictive maintenance, smart controls with AI-driven optimization, energy-efficient components, touchless controls for hygiene, destination dispatch systems for reduced wait times, remote monitoring for proactive maintenance, sustainability features, advanced safety enhancements, customization options, multi-use elevators, and exploration of vertical mobility solutions.
Market Share Analysis- Elevators Elevators and Escalators Market will register the fastest growth
The Global Elevators and Escalators Market is analyzed across Elevators, Escalators, Moving walkways, and others. Elevators are poised to register the fastest growth. The Elevators and Escalators Market involves the production, installation, and maintenance of vertical transportation systems in various settings. Key drivers include urbanization, safety regulations, and technological advancements. Leading companies in the sector include Otis, KONE, Schindler, Thyssenkrupp, and Mitsubishi Electric. Demand for smart systems, energy efficiency, and sustainability is influencing the market's future direction.
Market Share Analysis- Repair and Maintenance held a significant market share in 2023
The Global Elevators and Escalators Market is analyzed across various Services including New Installation, Repair and Maintenance, Modernization, and others. Of these, Repair and Maintenance held a significant market share in 2023. The Repair and Maintenance segment of the Elevators and Escalators Market focuses on servicing and maintaining vertical transportation systems to ensure their safe and efficient operation in various settings. Key drivers include aging infrastructure, regulatory compliance, and the need for passenger safety. Service providers offer routine maintenance, emergency repairs, and modernization services to keep these systems in optimal condition and enhance their safety features, aligning with industry standards.
Elevators and Escalators Market Segmentation
By Type
- Elevators
- Escalators
- Moving walkways
By Service
- New installation
- Repair and Maintenance
- Modernization
By Elevator Technology
- Traction
- Machine Room Less traction elevator
- Hydraulic
By End-User
- Residential
- Commercial
- Institutional
- Infrastructure
- Others
By Region
- North America (United States, Canada, Mexico)
- Europe (Germany, France, United Kingdom, Spain, Italy, Others)
- Asia Pacific (China, India, Japan, South Korea, Australia, Others)
- Latin America (Brazil, Argentina, Others)
- Middle East and Africa (Saudi Arabia, UAE, Kuwait, Other Middle East, South Africa, Nigeria, Other Africa)
Elevators and Escalators Market Companies
- Otis Elevator
- Schindler Group
- Mitsubishi Electric Corp
- Thyssenkrupp AG
- KONE Corporation
- Kohler Co
- Hitachi Ltd
- Fuji Elevators Co
- Braun Elevator
- Brobeil Aufzuge GmbH and Co.KG
- ESCON Elevators Pvt Ltd
- HIRO LIFT Hillenkotter and Ronsieck GmbH
- Hyundai Elevator Co. Ltd.
- thyssenkrupp AG
- Toshiba Corp
- Weidmuller Interface GmbH and Co. KG
- WITTUR HOLDING GmbH
- SCHAEFER GmbH
- Savaria Corp
*List not exhaustive
Elevators and Escalators Market Outlook 2023
1 Market Overview
1.1 Introduction to the Elevators and Escalators Market
1.2 Scope of the Study
1.3 Research Objective
1.3.1 Key Market Scope and Segments
1.3.2 Players Covered
1.3.3 Years Considered
2 Executive Summary
2.1 2023 Elevators and Escalators Industry- Market Statistics
3 Market Dynamics
3.1 Market Drivers
3.2 Market Challenges
3.3 Market Opportunities
3.4 Market Trends
4 Market Factor Analysis
4.1 Porter’s Five Forces
4.2 Market Entropy
4.2.1 Global Elevators and Escalators Market Companies with Area Served
4.2.2 Products Offerings Global Elevators and Escalators Market
5 COVID-19 Impact Analysis and Outlook Scenarios
5.1.1 Covid-19 Impact Analysis
5.1.2 Post-COVID-19 Scenario- Low Growth Case
5.1.3 Post-COVID-19 Scenario- Reference Growth Case
5.1.4 Post-COVID-19 Scenario- Low Growth Case
6 Global Elevators and Escalators Market Trends
6.1 Global Elevators and Escalators Revenue (USD Million) and CAGR (%) by Type (2018-2030)
6.2 Global Elevators and Escalators Revenue (USD Million) and CAGR (%) by Applications (2018-2030)
6.3 Global Elevators and Escalators Revenue (USD Million) and CAGR (%) by Regions (2018-2030)
7 Global Elevators and Escalators Market Revenue (USD Million) by Type, and Applications (2018-2022)
7.1 Global Elevators and Escalators Revenue (USD Million) by Type (2018-2022)
7.1.1 Global Elevators and Escalators Revenue (USD Million), Market Share (%) by Type (2018-2022)
7.2 Global Elevators and Escalators Revenue (USD Million) by Applications (2018-2022)
7.2.1 Global Elevators and Escalators Revenue (USD Million), Market Share (%) by Applications (2018-2022)
8 Global Elevators and Escalators Development Regional Status and Outlook
8.1 Global Elevators and Escalators Revenue (USD Million) By Regions (2018-2022)
8.2 North America Elevators and Escalators Revenue (USD Million) by Type, and Application (2018-2022)
8.2.1 North America Elevators and Escalators Revenue (USD Million) by Country (2018-2022)
8.2.2 North America Elevators and Escalators Revenue (USD Million) by Type (2018-2022)
8.2.3 North America Elevators and Escalators Revenue (USD Million) by Applications (2018-2022)
8.3 Europe Elevators and Escalators Revenue (USD Million), by Type, and Applications (USD Million) (2018-2022)
8.3.1 Europe Elevators and Escalators Revenue (USD Million), by Country (2018-2022)
8.3.2 Europe Elevators and Escalators Revenue (USD Million) by Type (2018-2022)
8.3.3 Europe Elevators and Escalators Revenue (USD Million) by Applications (2018-2022)
8.4 Asia Pacific Elevators and Escalators Revenue (USD Million), and Revenue (USD Million) by Type, and Applications (2018-2022)
8.4.1 Asia Pacific Elevators and Escalators Revenue (USD Million) by Country (2018-2022)
8.4.2 Asia Pacific Elevators and Escalators Revenue (USD Million) by Type (2018-2022)
8.4.3 Asia Pacific Elevators and Escalators Revenue (USD Million) by Applications (2018-2022)
8.5 South America Elevators and Escalators Revenue (USD Million), by Type, and Applications (2018-2022)
8.5.1 South America Elevators and Escalators Revenue (USD Million), by Country (2018-2022)
8.5.2 South America Elevators and Escalators Revenue (USD Million) by Type (2018-2022)
8.5.3 South America Elevators and Escalators Revenue (USD Million) by Applications (2018-2022)
8.6 Middle East and Africa Elevators and Escalators Revenue (USD Million), by Type, Technology, Application, Thickness (2018-2022)
8.6.1 Middle East and Africa Elevators and Escalators Revenue (USD Million) by Country (2018-2022)
8.6.2 Middle East and Africa Elevators and Escalators Revenue (USD Million) by Type (2018-2022)
8.6.3 Middle East and Africa Elevators and Escalators Revenue (USD Million) by Applications (2018-2022)
9 Company Profiles
10 Global Elevators and Escalators Market Revenue (USD Million), by Type, and Applications (2023-2030)
10.1 Global Elevators and Escalators Revenue (USD Million) and Market Share (%) by Type (2023-2030)
10.1.1 Global Elevators and Escalators Revenue (USD Million), and Market Share (%) by Type (2023-2030)
10.2 Global Elevators and Escalators Revenue (USD Million) and Market Share (%) by Applications (2023-2030)
10.2.1 Global Elevators and Escalators Revenue (USD Million), and Market Share (%) by Applications (2023-2030)
11 Global Elevators and Escalators Development Regional Status and Outlook Forecast
11.1 Global Elevators and Escalators Revenue (USD Million) By Regions (2023-2030)
11.2 North America Elevators and Escalators Revenue (USD Million) by Type, and Applications (2023-2030)
11.2.1 North America Elevators and Escalators Revenue (USD) Million by Country (2023-2030)
11.2.2 North America Elevators and Escalators Revenue (USD Million), by Type (2023-2030)
11.2.3 North America Elevators and Escalators Revenue (USD Million), Market Share (%) by Applications (2023-2030)
11.3 Europe Elevators and Escalators Revenue (USD Million), by Type, and Applications (2023-2030)
11.3.1 Europe Elevators and Escalators Revenue (USD Million), by Country (2023-2030)
11.3.2 Europe Elevators and Escalators Revenue (USD Million), by Type (2023-2030)
11.3.3 Europe Elevators and Escalators Revenue (USD Million), by Applications (2023-2030)
11.4 Asia Pacific Elevators and Escalators Revenue (USD Million) by Type, and Applications (2023-2030)
11.4.1 Asia Pacific Elevators and Escalators Revenue (USD Million), by Country (2023-2030)
11.4.2 Asia Pacific Elevators and Escalators Revenue (USD Million), by Type (2023-2030)
11.4.3 Asia Pacific Elevators and Escalators Revenue (USD Million), by Applications (2023-2030)
11.5 South America Elevators and Escalators Revenue (USD Million), by Type, and Applications (2023-2030)
11.5.1 South America Elevators and Escalators Revenue (USD Million), by Country (2023-2030)
11.5.2 South America Elevators and Escalators Revenue (USD Million), by Type (2023-2030)
11.5.3 South America Elevators and Escalators Revenue (USD Million), by Applications (2023-2030)
11.6 Middle East and Africa Elevators and Escalators Revenue (USD Million), by Type, and Applications (2023-2030)
11.6.1 Middle East and Africa Elevators and Escalators Revenue (USD Million), by Region (2023-2030)
11.6.2 Middle East and Africa Elevators and Escalators Revenue (USD Million), by Type (2023-2030)
11.6.3 Middle East and Africa Elevators and Escalators Revenue (USD Million), by Applications (2023-2030)
12 Methodology and Data Sources
12.1 Methodology/Research Approach
12.1.1 Research Programs/Design
12.1.2 Market Size Estimation
12.1.3 Market Breakdown and Data Triangulation
12.2 Data Sources
12.2.1 Secondary Sources
12.2.2 Primary Sources
12.3 Disclaimer
List of Tables
Table 1 Market Segmentation Analysis
Table 2 Global Elevators and Escalators Market Companies with Areas Served
Table 3 Products Offerings Global Elevators and Escalators Market
Table 4 Low Growth Scenario Forecasts
Table 5 Reference Case Growth Scenario
Table 6 High Growth Case Scenario
Table 7 Global Elevators and Escalators Revenue (USD Million) And CAGR (%) By Type (2018-2030)
Table 8 Global Elevators and Escalators Revenue (USD Million) And CAGR (%) By Applications (2018-2030)
Table 9 Global Elevators and Escalators Revenue (USD Million) And CAGR (%) By Regions (2018-2030)
Table 10 Global Elevators and Escalators Revenue (USD Million) By Type (2018-2022)
Table 11 Global Elevators and Escalators Revenue Market Share (%) By Type (2018-2022)
Table 12 Global Elevators and Escalators Revenue (USD Million) By Applications (2018-2022)
Table 13 Global Elevators and Escalators Revenue Market Share (%) By Applications (2018-2022)
Table 14 Global Elevators and Escalators Market Revenue (USD Million) By Regions (2018-2022)
Table 15 Global Elevators and Escalators Market Share (%) By Regions (2018-2022)
Table 16 North America Elevators and Escalators Revenue (USD Million) By Country (2018-2022)
Table 17 North America Elevators and Escalators Revenue (USD Million) By Type (2018-2022)
Table 18 North America Elevators and Escalators Revenue (USD Million) By Applications (2018-2022)
Table 19 Europe Elevators and Escalators Revenue (USD Million) By Country (2018-2022)
Table 20 Europe Elevators and Escalators Revenue (USD Million) By Type (2018-2022)
Table 21 Europe Elevators and Escalators Revenue (USD Million) By Applications (2018-2022)
Table 22 Asia Pacific Elevators and Escalators Revenue (USD Million) By Country (2018-2022)
Table 23 Asia Pacific Elevators and Escalators Revenue (USD Million) By Type (2018-2022)
Table 24 Asia Pacific Elevators and Escalators Revenue (USD Million) By Applications (2018-2022)
Table 25 South America Elevators and Escalators Revenue (USD Million) By Country (2018-2022)
Table 26 South America Elevators and Escalators Revenue (USD Million) By Type (2018-2022)
Table 27 South America Elevators and Escalators Revenue (USD Million) By Applications (2018-2022)
Table 28 Middle East and Africa Elevators and Escalators Revenue (USD Million) By Region (2018-2022)
Table 29 Middle East and Africa Elevators and Escalators Revenue (USD Million) By Type (2018-2022)
Table 30 Middle East and Africa Elevators and Escalators Revenue (USD Million) By Applications (2018-2022)
Table 31 Financial Analysis
Table 32 Global Elevators and Escalators Revenue (USD Million) By Type (2023-2030)
Table 33 Global Elevators and Escalators Revenue Market Share (%) By Type (2023-2030)
Table 34 Global Elevators and Escalators Revenue (USD Million) By Applications (2023-2030)
Table 35 Global Elevators and Escalators Revenue Market Share (%) By Applications (2023-2030)
Table 36 Global Elevators and Escalators Market Revenue (USD Million), And Revenue (USD Million) By Regions (2023-2030)
Table 37 North America Elevators and Escalators Revenue (USD)By Country (2023-2030)
Table 38 North America Elevators and Escalators Revenue (USD Million) By Type (2023-2030)
Table 39 North America Elevators and Escalators Revenue (USD Million) By Applications (2023-2030)
Table 40 Europe Elevators and Escalators Revenue (USD Million) By Country (2023-2030)
Table 41 Europe Elevators and Escalators Revenue (USD Million) By Type (2023-2030)
Table 42 Europe Elevators and Escalators Revenue (USD Million) By Applications (2023-2030)
Table 43 Asia Pacific Elevators and Escalators Revenue (USD Million) By Country (2023-2030)
Table 44 Asia Pacific Elevators and Escalators Revenue (USD Million) By Type (2023-2030)
Table 45 Asia Pacific Elevators and Escalators Revenue (USD Million) By Applications (2023-2030)
Table 46 South America Elevators and Escalators Revenue (USD Million) By Country (2023-2030)
Table 47 South America Elevators and Escalators Revenue (USD Million) By Type (2023-2030)
Table 48 South America Elevators and Escalators Revenue (USD Million) By Applications (2023-2030)
Table 49 Middle East and Africa Elevators and Escalators Revenue (USD Million) By Region (2023-2030)
Table 50 Middle East and Africa Elevators and Escalators Revenue (USD Million) By Region (2023-2030)
Table 51 Middle East and Africa Elevators and Escalators Revenue (USD Million) By Type (2023-2030)
Table 52 Middle East and Africa Elevators and Escalators Revenue (USD Million) By Applications (2023-2030)
Table 53 Research Programs/Design for This Report
Table 54 Key Data Information from Secondary Sources
Table 55 Key Data Information from Primary Sources
List of Figures
Figure 1 Market Scope
Figure 2 Porter’s Five Forces
Figure 3 Global Elevators and Escalators Revenue (USD Million) By Type (2018-2022)
Figure 4 Global Elevators and Escalators Revenue Market Share (%) By Type (2022)
Figure 5 Global Elevators and Escalators Revenue (USD Million) By Applications (2018-2022)
Figure 6 Global Elevators and Escalators Revenue Market Share (%) By Applications (2022)
Figure 7 Global Elevators and Escalators Market Revenue (USD Million) By Regions (2018-2022)
Figure 8 Global Elevators and Escalators Market Share (%) By Regions (2022)
Figure 9 North America Elevators and Escalators Revenue (USD Million) By Country (2018-2022)
Figure 10 North America Elevators and Escalators Revenue (USD Million) By Type (2018-2022)
Figure 11 North America Elevators and Escalators Revenue (USD Million) By Applications (2018-2022)
Figure 12 Europe Elevators and Escalators Revenue (USD Million) By Country (2018-2022)
Figure 13 Europe Elevators and Escalators Revenue (USD Million) By Type (2018-2022)
Figure 14 Europe Elevators and Escalators Revenue (USD Million) By Applications (2018-2022)
Figure 15 Asia Pacific Elevators and Escalators Revenue (USD Million) By Country (2018-2022)
Figure 16 Asia Pacific Elevators and Escalators Revenue (USD Million) By Type (2018-2022)
Figure 17 Asia Pacific Elevators and Escalators Revenue (USD Million) By Applications (2018-2022)
Figure 18 South America Elevators and Escalators Revenue (USD Million) By Country (2018-2022)
Figure 19 South America Elevators and Escalators Revenue (USD Million) By Type (2018-2022)
Figure 20 South America Elevators and Escalators Revenue (USD Million) By Applications (2018-2022)
Figure 21 Middle East and Africa Elevators and Escalators Revenue (USD Million) By Region (2018-2022)
Figure 22 Middle East and Africa Elevators and Escalators Revenue (USD Million) By Type (2018-2022)
Figure 23 Middle East and Africa Elevators and Escalators Revenue (USD Million) By Applications (2018-2022)
Figure 24 Global Elevators and Escalators Revenue (USD Million) By Type (2023-2030)
Figure 25 Global Elevators and Escalators Revenue Market Share (%) By Type (2030)
Figure 26 Global Elevators and Escalators Revenue (USD Million) By Applications (2023-2030)
Figure 27 Global Elevators and Escalators Revenue Market Share (%) By Applications (2030)
Figure 28 Global Elevators and Escalators Market Revenue (USD Million) By Regions (2023-2030)
Figure 29 North America Elevators and Escalators Revenue (USD Million) By Country (2023-2030)
Figure 30 North America Elevators and Escalators Revenue (USD Million) By Type (2023-2030)
Figure 31 North America Elevators and Escalators Revenue (USD Million) By Applications (2023-2030)
Figure 32 Europe Elevators and Escalators Revenue (USD Million) By Country (2023-2030)
Figure 33 Europe Elevators and Escalators Revenue (USD Million) By Type (2023-2030)
Figure 34 Europe Elevators and Escalators Revenue (USD Million) By Applications (2023-2030)
Figure 35 Asia Pacific Elevators and Escalators Revenue (USD Million) By Country (2023-2030)
Figure 36 Asia Pacific Elevators and Escalators Revenue (USD Million) By Type (2023-2030)
Figure 37 Asia Pacific Elevators and Escalators Revenue (USD Million) By Applications (2023-2030)
Figure 38 South America Elevators and Escalators Revenue (USD Million) By Country (2023-2030)
Figure 39 South America Elevators and Escalators Revenue (USD Million) By Type (2023-2030)
Figure 40 South America Elevators and Escalators Revenue (USD Million) By Applications (2023-2030)
Figure 41 Middle East and Africa Elevators and Escalators Revenue (USD Million) By Region (2023-2030)
Figure 42 Middle East and Africa Elevators and Escalators Revenue (USD Million) By Region (2023-2030)
Figure 43 Middle East and Africa Elevators and Escalators Revenue (USD Million) By Type (2023-2030)
Figure 44 Middle East and Africa Elevators and Escalators Revenue (USD Million) By Applications (2023-2030)
Figure 45 Bottom-Up and Top-Down Approaches For This Report
Figure 46 Data Triangulation
