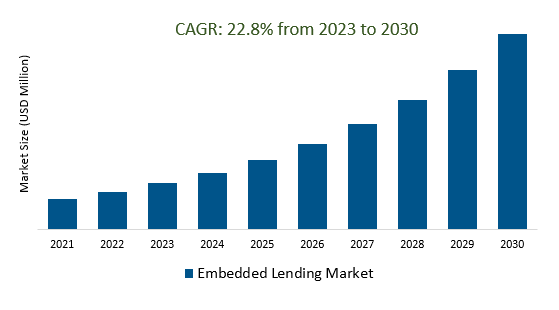
The Global Embedded Lending Market Size is estimated to register 22.8% growth over the forecast period from 2023 to 2030.
The market growth is driven by the increasing digitalization across industries was driving the adoption of embedded lending solutions to provide seamless and integrated financial services to customers. Leading companies that are focused on Wider Adoption Across Industries, Enhanced Personalization, Blockchain and Decentralized Finance (DeFi), Digital Identity Verification, Cybersecurity and Data Privacy, AI and Machine Learning, and others to boost market shares in the industry.
Market Overview
The embedded lending market was a growing sector within fintech, involving the seamless integration of lending services into non-traditional platforms and industries. Key participants included fintech startups, traditional financial institutions, and non-financial businesses. This market featured seamless integration, personalized lending, risk assessment using advanced algorithms and data, regulatory compliance, and strategic partnerships. Challenges included navigating complex regulations, ensuring data privacy and security, and addressing credit risk. The future outlook indicated further expansion across industries with continued technological advancements and regulatory developments shaping the market's trajectory.
Market Dynamics
Market Trends - Benefits of API integration for Embedded lenders
API integration offers embedded lenders in the embedded lending market numerous advantages, including seamless customer experiences, expanded distribution channels, improved operational efficiency, access to valuable data for better decision-making, cost savings, scalability, competitive advantages, effective risk mitigation, regulatory compliance, innovation opportunities, and the ability to build financial ecosystems through partnerships, all contributing to enhanced customer engagement and growth in a competitive market.
Market Driver- Competitive Advantage Demand Embedded Lending Market
The competitive advantage in the embedded lending market is driven by the growing demand for convenient and integrated lending solutions. Embedded lenders gain a competitive edge by meeting this demand effectively. They can offer seamless access to credit within various non-financial platforms, enhancing user experiences and increasing customer retention. Additionally, embedded lenders can reduce customer acquisition costs by leveraging partnerships with platform providers. They have the opportunity to tap into new customer segments and diversify their lending portfolios, contributing to business growth.
Market Opportunity-Introduction of Low-Interest Rates
Low interest rates in the embedded lending market have several implications that encourage borrowing, as consumers and businesses are more inclined to take out loans when rates are favorable. This can lead to increased demand for embedded lending services, especially for large purchases or investments. The low rates may prompt embedded lenders to adjust their own interest rates to remain competitive, potentially squeezing profit margins. Additionally, the low-rate environment can increase competition in the lending sector, driving innovation in lending products and risk assessment methods.
Market Share Analysis- Embedded business lending Embedded Lending Market will register the fastest growth
The Global Embedded Lending Market is analyzed across Embedded Business Lending, Embedded Payroll Advances, Embedded Credit Card, and others. Embedded business lending is poised to register the fastest growth. Embedded business lending in the Embedded Lending Market involves integrating lending services into business platforms, streamlining access to credit for companies, particularly SMEs. This approach enhances user experiences, reduces borrowing complexities, and supports business growth within integrated financial ecosystems.
Market Share Analysis- B2B2B held a significant market share in 2023
The Global Embedded Lending Market is analyzed across various Businesses including B2B, B2C, B2B2B, B2B2C, and others. Of these, B2B2B held a significant market share in 2023. In the Embedded Lending Market, B2B2B refers to a business model where one company provides embedded lending services to another business, which, in turn, offers these services to its end customers or clients. This arrangement enables businesses to enhance their product or service offerings, generate additional revenue streams, and seamlessly integrate lending into their existing platforms, expanding their market reach and catering to specific customer needs.
Embedded Lending Market Segmentation
By Type
- Embedded Business Lending
- Embedded Payroll Advances
- Embedded Credit Card
- Others
By Business Model
By Application
- Retail
- Healthcare
- Logistics
- Manufacturing
- Travel & Entertainment
- Others
By Region
- North America (United States, Canada, Mexico)
- Europe (Germany, France, United Kingdom, Spain, Italy, Others)
- Asia Pacific (China, India, Japan, South Korea, Australia, Others)
- Latin America (Brazil, Argentina, Others)
- Middle East and Africa (Saudi Arabia, UAE, Kuwait, Other Middle East, South Africa, Nigeria, Other Africa)
Embedded Lending Market Companies
- Liberis
- Youlend
- Wisetack
- Parafin
- Kanmon
- Lendflow
- Banxware
- Gusto
- Qwil
- Symmetrical.ai
- Railsbank Technology
- Deserve
- Migo Money
- Vartana
- Hokodo Services
- eBay
- Stripe
- Square
- Paypal
- Even Financial
- Shopify
*List not exhaustive
Embedded Lending Market Outlook 2023
1 Market Overview
1.1 Introduction to the Embedded Lending Market
1.2 Scope of the Study
1.3 Research Objective
1.3.1 Key Market Scope and Segments
1.3.2 Players Covered
1.3.3 Years Considered
2 Executive Summary
2.1 2023 Embedded Lending Industry- Market Statistics
3 Market Dynamics
3.1 Market Drivers
3.2 Market Challenges
3.3 Market Opportunities
3.4 Market Trends
4 Market Factor Analysis
4.1 Porter’s Five Forces
4.2 Market Entropy
4.2.1 Global Embedded Lending Market Companies with Area Served
4.2.2 Products Offerings Global Embedded Lending Market
5 COVID-19 Impact Analysis and Outlook Scenarios
5.1.1 Covid-19 Impact Analysis
5.1.2 post-COVID-19 Scenario- Low Growth Case
5.1.3 post-COVID-19 Scenario- Reference Growth Case
5.1.4 post-COVID-19 Scenario- Low Growth Case
6 Global Embedded Lending Market Trends
6.1 Global Embedded Lending Revenue (USD Million) and CAGR (%) by Type (2018-2030)
6.2 Global Embedded Lending Revenue (USD Million) and CAGR (%) by Applications (2018-2030)
6.3 Global Embedded Lending Revenue (USD Million) and CAGR (%) by regions (2018-2030)
7 Global Embedded Lending Market Revenue (USD Million) by Type, and Applications (2018-2022)
7.1 Global Embedded Lending Revenue (USD Million) by Type (2018-2022)
7.1.1 Global Embedded Lending Revenue (USD Million), Market Share (%) by Type (2018-2022)
7.2 Global Embedded Lending Revenue (USD Million) by Applications (2018-2022)
7.2.1 Global Embedded Lending Revenue (USD Million), Market Share (%) by Applications (2018-2022)
8 Global Embedded Lending Development Regional Status and Outlook
8.1 Global Embedded Lending Revenue (USD Million) By Regions (2018-2022)
8.2 North America Embedded Lending Revenue (USD Million) by Type, and Application (2018-2022)
8.2.1 North America Embedded Lending Revenue (USD Million) by Country (2018-2022)
8.2.2 North America Embedded Lending Revenue (USD Million) by Type (2018-2022)
8.2.3 North America Embedded Lending Revenue (USD Million) by Applications (2018-2022)
8.3 Europe Embedded Lending Revenue (USD Million), by Type, and Applications (USD Million) (2018-2022)
8.3.1 Europe Embedded Lending Revenue (USD Million), by Country (2018-2022)
8.3.2 Europe Embedded Lending Revenue (USD Million) by Type (2018-2022)
8.3.3 Europe Embedded Lending Revenue (USD Million) by Applications (2018-2022)
8.4 Asia Pacific Embedded Lending Revenue (USD Million), and Revenue (USD Million) by Type, and Applications (2018-2022)
8.4.1 Asia Pacific Embedded Lending Revenue (USD Million) by Country (2018-2022)
8.4.2 Asia Pacific Embedded Lending Revenue (USD Million) by Type (2018-2022)
8.4.3 Asia Pacific Embedded Lending Revenue (USD Million) by Applications (2018-2022)
8.5 South America Embedded Lending Revenue (USD Million), by Type, and Applications (2018-2022)
8.5.1 South America Embedded Lending Revenue (USD Million), by Country (2018-2022)
8.5.2 South America Embedded Lending Revenue (USD Million) by Type (2018-2022)
8.5.3 South America Embedded Lending Revenue (USD Million) by Applications (2018-2022)
8.6 Middle East and Africa Embedded Lending Revenue (USD Million), by Type, Technology, Application, Thickness (2018-2022)
8.6.1 Middle East and Africa Embedded Lending Revenue (USD Million) by Country (2018-2022)
8.6.2 Middle East and Africa Embedded Lending Revenue (USD Million) by Type (2018-2022)
8.6.3 Middle East and Africa Embedded Lending Revenue (USD Million) by Applications (2018-2022)
9 Company Profiles
10 Global Embedded Lending Market Revenue (USD Million), by Type, and Applications (2023-2030)
10.1 Global Embedded Lending Revenue (USD Million) and Market Share (%) by Type (2023-2030)
10.1.1 Global Embedded Lending Revenue (USD Million), and Market Share (%) by Type (2023-2030)
10.2 Global Embedded Lending Revenue (USD Million) and Market Share (%) by Applications (2023-2030)
10.2.1 Global Embedded Lending Revenue (USD Million), and Market Share (%) by Applications (2023-2030)
11 Global Embedded Lending Development Regional Status and Outlook Forecast
11.1 Global Embedded Lending Revenue (USD Million) By Regions (2023-2030)
11.2 North America Embedded Lending Revenue (USD Million) by Type, and Applications (2023-2030)
11.2.1 North America Embedded Lending Revenue (USD) Million by Country (2023-2030)
11.2.2 North America Embedded Lending Revenue (USD Million), by Type (2023-2030)
11.2.3 North America Embedded Lending Revenue (USD Million), Market Share (%) by Applications (2023-2030)
11.3 Europe Embedded Lending Revenue (USD Million), by Type, and Applications (2023-2030)
11.3.1 Europe Embedded Lending Revenue (USD Million), by Country (2023-2030)
11.3.2 Europe Embedded Lending Revenue (USD Million), by Type (2023-2030)
11.3.3 Europe Embedded Lending Revenue (USD Million), by Applications (2023-2030)
11.4 Asia Pacific Embedded Lending Revenue (USD Million) by Type, and Applications (2023-2030)
11.4.1 Asia Pacific Embedded Lending Revenue (USD Million), by Country (2023-2030)
11.4.2 Asia Pacific Embedded Lending Revenue (USD Million), by Type (2023-2030)
11.4.3 Asia Pacific Embedded Lending Revenue (USD Million), by Applications (2023-2030)
11.5 South America Embedded Lending Revenue (USD Million), by Type, and Applications (2023-2030)
11.5.1 South America Embedded Lending Revenue (USD Million), by Country (2023-2030)
11.5.2 South America Embedded Lending Revenue (USD Million), by Type (2023-2030)
11.5.3 South America Embedded Lending Revenue (USD Million), by Applications (2023-2030)
11.6 Middle East and Africa Embedded Lending Revenue (USD Million), by Type, and Applications (2023-2030)
11.6.1 Middle East and Africa Embedded Lending Revenue (USD Million), by region (2023-2030)
11.6.2 Middle East and Africa Embedded Lending Revenue (USD Million), by Type (2023-2030)
11.6.3 Middle East and Africa Embedded Lending Revenue (USD Million), by Applications (2023-2030)
12 Methodology and Data Sources
12.1 Methodology/Research Approach
12.1.1 Research Programs/Design
12.1.2 Market Size Estimation
12.1.3 Market Breakdown and Data Triangulation
12.2 Data Sources
12.2.1 Secondary Sources
12.2.2 Primary Sources
12.3 Disclaimer
List of Tables
Table 1 Market Segmentation Analysis
Table 2 Global Embedded Lending Market Companies with Areas Served
Table 3 Products Offerings Global Embedded Lending Market
Table 4 Low Growth Scenario Forecasts
Table 5 Reference Case Growth Scenario
Table 6 High Growth Case Scenario
Table 7 Global Embedded Lending Revenue (USD Million) And CAGR (%) By Type (2018-2030)
Table 8 Global Embedded Lending Revenue (USD Million) And CAGR (%) By Applications (2018-2030)
Table 9 Global Embedded Lending Revenue (USD Million) And CAGR (%) By Regions (2018-2030)
Table 10 Global Embedded Lending Revenue (USD Million) By Type (2018-2022)
Table 11 Global Embedded Lending Revenue Market Share (%) By Type (2018-2022)
Table 12 Global Embedded Lending Revenue (USD Million) By Applications (2018-2022)
Table 13 Global Embedded Lending Revenue Market Share (%) By Applications (2018-2022)
Table 14 Global Embedded Lending Market Revenue (USD Million) By Regions (2018-2022)
Table 15 Global Embedded Lending Market Share (%) By Regions (2018-2022)
Table 16 North America Embedded Lending Revenue (USD Million) By Country (2018-2022)
Table 17 North America Embedded Lending Revenue (USD Million) By Type (2018-2022)
Table 18 North America Embedded Lending Revenue (USD Million) By Applications (2018-2022)
Table 19 Europe Embedded Lending Revenue (USD Million) By Country (2018-2022)
Table 20 Europe Embedded Lending Revenue (USD Million) By Type (2018-2022)
Table 21 Europe Embedded Lending Revenue (USD Million) By Applications (2018-2022)
Table 22 Asia Pacific Embedded Lending Revenue (USD Million) By Country (2018-2022)
Table 23 Asia Pacific Embedded Lending Revenue (USD Million) By Type (2018-2022)
Table 24 Asia Pacific Embedded Lending Revenue (USD Million) By Applications (2018-2022)
Table 25 South America Embedded Lending Revenue (USD Million) By Country (2018-2022)
Table 26 South America Embedded Lending Revenue (USD Million) By Type (2018-2022)
Table 27 South America Embedded Lending Revenue (USD Million) By Applications (2018-2022)
Table 28 Middle East and Africa Embedded Lending Revenue (USD Million) By Region (2018-2022)
Table 29 Middle East and Africa Embedded Lending Revenue (USD Million) By Type (2018-2022)
Table 30 Middle East and Africa Embedded Lending Revenue (USD Million) By Applications (2018-2022)
Table 31 Financial Analysis
Table 32 Global Embedded Lending Revenue (USD Million) By Type (2023-2030)
Table 33 Global Embedded Lending Revenue Market Share (%) By Type (2023-2030)
Table 34 Global Embedded Lending Revenue (USD Million) By Applications (2023-2030)
Table 35 Global Embedded Lending Revenue Market Share (%) By Applications (2023-2030)
Table 36 Global Embedded Lending Market Revenue (USD Million), And Revenue (USD Million) By Regions (2023-2030)
Table 37 North America Embedded Lending Revenue (USD)By Country (2023-2030)
Table 38 North America Embedded Lending Revenue (USD Million) By Type (2023-2030)
Table 39 North America Embedded Lending Revenue (USD Million) By Applications (2023-2030)
Table 40 Europe Embedded Lending Revenue (USD Million) By Country (2023-2030)
Table 41 Europe Embedded Lending Revenue (USD Million) By Type (2023-2030)
Table 42 Europe Embedded Lending Revenue (USD Million) By Applications (2023-2030)
Table 43 Asia Pacific Embedded Lending Revenue (USD Million) By Country (2023-2030)
Table 44 Asia Pacific Embedded Lending Revenue (USD Million) By Type (2023-2030)
Table 45 Asia Pacific Embedded Lending Revenue (USD Million) By Applications (2023-2030)
Table 46 South America Embedded Lending Revenue (USD Million) By Country (2023-2030)
Table 47 South America Embedded Lending Revenue (USD Million) By Type (2023-2030)
Table 48 South America Embedded Lending Revenue (USD Million) By Applications (2023-2030)
Table 49 Middle East and Africa Embedded Lending Revenue (USD Million) By Region (2023-2030)
Table 50 Middle East and Africa Embedded Lending Revenue (USD Million) By Region (2023-2030)
Table 51 Middle East and Africa Embedded Lending Revenue (USD Million) By Type (2023-2030)
Table 52 Middle East and Africa Embedded Lending Revenue (USD Million) By Applications (2023-2030)
Table 53 Research Programs/Design for This Report
Table 54 Key Data Information from Secondary Sources
Table 55 Key Data Information from Primary Sources
List of Figures
Figure 1 Market Scope
Figure 2 Porter’s Five Forces
Figure 3 Global Embedded Lending Revenue (USD Million) By Type (2018-2022)
Figure 4 Global Embedded Lending Revenue Market Share (%) By Type (2022)
Figure 5 Global Embedded Lending Revenue (USD Million) By Applications (2018-2022)
Figure 6 Global Embedded Lending Revenue Market Share (%) By Applications (2022)
Figure 7 Global Embedded Lending Market Revenue (USD Million) By Regions (2018-2022)
Figure 8 Global Embedded Lending Market Share (%) By Regions (2022)
Figure 9 North America Embedded Lending Revenue (USD Million) By Country (2018-2022)
Figure 10 North America Embedded Lending Revenue (USD Million) By Type (2018-2022)
Figure 11 North America Embedded Lending Revenue (USD Million) By Applications (2018-2022)
Figure 12 Europe Embedded Lending Revenue (USD Million) By Country (2018-2022)
Figure 13 Europe Embedded Lending Revenue (USD Million) By Type (2018-2022)
Figure 14 Europe Embedded Lending Revenue (USD Million) By Applications (2018-2022)
Figure 15 Asia Pacific Embedded Lending Revenue (USD Million) By Country (2018-2022)
Figure 16 Asia Pacific Embedded Lending Revenue (USD Million) By Type (2018-2022)
Figure 17 Asia Pacific Embedded Lending Revenue (USD Million) By Applications (2018-2022)
Figure 18 South America Embedded Lending Revenue (USD Million) By Country (2018-2022)
Figure 19 South America Embedded Lending Revenue (USD Million) By Type (2018-2022)
Figure 20 South America Embedded Lending Revenue (USD Million) By Applications (2018-2022)
Figure 21 Middle East and Africa Embedded Lending Revenue (USD Million) By Region (2018-2022)
Figure 22 Middle East and Africa Embedded Lending Revenue (USD Million) By Type (2018-2022)
Figure 23 Middle East and Africa Embedded Lending Revenue (USD Million) By Applications (2018-2022)
Figure 24 Global Embedded Lending Revenue (USD Million) By Type (2023-2030)
Figure 25 Global Embedded Lending Revenue Market Share (%) By Type (2030)
Figure 26 Global Embedded Lending Revenue (USD Million) By Applications (2023-2030)
Figure 27 Global Embedded Lending Revenue Market Share (%) By Applications (2030)
Figure 28 Global Embedded Lending Market Revenue (USD Million) By Regions (2023-2030)
Figure 29 North America Embedded Lending Revenue (USD Million) By Country (2023-2030)
Figure 30 North America Embedded Lending Revenue (USD Million) By Type (2023-2030)
Figure 31 North America Embedded Lending Revenue (USD Million) By Applications (2023-2030)
Figure 32 Europe Embedded Lending Revenue (USD Million) By Country (2023-2030)
Figure 33 Europe Embedded Lending Revenue (USD Million) By Type (2023-2030)
Figure 34 Europe Embedded Lending Revenue (USD Million) By Applications (2023-2030)
Figure 35 Asia Pacific Embedded Lending Revenue (USD Million) By Country (2023-2030)
Figure 36 Asia Pacific Embedded Lending Revenue (USD Million) By Type (2023-2030)
Figure 37 Asia Pacific Embedded Lending Revenue (USD Million) By Applications (2023-2030)
Figure 38 South America Embedded Lending Revenue (USD Million) By Country (2023-2030)
Figure 39 South America Embedded Lending Revenue (USD Million) By Type (2023-2030)
Figure 40 South America Embedded Lending Revenue (USD Million) By Applications (2023-2030)
Figure 41 Middle East and Africa Embedded Lending Revenue (USD Million) By Region (2023-2030)
Figure 42 Middle East and Africa Embedded Lending Revenue (USD Million) By Region (2023-2030)
Figure 43 Middle East and Africa Embedded Lending Revenue (USD Million) By Type (2023-2030)
Figure 44 Middle East and Africa Embedded Lending Revenue (USD Million) By Applications (2023-2030)
Figure 45 Bottom-Up and Top-Down Approaches for This Report
Figure 46 Data Triangulation
