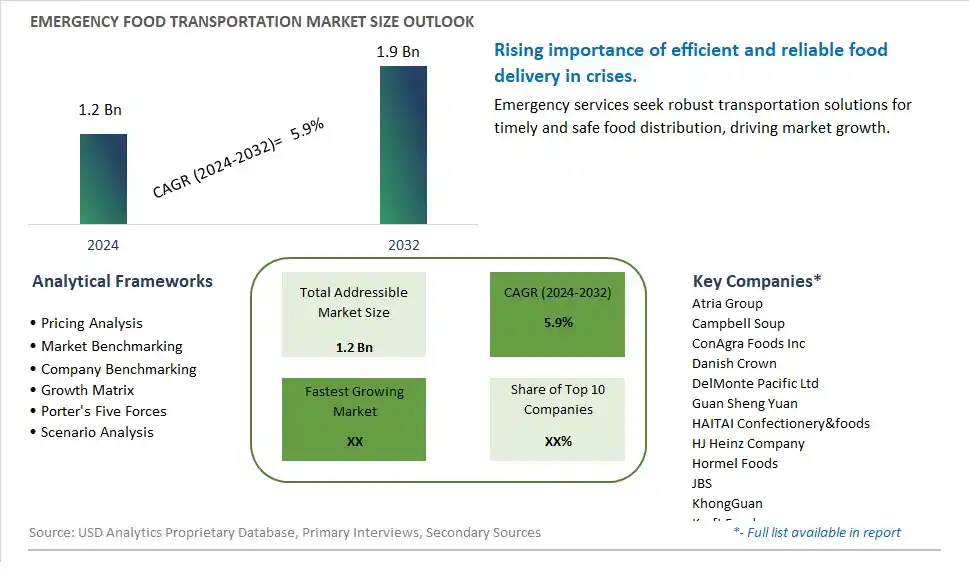
Global Emergency Food Transportation Market Size is valued at $1.2 Billion in 2024 and is forecast to register a growth rate (CAGR) of 5.9% to reach $1.9 Billion by 2032.
The global Emergency Food Transportation Market Comprehensive Study analyzes and forecasts the market size across 6 regions and 24 countries for diverse segments -By Type (Compressed Food, Speed Hot Food, Canned, Others), By Application (Household, Commercial)
An Introduction to Emergency Food Transportation Market
The Emergency Food Transportation market in 2024 is thriving, driven by the critical need for efficient and reliable logistics solutions during crises and disasters. The market encompasses the transportation of emergency food supplies to affected areas, ensuring timely and safe delivery. The market benefits from advancements in logistics and transportation technologies, the increasing frequency of natural disasters, and the growing focus on humanitarian aid and disaster relief. Additionally, the expansion of global supply chains and the rising demand for resilient and agile logistics solutions are contributing to market growth.
Emergency Food Transportation Competitive Landscape
The market report analyses the leading companies in the industry including Atria Group, Campbell Soup, ConAgra Foods Inc, Danish Crown, DelMonte Pacific Ltd, Guan Sheng Yuan, HAITAI Confectionery&foods, HJ Heinz Company, Hormel Foods, JBS, KhongGuan, Kraft Foods, La Doria, Lotte, Nestlé S.A., Orion, PanPan, Pinnacle Foods Inc, S.0.S Food Lab, and Others.
Emergency Food Transportation Market Dynamics
Emergency Food Transportation Market Trend: Increased Focus on Efficient and Reliable Emergency Logistics
The emergency food transportation market is witnessing a significant trend towards increased focus on efficient and reliable logistics for emergency supplies. As global emergencies, natural disasters, and humanitarian crises become more frequent and complex, there is a growing demand for streamlined and rapid transportation of food supplies to affected areas. This trend is driven by the need to ensure timely delivery of essential food items to disaster-stricken regions, refugee camps, and areas facing food insecurity, highlighting the critical role of transportation in emergency response efforts.
Emergency Food Transportation Market Driver: Technological Advancements and Supply Chain Resilience
A major driver for the emergency food transportation market is technological advancements and the need for supply chain resilience. Innovations in transportation technologies, such as GPS tracking, real-time monitoring systems, and cold chain logistics, enable efficient management and monitoring of food shipments during emergencies. Additionally, supply chain resilience strategies, including contingency planning, risk mitigation measures, and collaborative partnerships, ensure the continuity of food transportation services even in challenging conditions. This driver is reinforced by the increasing integration of digital platforms, data analytics, and automation in emergency logistics operations.
Emergency Food Transportation Market Opportunity: Collaboration with Humanitarian Organizations and Governments
The emergency food transportation market presents significant opportunities for collaboration with humanitarian organizations and governments to enhance emergency response capabilities. Companies specializing in transportation and logistics can partner with relief agencies, NGOs, and government agencies to provide dedicated transportation services for emergency food supplies. This collaboration can include pre-positioning food stocks, establishing efficient distribution networks, and implementing emergency response protocols to ensure swift and effective food delivery during crises. Investing in specialized vehicles, storage facilities, and trained personnel for emergency logistics can further enhance market competitiveness and contribute to humanitarian efforts globally.
Emergency Food Transportation Market Share Analysis: Canned Food segment generated the highest revenue share in the industry
The largest segment in the Emergency Food Transportation Market is "Canned Food." Canned food products are widely used for emergency food transportation due to their durability, long shelf life, and convenience in storage and handling. These foods are sealed in airtight containers, preserving their freshness and nutritional value for an extended period, making them suitable for emergency situations where immediate consumption may not be possible. Canned food also provides protection against environmental factors such as moisture, light, and pests, ensuring food safety and quality during transport and storage. The popularity of canned food in emergency food transportation is driven by its versatility, as it encompasses a wide range of food items such as fruits, vegetables, meats, soups, and ready-to-eat meals, catering to diverse dietary needs and preferences. Additionally, advancements in canning technology have led to innovations such as easy-open lids, lightweight packaging, and enhanced packaging materials, further enhancing the appeal and practicality of canned food for emergency food transportation.
Emergency Food Transportation Market Share Analysis: Commercial Application is the fastest growing segment over the forecast period to 2032
The fastest-growing segment in the Emergency Food Transportation Market is the "Commercial Application." This category encompasses food transportation services catering to businesses, institutions, and organizations that require emergency food supplies on a larger scale. Commercial applications include sectors such as hospitality, healthcare facilities, educational institutions, and disaster relief agencies, among others. The growth in this segment is fueled by several factors, including the increasing adoption of emergency preparedness measures by businesses and institutions to ensure continuity of operations during emergencies or disruptions in the food supply chain. Additionally, rising awareness about the importance of food security and disaster resilience is driving organizations to invest in reliable and efficient emergency food transportation solutions. The commercial sector's demand for specialized food transportation services, such as temperature-controlled transport for perishable goods and bulk transport for large quantities, is contributing significantly to the rapid growth of this segment. Further, advancements in logistics technology and infrastructure are further facilitating the efficient and timely delivery of emergency food supplies to commercial customers, driving the growth trajectory of the Emergency Food Transportation Market in the commercial application segment.
Emergency Food Transportation Market Segmentation
By Type
Compressed Food
Speed Hot Food
Canned
Others
By Application
Household
Commercial
Countries Analyzed
North America (US, Canada, Mexico)
Europe (Germany, UK, France, Spain, Italy, Russia, Rest of Europe)
Asia Pacific (China, India, Japan, South Korea, Australia, South East Asia, Rest of Asia)
South America (Brazil, Argentina, Rest of South America)
Middle East and Africa (Saudi Arabia, UAE, Rest of Middle East, South Africa, Egypt, Rest of Africa)
Emergency Food Transportation Companies Profiled in the Study
Atria Group
Campbell Soup
ConAgra Foods Inc
Danish Crown
DelMonte Pacific Ltd
Guan Sheng Yuan
HAITAI Confectionery&foods
HJ Heinz Company
Hormel Foods
JBS
KhongGuan
Kraft Foods
La Doria
Lotte
Nestlé S.A.
Orion
PanPan
Pinnacle Foods Inc
S.0.S Food Lab
*- List Not Exhaustive
Chapter 1. TABLE OF CONTENTS
Chapter 2. Introduction to Emergency Food Transportation Market
2.1. Market Overview
2.2. Key Statistics and Report Highlights
2.3. Scope of the Comprehensive Study
2.3.1. Market Definition
2.3.2 Countries and Regions Covered
2.3.3 Research Objective
2.3.4 Units, Currency, and Conversions
2.3.5 Industry Value Chain
2.4. Key Market Segments
2.5. Key Companies
2.6. Study Period
Chapter 3. Strategic Analysis Review
3.1. Emergency Food Transportation Pricing Analysis and Forecast
3.2. Porter’s Five Forces
3.3. Market Ecosystem
3.4. SWOT Analysis
3.5. Regulatory Scenario
3.3. Effects of Inflation, Russia-Ukraine War, moderating economic growth, and other macroeconomic factors
Chapter 4. Competitive Landscape
4.1. Market Share Analysis
4.1.1. Global Emergency Food Transportation Market Share by Company, 2023
4.1.2. Product Offerings of Leading Emergency Food Transportation Companies
4.2. Market Entropy
4.2.1. New Product Launches in the Industry
4.2.2. Mergers, Acquisitions, Joint ventures, and Partnerships
4.3. Key Strategies and Best Practices
Chapter 5. Global Market Projections: Best, Reference, and Low Case Scenarios
5.1. Growth Analysis- Case Scenario Definitions
5.2. Low Growth Case Scenario Forecasts
5.3. Reference Growth Case Scenario Forecasts
5.4. High Growth Case Scenario Forecasts
Chapter 6. Market Dynamics
6.1. Emergency Food Transportation Market Drivers
6.2. Emergency Food Transportation Market Challenges
6.6. Emergency Food Transportation Market Opportunities
6.4. Emergency Food Transportation Market Trends
Chapter 7. Global Emergency Food Transportation Market Outlook Trends
7.1. Global Emergency Food Transportation Revenue (USD Million) and CAGR (%) by Type (2021-2032)
7.2. Global Emergency Food Transportation Revenue (USD Million) and CAGR (%) by Application (2021-2032)
7.3. Global Emergency Food Transportation Revenue (USD Million) and CAGR (%) by Product (2021-2032)
By Type
Compressed Food
Speed Hot Food
Canned
Others
By Application
Household
Commercial
Chapter 8. Global Emergency Food Transportation Regional Analysis and Outlook
8.1. Global Emergency Food Transportation Revenue (USD Million) By Regions (2021- 2032)
8.2. North America Emergency Food Transportation Revenue (USD Million) by Country (2021-2032)
8.2.1. United States Emergency Food Transportation Regional Analysis and Outlook
8.2.2. Canada Emergency Food Transportation Regional Analysis and Outlook
8.2.3. Mexico Emergency Food Transportation Regional Analysis and Outlook
8.3. Europe Emergency Food Transportation Revenue (USD Million), by Country (2021-2032)
8.3.1. Germany Emergency Food Transportation Regional Analysis and Outlook
8.3.2. France Emergency Food Transportation Regional Analysis and Outlook
8.3.3. United Kingdom Emergency Food Transportation Regional Analysis and Outlook
8.3.4. Spain Emergency Food Transportation Regional Analysis and Outlook
8.3.5. Italy Emergency Food Transportation Regional Analysis and Outlook
8.3.6. Russia Emergency Food Transportation Regional Analysis and Outlook
8.3.7. Rest of Europe Emergency Food Transportation Regional Analysis and Outlook
8.4. Asia Pacific Emergency Food Transportation Revenue (USD Million) by Country (2021-2032)
8.4.1. China Emergency Food Transportation Regional Analysis and Outlook
8.4.2. Japan Emergency Food Transportation Regional Analysis and Outlook
8.4.3. India Emergency Food Transportation Regional Analysis and Outlook
8.4.4. South Korea Emergency Food Transportation Regional Analysis and Outlook
8.4.5. Australia Emergency Food Transportation Regional Analysis and Outlook
8.4.6. South East Asia Emergency Food Transportation Regional Analysis and Outlook
8.4.7. Rest of Asia Pacific Emergency Food Transportation Regional Analysis and Outlook
8.5. South America Emergency Food Transportation Revenue (USD Million), by Country (2021-2032)
8.5.1. Brazil Emergency Food Transportation Regional Analysis and Outlook
8.5.2. Argentina Emergency Food Transportation Regional Analysis and Outlook
8.5.3. Rest of South America Emergency Food Transportation Regional Analysis and Outlook
8.6. Middle East and Africa Emergency Food Transportation Revenue (USD Million) by Country (2021-2032)
8.6.1. Middle East Emergency Food Transportation Regional Analysis and Outlook
8.6.2. Africa Emergency Food Transportation Regional Analysis and Outlook
Chapter 9. North America Emergency Food Transportation Analysis and Outlook
9.1. North America Emergency Food Transportation Revenue (USD Million) by Segments (2021-2032)
9.1.1. North America Emergency Food Transportation Revenue (USD Million) by Type (2021-2032)
9.1.2. North America Emergency Food Transportation Revenue (USD Million) by Application (2021-2032)
9.1.3. North America Emergency Food Transportation Revenue (USD Million) by Product (2021-2032)
By Type
Compressed Food
Speed Hot Food
Canned
Others
By Application
Household
Commercial
Chapter 10. Europe Emergency Food Transportation Analysis and Outlook
10.1. Europe Emergency Food Transportation Revenue (USD Million), by Segments (USD Million) (2021-2032)
10.1.1. Europe Emergency Food Transportation Revenue (USD Million) by Type (2021-2032)
10.1.2. Europe Emergency Food Transportation Revenue (USD Million) by Application (2021-2032)
10.1.3. Europe Emergency Food Transportation Revenue (USD Million) by Product (2021-2032)
By Type
Compressed Food
Speed Hot Food
Canned
Others
By Application
Household
Commercial
Chapter 11. Asia Pacific Emergency Food Transportation Analysis and Outlook
11.1. Asia Pacific Emergency Food Transportation Revenue (USD Million), and Revenue (USD Million) by Segments (2021-2032)
11.1.1. Asia Pacific Emergency Food Transportation Revenue (USD Million) by Type (2021-2032)
11.1.2. Asia Pacific Emergency Food Transportation Revenue (USD Million) by Application (2021-2032)
11.1.3. Asia Pacific Emergency Food Transportation Revenue (USD Million) by Product (2021-2032)
By Type
Compressed Food
Speed Hot Food
Canned
Others
By Application
Household
Commercial
Chapter 12. South America Emergency Food Transportation Analysis and Outlook
12.1. South America Emergency Food Transportation Revenue (USD Million), by Segments (2021-2032)
12.1.1. South America Emergency Food Transportation Revenue (USD Million) by Type (2021-2032)
12.1.2. South America Emergency Food Transportation Revenue (USD Million) by Application (2021-2032)
12.1.3. South America Emergency Food Transportation Revenue (USD Million) by Product (2021-2032)
By Type
Compressed Food
Speed Hot Food
Canned
Others
By Application
Household
Commercial
Chapter 13. Middle East and Africa Emergency Food Transportation Analysis and Outlook
13.1. Middle East and Africa Emergency Food Transportation Revenue (USD Million), by Segments (2021-2032)
13.1.1. Middle East and Africa Emergency Food Transportation Revenue (USD Million) by Type (2021-2032)
13.1.2. Middle East and Africa Emergency Food Transportation Revenue (USD Million) by Application (2021-2032)
13.1.3. Middle East and Africa Emergency Food Transportation Revenue (USD Million) by Product (2021-2032)
By Type
Compressed Food
Speed Hot Food
Canned
Others
By Application
Household
Commercial
Chapter 14. Emergency Food Transportation Company Profiles
14.1 Business Overview
14.2 Product Profiles
14.3 SWOT Profiles
14.5 Recent Developments
14.6 Financial Profile
List of Companies
Atria Group
Campbell Soup
ConAgra Foods Inc
Danish Crown
DelMonte Pacific Ltd
Guan Sheng Yuan
HAITAI Confectionery&foods
HJ Heinz Company
Hormel Foods
JBS
KhongGuan
Kraft Foods
La Doria
Lotte
Nestlé S.A.
Orion
PanPan
Pinnacle Foods Inc
S.0.S Food Lab
15. Methodology and Data Sources
15.1 Customization Offerings
15.2 Subscription Services
15.3 Related Reports
15.4 Publisher Expertise
LIST OF TABLES
Table 1 Market Segmentation Analysis
Table 2 Global Emergency Food Transportation Market Share of Leading Companies, 2023
Table 3 Product Offerings of Leading Companies
Table 4 Low Growth Scenario Forecasts
Table 5 Reference Case Growth Scenario
Table 6 High Growth Case Scenario
Table 7 Global Emergency Food Transportation Revenue (USD Million) And CAGR (%) By Type (2021-2032)
Table 8 Global Emergency Food Transportation Revenue (USD Million) And CAGR (%) By Application (2021-2032)
Table 9 Global Emergency Food Transportation Revenue (USD Million) And CAGR (%) By Product (2021-2032)
Table 10 Global Emergency Food Transportation Market Revenue (USD Million) By Regions (2021-2032)
Table 11 Global Emergency Food Transportation Market Share (%) By Regions (2021-2032)
Table 12 North America Emergency Food Transportation Revenue (USD Million) By Country (2021-2032)
Table 13 Europe Emergency Food Transportation Revenue (USD Million) By Country (2021-2032)
Table 14 Asia Pacific Emergency Food Transportation Revenue (USD Million) By Country (2021-2032)
Table 15 South America Emergency Food Transportation Revenue (USD Million) By Country (2021-2032)
Table 16 Middle East and Africa Emergency Food Transportation Revenue (USD Million) By Region (2021-2032)
Table 17 North America Emergency Food Transportation Revenue (USD Million) By Type (2021-2032)
Table 18 North America Emergency Food Transportation Revenue (USD Million) By Application (2021-2032)
Table 19 North America Emergency Food Transportation Revenue (USD Million) By Product (2021-2032)
Table 20 Europe Emergency Food Transportation Revenue (USD Million) By Type (2021-2032)
Table 21 Europe Emergency Food Transportation Revenue (USD Million) By Application (2021-2032)
Table 22 Europe Emergency Food Transportation Revenue (USD Million) By Product (2021-2032)
Table 23 Asia Pacific Emergency Food Transportation Revenue (USD Million) By Type (2021-2032)
Table 24 Asia Pacific Emergency Food Transportation Revenue (USD Million) By Application (2021-2032)
Table 25 Asia Pacific Emergency Food Transportation Revenue (USD Million) By Product (2021-2032)
Table 26 South America Emergency Food Transportation Revenue (USD Million) By Type (2021-2032)
Table 27 South America Emergency Food Transportation Revenue (USD Million) By Application (2021-2032)
Table 28 South America Emergency Food Transportation Revenue (USD Million) By Product (2021-2032)
Table 29 Middle East and Africa Emergency Food Transportation Revenue (USD Million) By Type (2021-2032)
Table 30 Middle East and Africa Emergency Food Transportation Revenue (USD Million) By Application (2021-2032)
Table 31 Middle East and Africa Emergency Food Transportation Revenue (USD Million) By Product (2021-2032)
LIST OF FIGURES
Figure 1. Market Scope
Figure 2. Pricing Forecasts Per Unit, 2023- 2032
Figure 3. Porter’s Five Forces
Figure 4. Global Emergency Food Transportation Market Revenue (USD Million) By Regions (2021-2032)
Figure 5. Global Emergency Food Transportation Market Share (%) By Regions (2023)
Figure 6. North America Emergency Food Transportation Revenue (USD Million) By Country (2021-2032)
Figure 7. United States Emergency Food Transportation Revenue (USD Million) By Country (2021-2032)
Figure 8. Canada Emergency Food Transportation Revenue (USD Million) By Country (2021-2032)
Figure 9. Mexico Emergency Food Transportation Revenue (USD Million) By Country (2021-2032)
Figure 10. Europe Emergency Food Transportation Revenue (USD Million) By Country (2021-2032)
Figure 11. Germany Emergency Food Transportation Revenue (USD Million) By Country (2021-2032)
Figure 12. France Emergency Food Transportation Revenue (USD Million) By Country (2021-2032)
Figure 13. United Kingdom Emergency Food Transportation Revenue (USD Million) By Country (2021-2032)
Figure 14. Spain Emergency Food Transportation Revenue (USD Million) By Country (2021-2032)
Figure 15. Italy Emergency Food Transportation Revenue (USD Million) By Country (2021-2032)
Figure 16. Russia Emergency Food Transportation Revenue (USD Million) By Country (2021-2032)
Figure 17. Rest of Europe Emergency Food Transportation Revenue (USD Million) By Country (2021-2032)
Figure 11. Asia Pacific Emergency Food Transportation Revenue (USD Million) By Country (2021-2032)
Figure 12. China Emergency Food Transportation Revenue (USD Million) By Country (2021-2032)
Figure 13. Japan Emergency Food Transportation Revenue (USD Million) By Country (2021-2032)
Figure 14. India Emergency Food Transportation Revenue (USD Million) By Country (2021-2032)
Figure 15. South Korea Emergency Food Transportation Revenue (USD Million) By Country (2021-2032)
Figure 16. Australia Emergency Food Transportation Revenue (USD Million) By Country (2021-2032)
Figure 17. South East Asia Emergency Food Transportation Revenue (USD Million) By Country (2021-2032)
Figure 18. South America Emergency Food Transportation Revenue (USD Million) By Country (2021-2032)
Figure 19. Brazil Emergency Food Transportation Revenue (USD Million) By Country (2021-2032)
Figure 20. Argentina Emergency Food Transportation Revenue (USD Million) By Country (2021-2032)
Figure 21. Rest of Asia Pacific Emergency Food Transportation Revenue (USD Million) By Country (2021-2032)
Figure 22. Middle East and Africa Emergency Food Transportation Revenue (USD Million) By Region (2021-2032)
Figure 23. Saudi Arabia Emergency Food Transportation Revenue (USD Million) By Region (2021-2032)
Figure 24. The UAE Emergency Food Transportation Revenue (USD Million) By Region (2021-2032)
Figure 25. Rest of Middle East Emergency Food Transportation Revenue (USD Million) By Region (2021-2032)
Figure 26. South Africa Emergency Food Transportation Revenue (USD Million) By Region (2021-2032)
Figure 27. Africa Emergency Food Transportation Revenue (USD Million) By Region (2021-2032)
Figure 28. North America Emergency Food Transportation Revenue (USD Million) By Type (2021-2032)
Figure 29. North America Emergency Food Transportation Revenue (USD Million) By Application (2021-2032)
Figure 30. North America Emergency Food Transportation Revenue (USD Million) By Product (2021-2032)
Figure 31. Europe Emergency Food Transportation Revenue (USD Million) By Type (2021-2032)
Figure 32. Europe Emergency Food Transportation Revenue (USD Million) By Application (2021-2032)
Figure 33. Europe Emergency Food Transportation Revenue (USD Million) By Product (2021-2032)
Figure 34. Asia Pacific Emergency Food Transportation Revenue (USD Million) By Type (2021-2032)
Figure 35. Asia Pacific Emergency Food Transportation Revenue (USD Million) By Application (2021-2032)
Figure 36. Asia Pacific Emergency Food Transportation Revenue (USD Million) By Product (2021-2032)
Figure 37. South America Emergency Food Transportation Revenue (USD Million) By Type (2021-2032)
Figure 38. South America Emergency Food Transportation Revenue (USD Million) By Application (2021-2032)
Figure 39. South America Emergency Food Transportation Revenue (USD Million) By Product (2021-2032)
Figure 40. Middle East and Africa Emergency Food Transportation Revenue (USD Million) By Type (2021-2032)
Figure 41. Middle East and Africa Emergency Food Transportation Revenue (USD Million) By Application (2021-2032)
Figure 42. Middle East and Africa Emergency Food Transportation Revenue (USD Million) By Product (2021-2032)
By Type
Compressed Food
Speed Hot Food
Canned
Others
By Application
Household
Commercial
Countries Analyzed
North America (US, Canada, Mexico)
Europe (Germany, UK, France, Spain, Italy, Russia, Rest of Europe)
Asia Pacific (China, India, Japan, South Korea, Australia, South East Asia, Rest of Asia)
South America (Brazil, Argentina, Rest of South America)
Middle East and Africa (Saudi Arabia, UAE, Rest of Middle East, South Africa, Egypt, Rest of Africa)
