Global Encapsulated Flavors Market Size is valued at $XX Million in 2024 and is forecast to register a growth rate (CAGR) of 6.3% to reach $XX Million by 2032.
The global Encapsulated Flavors Market Comprehensive Study analyzes and forecasts the market size across 6 regions and 24 countries for diverse segments -By Product (Flavored Blends, Fragrance Blends, Essential Oils, Natural Extracts, Aroma Chemicals), By Encapsulation Process (Physical Process, Physiochemical Process, Chemical Process, Extrusion, Spray Congealing and Chilling, Sprays Drying, Glass Encapsulation, Fluid Bed, Others), By Flavor (Fruit Flavors, Nut Flavors, Chocolate Flavor, Spice Flavor, Vanilla Flavor, Citric Flavor, Berry Flavor, Others), By Application (Pharmaceuticals, Personal Care, Toiletries and Cleaners, Beverages and Instant drinks, Dairy Products, Frozen Food, Snacks, Cereal and Oatmeal, Bakery and Confectionery)
An Introduction to Encapsulated Flavors Market
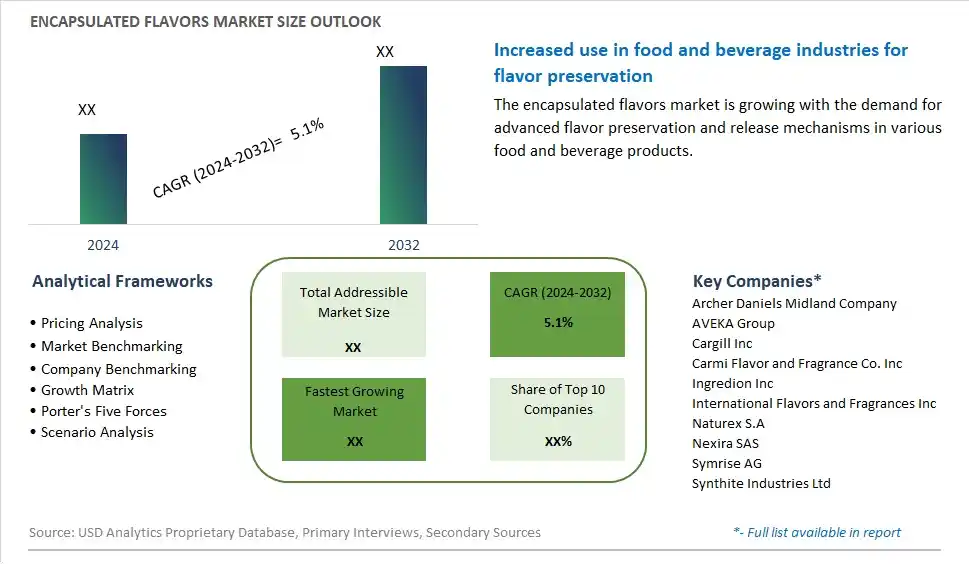
The Encapsulated Flavors market in 2024 is experiencing robust growth, driven by the increasing demand for stable and long-lasting flavor solutions in the food and beverage industry. Encapsulated flavors, used to enhance taste and aroma while protecting flavor integrity, are popular in applications such as bakery, confectionery, and dairy products. The market benefits from advancements in encapsulation technologies, the growing trend of convenience and functional foods, and the expansion of the clean label and natural ingredient market. Additionally, the increasing focus on flavor innovation and product differentiation is contributing to market growth.
Encapsulated Flavors Competitive Landscape
The market report analyses the leading companies in the industry including Archer Daniels Midland Company (ADM), AVEKA, AVEKA Group, Cargill Inc, Carmi Flavor & Fragrance Co. Inc Naturex S.A, Ingredion Inc, International Flavors & Fragrances Inc. (IFF), Nexira SAS, Symrise AG, Synthite Industries Ltd, and Others.
Encapsulated Flavors Market Dynamics
Encapsulated Flavors Market Trend: Surge in Demand for Controlled Release and Long-Lasting Flavors
The market for encapsulated flavors is experiencing a prominent trend towards the surge in demand for controlled release and long-lasting flavors. Consumers and food manufacturers alike are seeking innovative solutions that preserve and enhance flavor profiles over time, ensuring a consistent and enjoyable taste experience in a wide range of food and beverage products. Encapsulated flavors offer benefits such as protection against flavor degradation, extended shelf life, and targeted flavor delivery, aligning with the trend towards premiumization, flavor customization, and sensory innovation in the food industry.
Encapsulated Flavors Market Driver: Growing Preference for Functional Ingredients and Value-Added Solutions
A major driver for the encapsulated flavors market is the growing preference for functional ingredients and value-added solutions in food and beverage formulations. Encapsulated flavors not only enhance taste but also contribute to product differentiation, stability, and consumer appeal. The drive for product innovation, convenience, and sensory appeal fuels the adoption of encapsulation technologies that enable the incorporation of delicate, volatile, or heat-sensitive flavors into various food matrices while maintaining their integrity and potency. This driver is reinforced by consumer demands for authentic, natural, and multi-dimensional flavor experiences across different food categories.
Encapsulated Flavors Market Opportunity: Expansion into Health and Wellness Applications
The market for encapsulated flavors presents a significant opportunity for expansion into health and wellness applications. Companies specializing in encapsulation technologies can develop and promote encapsulated flavor systems that cater to functional food and beverage segments, including nutraceuticals, dietary supplements, functional beverages, and health-focused snacks. This opportunity includes creating encapsulated flavors with added functionalities such as vitamins, antioxidants, probiotics, or herbal extracts, offering consumers flavorful options that also provide health benefits. Collaborations with nutritionists, food scientists, and wellness experts can inform the development of encapsulated flavor solutions that address specific nutritional needs, flavor preferences, and market trends related to health-conscious consumption.
Encapsulated Flavors Market Share Analysis: Flavored Blends segment generated the highest revenue share in the industry
Among the segments in the Encapsulated Flavors Market, the largest one is the "Flavored Blends" segment. Flavored blends refer to combinations of various flavors, often created through the blending of different essential oils, natural extracts, aroma chemicals, and other flavoring agents. This segment holds a dominant position due to its versatility and widespread use across diverse industries such as food and beverages, cosmetics, pharmaceuticals, and personal care products. Flavored blends offer manufacturers the flexibility to create unique and complex flavor profiles, catering to a wide range of consumer preferences and product applications. The demand for flavored blends is driven by the growing consumer interest in novel and exotic flavors, the rising demand for natural and clean label products, and the continuous innovation in flavor technology to enhance sensory experiences. As a result, the flavored blends segment is experiencing steady growth and is expected to maintain its leading position in the Encapsulated Flavors Market in the foreseeable future.
Encapsulated Flavors Market Share Analysis: Spray Drying is the fastest growing segment over the forecast period to 2032
The "Spray Drying" segment is identified as the fastest-growing segment in the Encapsulated Flavors Market. Spray drying is a widely adopted encapsulation process that involves converting liquid feed material into dried powder through rapid drying using hot air. This process is preferred for encapsulating flavors due to its efficiency in producing fine, uniform particles with high encapsulation rates, which helps in preserving the flavor integrity and enhancing stability during storage and processing. The growing demand for encapsulated flavors in various applications such as food and beverages, pharmaceuticals, and personal care products is driving the adoption of spray drying technology. Additionally, advancements in spray drying techniques, including improved equipment design, control systems, and formulation development, are further fueling the growth of this segment. The spray drying process offers advantages such as cost-effectiveness, scalability, and versatility, making it a preferred choice for manufacturers seeking efficient and reliable encapsulation solutions for their flavor products.
Encapsulated Flavors Market Share Analysis: Fruit Flavors segment generated the highest revenue share in the industry
The "Fruit Flavors" segment stands out as the largest segment in the Encapsulated Flavors Market. Fruit flavors encompass a wide range of popular and versatile flavors derived from various fruits such as citrus, berry, tropical fruits, and others. The demand for fruit flavors is driven by their widespread use in food and beverage products, including juices, snacks, confectionery, dairy products, and bakery items, among others. Consumers often prefer fruit flavors for their refreshing and natural taste profiles, making them a staple in the food and beverage industry. Additionally, advancements in encapsulation technologies have enabled the creation of innovative fruit flavor formulations that offer enhanced stability, shelf life, and flavor retention, meeting the industry's demand for high-quality and consistent flavor experiences. The continuous innovation and development in fruit flavor encapsulation techniques are expected to further drive the growth of this segment in the coming years, catering to evolving consumer preferences and industry requirements.
Encapsulated Flavors Market Share Analysis: Beverages and Instant Drinks is the fastest growing segment over the forecast period to 2032
The "Beverages and Instant Drinks" segment emerges as the fastest-growing segment in the Encapsulated Flavors Market. This growth is propelled by several key factors. Firstly, the rising consumer demand for convenience and on-the-go consumption has led to an increased preference for ready-to-drink beverages and instant drink mixes. Encapsulated flavors play a crucial role in enhancing the taste, aroma, and overall sensory experience of these beverages, ranging from carbonated drinks to flavored water, energy drinks, and instant coffee or tea mixes. Further, the expanding global beverage industry, coupled with the introduction of new and innovative flavor combinations, is driving the adoption of encapsulated flavors in this segment. Manufacturers are focusing on developing encapsulation technologies that ensure flavor stability, solubility, and prolonged shelf life, meeting the stringent quality standards of the beverage sector. Furthermore, the growing trend of health-conscious consumers seeking natural and clean-label ingredients has led to the development of encapsulated natural flavors, contributing to the segment's accelerated growth. As beverage companies continue to innovate and diversify their product portfolios to cater to evolving consumer preferences, the demand for encapsulated flavors in the beverages and instant drinks segment is expected to witness significant expansion in the forecast period, making it a focal point for market players and investors alike.
Encapsulated Flavors Market Segmentation
By Product
Flavored Blends
Fragrance Blends
Essential Oils
Natural Extracts
Aroma Chemicals
By Encapsulation Process
Physical Process
Physiochemical Process
Chemical Process
Extrusion
Spray Congealing and Chilling
Sprays Drying
Glass Encapsulation
Fluid Bed
Others
By Flavor
Fruit Flavors
Nut Flavors
Chocolate Flavor
Spice Flavor
Vanilla Flavor
Citric Flavor
Berry Flavor
Others
By Application
Pharmaceuticals
Personal Care
Toiletries and Cleaners
Beverages and Instant drinks
Dairy Products
Frozen Food
Snacks
Cereal and Oatmeal
Bakery and Confectionery
Countries Analyzed
North America (US, Canada, Mexico)
Europe (Germany, UK, France, Spain, Italy, Russia, Rest of Europe)
Asia Pacific (China, India, Japan, South Korea, Australia, South East Asia, Rest of Asia)
South America (Brazil, Argentina, Rest of South America)
Middle East and Africa (Saudi Arabia, UAE, Rest of Middle East, South Africa, Egypt, Rest of Africa)
Encapsulated Flavors Companies Profiled in the Study
Archer Daniels Midland Company (ADM)
AVEKA
AVEKA Group
Cargill Inc
Carmi Flavor & Fragrance Co. Inc Naturex S.A
Ingredion Inc
International Flavors & Fragrances Inc. (IFF)
Nexira SAS
Symrise AG
Synthite Industries Ltd
*- List Not Exhaustive
Chapter 1. TABLE OF CONTENTS
Chapter 2. Introduction to Encapsulated Flavors Market
2.1. Market Overview
2.2. Key Statistics and Report Highlights
2.3. Scope of the Comprehensive Study
2.3.1. Market Definition
2.3.2 Countries and Regions Covered
2.3.3 Research Objective
2.3.4 Units, Currency, and Conversions
2.3.5 Industry Value Chain
2.4. Key Market Segments
2.5. Key Companies
2.6. Study Period
Chapter 3. Strategic Analysis Review
3.1. Encapsulated Flavors Pricing Analysis and Forecast
3.2. Porter’s Five Forces
3.3. Market Ecosystem
3.4. SWOT Analysis
3.5. Regulatory Scenario
3.3. Effects of Inflation, Russia-Ukraine War, moderating economic growth, and other macroeconomic factors
Chapter 4. Competitive Landscape
4.1. Market Share Analysis
4.1.1. Global Encapsulated Flavors Market Share by Company, 2023
4.1.2. Product Offerings of Leading Encapsulated Flavors Companies
4.2. Market Entropy
4.2.1. New Product Launches in the Industry
4.2.2. Mergers, Acquisitions, Joint ventures, and Partnerships
4.3. Key Strategies and Best Practices
Chapter 5. Global Market Projections: Best, Reference, and Low Case Scenarios
5.1. Growth Analysis- Case Scenario Definitions
5.2. Low Growth Case Scenario Forecasts
5.3. Reference Growth Case Scenario Forecasts
5.4. High Growth Case Scenario Forecasts
Chapter 6. Market Dynamics
6.1. Encapsulated Flavors Market Drivers
6.2. Encapsulated Flavors Market Challenges
6.6. Encapsulated Flavors Market Opportunities
6.4. Encapsulated Flavors Market Trends
Chapter 7. Global Encapsulated Flavors Market Outlook Trends
7.1. Global Encapsulated Flavors Revenue (USD Million) and CAGR (%) by Type (2021-2032)
7.2. Global Encapsulated Flavors Revenue (USD Million) and CAGR (%) by Application (2021-2032)
7.3. Global Encapsulated Flavors Revenue (USD Million) and CAGR (%) by Product (2021-2032)
By Product
Flavored Blends
Fragrance Blends
Essential Oils
Natural Extracts
Aroma Chemicals
By Encapsulation Process
Physical Process
Physiochemical Process
Chemical Process
Extrusion
Spray Congealing and Chilling
Sprays Drying
Glass Encapsulation
Fluid Bed
Others
By Flavor
Fruit Flavors
Nut Flavors
Chocolate Flavor
Spice Flavor
Vanilla Flavor
Citric Flavor
Berry Flavor
Others
By Application
Pharmaceuticals
Personal Care
Toiletries and Cleaners
Beverages and Instant drinks
Dairy Products
Frozen Food
Snacks
Cereal and Oatmeal
Bakery and Confectionery
Chapter 8. Global Encapsulated Flavors Regional Analysis and Outlook
8.1. Global Encapsulated Flavors Revenue (USD Million) By Regions (2021- 2032)
8.2. North America Encapsulated Flavors Revenue (USD Million) by Country (2021-2032)
8.2.1. United States Encapsulated Flavors Regional Analysis and Outlook
8.2.2. Canada Encapsulated Flavors Regional Analysis and Outlook
8.2.3. Mexico Encapsulated Flavors Regional Analysis and Outlook
8.3. Europe Encapsulated Flavors Revenue (USD Million), by Country (2021-2032)
8.3.1. Germany Encapsulated Flavors Regional Analysis and Outlook
8.3.2. France Encapsulated Flavors Regional Analysis and Outlook
8.3.3. United Kingdom Encapsulated Flavors Regional Analysis and Outlook
8.3.4. Spain Encapsulated Flavors Regional Analysis and Outlook
8.3.5. Italy Encapsulated Flavors Regional Analysis and Outlook
8.3.6. Russia Encapsulated Flavors Regional Analysis and Outlook
8.3.7. Rest of Europe Encapsulated Flavors Regional Analysis and Outlook
8.4. Asia Pacific Encapsulated Flavors Revenue (USD Million) by Country (2021-2032)
8.4.1. China Encapsulated Flavors Regional Analysis and Outlook
8.4.2. Japan Encapsulated Flavors Regional Analysis and Outlook
8.4.3. India Encapsulated Flavors Regional Analysis and Outlook
8.4.4. South Korea Encapsulated Flavors Regional Analysis and Outlook
8.4.5. Australia Encapsulated Flavors Regional Analysis and Outlook
8.4.6. South East Asia Encapsulated Flavors Regional Analysis and Outlook
8.4.7. Rest of Asia Pacific Encapsulated Flavors Regional Analysis and Outlook
8.5. South America Encapsulated Flavors Revenue (USD Million), by Country (2021-2032)
8.5.1. Brazil Encapsulated Flavors Regional Analysis and Outlook
8.5.2. Argentina Encapsulated Flavors Regional Analysis and Outlook
8.5.3. Rest of South America Encapsulated Flavors Regional Analysis and Outlook
8.6. Middle East and Africa Encapsulated Flavors Revenue (USD Million) by Country (2021-2032)
8.6.1. Middle East Encapsulated Flavors Regional Analysis and Outlook
8.6.2. Africa Encapsulated Flavors Regional Analysis and Outlook
Chapter 9. North America Encapsulated Flavors Analysis and Outlook
9.1. North America Encapsulated Flavors Revenue (USD Million) by Segments (2021-2032)
9.1.1. North America Encapsulated Flavors Revenue (USD Million) by Type (2021-2032)
9.1.2. North America Encapsulated Flavors Revenue (USD Million) by Application (2021-2032)
9.1.3. North America Encapsulated Flavors Revenue (USD Million) by Product (2021-2032)
By Product
Flavored Blends
Fragrance Blends
Essential Oils
Natural Extracts
Aroma Chemicals
By Encapsulation Process
Physical Process
Physiochemical Process
Chemical Process
Extrusion
Spray Congealing and Chilling
Sprays Drying
Glass Encapsulation
Fluid Bed
Others
By Flavor
Fruit Flavors
Nut Flavors
Chocolate Flavor
Spice Flavor
Vanilla Flavor
Citric Flavor
Berry Flavor
Others
By Application
Pharmaceuticals
Personal Care
Toiletries and Cleaners
Beverages and Instant drinks
Dairy Products
Frozen Food
Snacks
Cereal and Oatmeal
Bakery and Confectionery
Chapter 10. Europe Encapsulated Flavors Analysis and Outlook
10.1. Europe Encapsulated Flavors Revenue (USD Million), by Segments (USD Million) (2021-2032)
10.1.1. Europe Encapsulated Flavors Revenue (USD Million) by Type (2021-2032)
10.1.2. Europe Encapsulated Flavors Revenue (USD Million) by Application (2021-2032)
10.1.3. Europe Encapsulated Flavors Revenue (USD Million) by Product (2021-2032)
By Product
Flavored Blends
Fragrance Blends
Essential Oils
Natural Extracts
Aroma Chemicals
By Encapsulation Process
Physical Process
Physiochemical Process
Chemical Process
Extrusion
Spray Congealing and Chilling
Sprays Drying
Glass Encapsulation
Fluid Bed
Others
By Flavor
Fruit Flavors
Nut Flavors
Chocolate Flavor
Spice Flavor
Vanilla Flavor
Citric Flavor
Berry Flavor
Others
By Application
Pharmaceuticals
Personal Care
Toiletries and Cleaners
Beverages and Instant drinks
Dairy Products
Frozen Food
Snacks
Cereal and Oatmeal
Bakery and Confectionery
Chapter 11. Asia Pacific Encapsulated Flavors Analysis and Outlook
11.1. Asia Pacific Encapsulated Flavors Revenue (USD Million), and Revenue (USD Million) by Segments (2021-2032)
11.1.1. Asia Pacific Encapsulated Flavors Revenue (USD Million) by Type (2021-2032)
11.1.2. Asia Pacific Encapsulated Flavors Revenue (USD Million) by Application (2021-2032)
11.1.3. Asia Pacific Encapsulated Flavors Revenue (USD Million) by Product (2021-2032)
By Product
Flavored Blends
Fragrance Blends
Essential Oils
Natural Extracts
Aroma Chemicals
By Encapsulation Process
Physical Process
Physiochemical Process
Chemical Process
Extrusion
Spray Congealing and Chilling
Sprays Drying
Glass Encapsulation
Fluid Bed
Others
By Flavor
Fruit Flavors
Nut Flavors
Chocolate Flavor
Spice Flavor
Vanilla Flavor
Citric Flavor
Berry Flavor
Others
By Application
Pharmaceuticals
Personal Care
Toiletries and Cleaners
Beverages and Instant drinks
Dairy Products
Frozen Food
Snacks
Cereal and Oatmeal
Bakery and Confectionery
Chapter 12. South America Encapsulated Flavors Analysis and Outlook
12.1. South America Encapsulated Flavors Revenue (USD Million), by Segments (2021-2032)
12.1.1. South America Encapsulated Flavors Revenue (USD Million) by Type (2021-2032)
12.1.2. South America Encapsulated Flavors Revenue (USD Million) by Application (2021-2032)
12.1.3. South America Encapsulated Flavors Revenue (USD Million) by Product (2021-2032)
By Product
Flavored Blends
Fragrance Blends
Essential Oils
Natural Extracts
Aroma Chemicals
By Encapsulation Process
Physical Process
Physiochemical Process
Chemical Process
Extrusion
Spray Congealing and Chilling
Sprays Drying
Glass Encapsulation
Fluid Bed
Others
By Flavor
Fruit Flavors
Nut Flavors
Chocolate Flavor
Spice Flavor
Vanilla Flavor
Citric Flavor
Berry Flavor
Others
By Application
Pharmaceuticals
Personal Care
Toiletries and Cleaners
Beverages and Instant drinks
Dairy Products
Frozen Food
Snacks
Cereal and Oatmeal
Bakery and Confectionery
Chapter 13. Middle East and Africa Encapsulated Flavors Analysis and Outlook
13.1. Middle East and Africa Encapsulated Flavors Revenue (USD Million), by Segments (2021-2032)
13.1.1. Middle East and Africa Encapsulated Flavors Revenue (USD Million) by Type (2021-2032)
13.1.2. Middle East and Africa Encapsulated Flavors Revenue (USD Million) by Application (2021-2032)
13.1.3. Middle East and Africa Encapsulated Flavors Revenue (USD Million) by Product (2021-2032)
By Product
Flavored Blends
Fragrance Blends
Essential Oils
Natural Extracts
Aroma Chemicals
By Encapsulation Process
Physical Process
Physiochemical Process
Chemical Process
Extrusion
Spray Congealing and Chilling
Sprays Drying
Glass Encapsulation
Fluid Bed
Others
By Flavor
Fruit Flavors
Nut Flavors
Chocolate Flavor
Spice Flavor
Vanilla Flavor
Citric Flavor
Berry Flavor
Others
By Application
Pharmaceuticals
Personal Care
Toiletries and Cleaners
Beverages and Instant drinks
Dairy Products
Frozen Food
Snacks
Cereal and Oatmeal
Bakery and Confectionery
Chapter 14. Encapsulated Flavors Company Profiles
14.1 Business Overview
14.2 Product Profiles
14.3 SWOT Profiles
14.5 Recent Developments
14.6 Financial Profile
List of Companies
Archer Daniels Midland Company (ADM)
AVEKA
AVEKA Group
Cargill Inc
Carmi Flavor & Fragrance Co. Inc Naturex S.A
Ingredion Inc
International Flavors & Fragrances Inc. (IFF)
Nexira SAS
Symrise AG
Synthite Industries Ltd
15. Methodology and Data Sources
15.1 Customization Offerings
15.2 Subscription Services
15.3 Related Reports
15.4 Publisher Expertise
LIST OF TABLES
Table 1 Market Segmentation Analysis
Table 2 Global Encapsulated Flavors Market Share of Leading Companies, 2023
Table 3 Product Offerings of Leading Companies
Table 4 Low Growth Scenario Forecasts
Table 5 Reference Case Growth Scenario
Table 6 High Growth Case Scenario
Table 7 Global Encapsulated Flavors Revenue (USD Million) And CAGR (%) By Type (2021-2032)
Table 8 Global Encapsulated Flavors Revenue (USD Million) And CAGR (%) By Application (2021-2032)
Table 9 Global Encapsulated Flavors Revenue (USD Million) And CAGR (%) By Product (2021-2032)
Table 10 Global Encapsulated Flavors Market Revenue (USD Million) By Regions (2021-2032)
Table 11 Global Encapsulated Flavors Market Share (%) By Regions (2021-2032)
Table 12 North America Encapsulated Flavors Revenue (USD Million) By Country (2021-2032)
Table 13 Europe Encapsulated Flavors Revenue (USD Million) By Country (2021-2032)
Table 14 Asia Pacific Encapsulated Flavors Revenue (USD Million) By Country (2021-2032)
Table 15 South America Encapsulated Flavors Revenue (USD Million) By Country (2021-2032)
Table 16 Middle East and Africa Encapsulated Flavors Revenue (USD Million) By Region (2021-2032)
Table 17 North America Encapsulated Flavors Revenue (USD Million) By Type (2021-2032)
Table 18 North America Encapsulated Flavors Revenue (USD Million) By Application (2021-2032)
Table 19 North America Encapsulated Flavors Revenue (USD Million) By Product (2021-2032)
Table 20 Europe Encapsulated Flavors Revenue (USD Million) By Type (2021-2032)
Table 21 Europe Encapsulated Flavors Revenue (USD Million) By Application (2021-2032)
Table 22 Europe Encapsulated Flavors Revenue (USD Million) By Product (2021-2032)
Table 23 Asia Pacific Encapsulated Flavors Revenue (USD Million) By Type (2021-2032)
Table 24 Asia Pacific Encapsulated Flavors Revenue (USD Million) By Application (2021-2032)
Table 25 Asia Pacific Encapsulated Flavors Revenue (USD Million) By Product (2021-2032)
Table 26 South America Encapsulated Flavors Revenue (USD Million) By Type (2021-2032)
Table 27 South America Encapsulated Flavors Revenue (USD Million) By Application (2021-2032)
Table 28 South America Encapsulated Flavors Revenue (USD Million) By Product (2021-2032)
Table 29 Middle East and Africa Encapsulated Flavors Revenue (USD Million) By Type (2021-2032)
Table 30 Middle East and Africa Encapsulated Flavors Revenue (USD Million) By Application (2021-2032)
Table 31 Middle East and Africa Encapsulated Flavors Revenue (USD Million) By Product (2021-2032)
LIST OF FIGURES
Figure 1. Market Scope
Figure 2. Pricing Forecasts Per Unit, 2023- 2032
Figure 3. Porter’s Five Forces
Figure 4. Global Encapsulated Flavors Market Revenue (USD Million) By Regions (2021-2032)
Figure 5. Global Encapsulated Flavors Market Share (%) By Regions (2023)
Figure 6. North America Encapsulated Flavors Revenue (USD Million) By Country (2021-2032)
Figure 7. United States Encapsulated Flavors Revenue (USD Million) By Country (2021-2032)
Figure 8. Canada Encapsulated Flavors Revenue (USD Million) By Country (2021-2032)
Figure 9. Mexico Encapsulated Flavors Revenue (USD Million) By Country (2021-2032)
Figure 10. Europe Encapsulated Flavors Revenue (USD Million) By Country (2021-2032)
Figure 11. Germany Encapsulated Flavors Revenue (USD Million) By Country (2021-2032)
Figure 12. France Encapsulated Flavors Revenue (USD Million) By Country (2021-2032)
Figure 13. United Kingdom Encapsulated Flavors Revenue (USD Million) By Country (2021-2032)
Figure 14. Spain Encapsulated Flavors Revenue (USD Million) By Country (2021-2032)
Figure 15. Italy Encapsulated Flavors Revenue (USD Million) By Country (2021-2032)
Figure 16. Russia Encapsulated Flavors Revenue (USD Million) By Country (2021-2032)
Figure 17. Rest of Europe Encapsulated Flavors Revenue (USD Million) By Country (2021-2032)
Figure 11. Asia Pacific Encapsulated Flavors Revenue (USD Million) By Country (2021-2032)
Figure 12. China Encapsulated Flavors Revenue (USD Million) By Country (2021-2032)
Figure 13. Japan Encapsulated Flavors Revenue (USD Million) By Country (2021-2032)
Figure 14. India Encapsulated Flavors Revenue (USD Million) By Country (2021-2032)
Figure 15. South Korea Encapsulated Flavors Revenue (USD Million) By Country (2021-2032)
Figure 16. Australia Encapsulated Flavors Revenue (USD Million) By Country (2021-2032)
Figure 17. South East Asia Encapsulated Flavors Revenue (USD Million) By Country (2021-2032)
Figure 18. South America Encapsulated Flavors Revenue (USD Million) By Country (2021-2032)
Figure 19. Brazil Encapsulated Flavors Revenue (USD Million) By Country (2021-2032)
Figure 20. Argentina Encapsulated Flavors Revenue (USD Million) By Country (2021-2032)
Figure 21. Rest of Asia Pacific Encapsulated Flavors Revenue (USD Million) By Country (2021-2032)
Figure 22. Middle East and Africa Encapsulated Flavors Revenue (USD Million) By Region (2021-2032)
Figure 23. Saudi Arabia Encapsulated Flavors Revenue (USD Million) By Region (2021-2032)
Figure 24. The UAE Encapsulated Flavors Revenue (USD Million) By Region (2021-2032)
Figure 25. Rest of Middle East Encapsulated Flavors Revenue (USD Million) By Region (2021-2032)
Figure 26. South Africa Encapsulated Flavors Revenue (USD Million) By Region (2021-2032)
Figure 27. Africa Encapsulated Flavors Revenue (USD Million) By Region (2021-2032)
Figure 28. North America Encapsulated Flavors Revenue (USD Million) By Type (2021-2032)
Figure 29. North America Encapsulated Flavors Revenue (USD Million) By Application (2021-2032)
Figure 30. North America Encapsulated Flavors Revenue (USD Million) By Product (2021-2032)
Figure 31. Europe Encapsulated Flavors Revenue (USD Million) By Type (2021-2032)
Figure 32. Europe Encapsulated Flavors Revenue (USD Million) By Application (2021-2032)
Figure 33. Europe Encapsulated Flavors Revenue (USD Million) By Product (2021-2032)
Figure 34. Asia Pacific Encapsulated Flavors Revenue (USD Million) By Type (2021-2032)
Figure 35. Asia Pacific Encapsulated Flavors Revenue (USD Million) By Application (2021-2032)
Figure 36. Asia Pacific Encapsulated Flavors Revenue (USD Million) By Product (2021-2032)
Figure 37. South America Encapsulated Flavors Revenue (USD Million) By Type (2021-2032)
Figure 38. South America Encapsulated Flavors Revenue (USD Million) By Application (2021-2032)
Figure 39. South America Encapsulated Flavors Revenue (USD Million) By Product (2021-2032)
Figure 40. Middle East and Africa Encapsulated Flavors Revenue (USD Million) By Type (2021-2032)
Figure 41. Middle East and Africa Encapsulated Flavors Revenue (USD Million) By Application (2021-2032)
Figure 42. Middle East and Africa Encapsulated Flavors Revenue (USD Million) By Product (2021-2032)
By Product
Flavored Blends
Fragrance Blends
Essential Oils
Natural Extracts
Aroma Chemicals
By Encapsulation Process
Physical Process
Physiochemical Process
Chemical Process
Extrusion
Spray Congealing and Chilling
Sprays Drying
Glass Encapsulation
Fluid Bed
Others
By Flavor
Fruit Flavors
Nut Flavors
Chocolate Flavor
Spice Flavor
Vanilla Flavor
Citric Flavor
Berry Flavor
Others
By Application
Pharmaceuticals
Personal Care
Toiletries and Cleaners
Beverages and Instant drinks
Dairy Products
Frozen Food
Snacks
Cereal and Oatmeal
Bakery and Confectionery
Countries Analyzed
North America (US, Canada, Mexico)
Europe (Germany, UK, France, Spain, Italy, Russia, Rest of Europe)
Asia Pacific (China, India, Japan, South Korea, Australia, South East Asia, Rest of Asia)
South America (Brazil, Argentina, Rest of South America)
Middle East and Africa (Saudi Arabia, UAE, Rest of Middle East, South Africa, Egypt, Rest of Africa)
