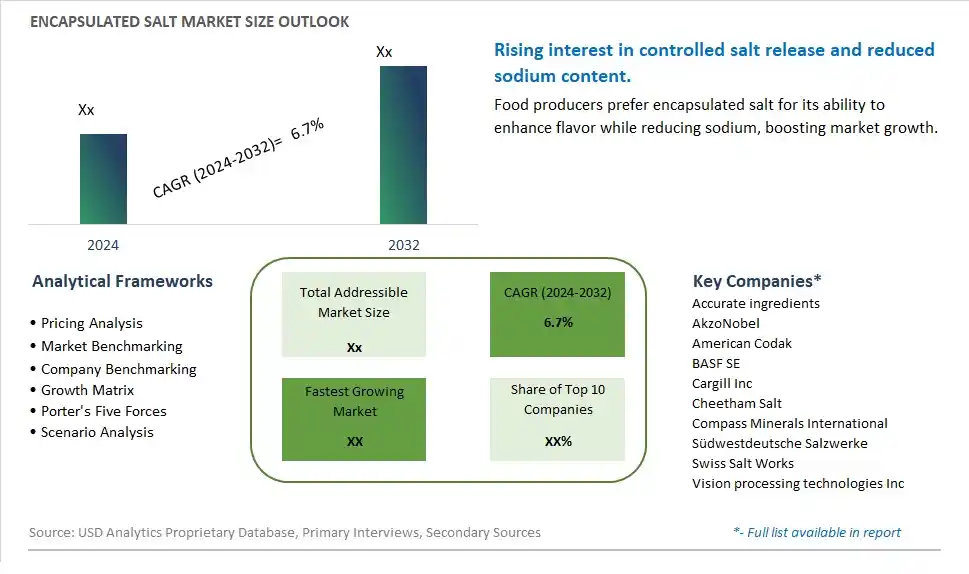
Global Encapsulated Salt Market Size is valued at $XX Million in 2024 and is forecast to register a growth rate (CAGR) of 6.7% to reach $XX Million by 2032.
The global Encapsulated Salt Market Comprehensive Study analyzes and forecasts the market size across 6 regions and 24 countries for diverse segments -By Type (Solar Salt, Rock Salt, Vacuum Salt), By End-User (Food, Baked Goods, Confectionery, Frozen Food)
An Introduction to Encapsulated Salt Market
In 2024, the Encapsulated Salt market is thriving, fueled by the increasing demand for improved taste and controlled salt release in food products. Encapsulated salt is used in various applications, including bakery, snacks, and processed meats, to enhance flavor and reduce sodium content without compromising taste. The market benefits from advancements in encapsulation technologies, the rising trend of health-conscious eating, and the growing demand for clean label and functional ingredients. Additionally, innovations in product formulation and the increasing focus on salt reduction are driving market growth.
Encapsulated Salt Competitive Landscape
The market report analyses the leading companies in the industry including Accurate ingredients, AkzoNobel, American Codak, BASF SE, Cargill Inc, Cheetham Salt, Compass Minerals International, Südwestdeutsche Salzwerke, Swiss Salt Works, Vision processing technologies Inc, and Others.
Encapsulated Salt Market Dynamics
Encapsulated Salt Market Trend: Demand for Sodium Reduction and Controlled Release Solutions
The market for encapsulated salt is experiencing a prominent trend towards the demand for sodium reduction and controlled release solutions. As health-conscious consumers and food manufacturers prioritize reducing sodium content in food products, encapsulated salt offers a viable solution by providing controlled release of saltiness, flavor enhancement, and functional benefits while using less sodium. This trend is driven by the growing awareness of the health risks associated with excessive sodium intake and the need for healthier food options without compromising taste and sensory attributes.
Encapsulated Salt Market Driver: Regulatory Pressures and Consumer Preferences for Healthier Options
A major driver for the encapsulated salt market is regulatory pressures and consumer preferences for healthier options. Government initiatives and regulatory guidelines advocating for reduced sodium levels in processed foods have prompted food manufacturers to explore alternative salt delivery systems such as encapsulation. Additionally, consumer demand for clean label products, natural ingredients, and functional foods drives the adoption of encapsulated salt as a means to achieve sodium reduction goals while maintaining product quality, taste perception, and consumer acceptance.
Encapsulated Salt Market Opportunity: Collaboration for Sodium Reduction and Flavor Enhancement Solutions
The encapsulated salt market presents a significant opportunity for collaboration between food manufacturers, ingredient suppliers, and encapsulation technology providers to develop sodium reduction and flavor enhancement solutions. Companies specializing in encapsulation technologies can work with food industry partners to create customized encapsulated salt systems that meet sodium reduction targets, enhance flavor release, improve product stability, and address formulation challenges. This opportunity includes exploring innovative encapsulation methods, coating materials, and release mechanisms to optimize saltiness perception, minimize salt usage, and create healthier food options that align with consumer preferences and regulatory requirements. Collaborative efforts focused on sodium reduction and flavor enhancement can lead to the development of market-leading products that cater to health-conscious consumers while ensuring taste satisfaction and product performance.
Encapsulated Salt Market Share Analysis: Vacuum Salt segment generated the highest revenue share in the industry
The largest segment in the Encapsulated Salt Market is Vacuum Salt. Vacuum salt, also known as evaporated salt, is produced by evaporating salt brine in a vacuum chamber, resulting in pure, fine-grained salt crystals. This type of salt is widely used in various industries and applications due to its high purity, consistent quality, and versatility. In the food industry, vacuum salt is commonly used as a seasoning, flavor enhancer, and preservative in processed foods, snacks, sauces, and condiments. Its fine texture and high solubility make it ideal for blending with other ingredients and ensuring uniform distribution of salt in food products. Further, vacuum salt is extensively utilized in the production of ready-to-eat meals, instant soups, and convenience foods due to its quick dissolving properties and ability to enhance taste profiles. In addition to food applications, vacuum salt finds significant use in industries such as pharmaceuticals, cosmetics, and water treatment, where high-purity salt is essential for manufacturing processes and product formulations. The growing demand for processed foods, convenience products, and industrial applications drives the market for vacuum salt encapsulation, making it the largest segment in the Encapsulated Salt Market.
Encapsulated Salt Market Share Analysis: Frozen Food is the fastest growing segment over the forecast period to 2032
The fastest growing segment in the Encapsulated Salt Market is Frozen Food. Encapsulated salt is increasingly being utilized in frozen food applications due to its ability to maintain flavor, texture, and overall quality during the freezing and thawing processes. In frozen food products such as frozen meals, pizzas, snacks, and desserts, encapsulated salt helps prevent moisture migration and maintains the desired saltiness and taste profile, even after prolonged freezing periods. This is crucial for ensuring consumer satisfaction and retaining the sensory attributes of frozen food items. Further, encapsulated salt in frozen food applications also contributes to shelf stability, extends product shelf life, and minimizes flavor degradation, thereby enhancing product appeal and marketability. The rising demand for convenient, ready-to-eat frozen food products among consumers, coupled with the increasing focus on product innovation and quality preservation in the frozen food industry, drives the fast growth of encapsulated salt in the Frozen Food segment of the Encapsulated Salt Market.
Encapsulated Salt Market Segmentation
By Type
Solar Salt
Rock Salt
Vacuum Salt
By End-User
Food
Baked Goods
Confectionery
Frozen Food
Countries Analyzed
North America (US, Canada, Mexico)
Europe (Germany, UK, France, Spain, Italy, Russia, Rest of Europe)
Asia Pacific (China, India, Japan, South Korea, Australia, South East Asia, Rest of Asia)
South America (Brazil, Argentina, Rest of South America)
Middle East and Africa (Saudi Arabia, UAE, Rest of Middle East, South Africa, Egypt, Rest of Africa)
Encapsulated Salt Companies Profiled in the Study
Accurate ingredients
AkzoNobel
American Codak
BASF SE
Cargill Inc
Cheetham Salt
Compass Minerals International
Südwestdeutsche Salzwerke
Swiss Salt Works
Vision processing technologies Inc
*- List Not Exhaustive
Chapter 1. TABLE OF CONTENTS
Chapter 2. Introduction to Encapsulated Salt Market
2.1. Market Overview
2.2. Key Statistics and Report Highlights
2.3. Scope of the Comprehensive Study
2.3.1. Market Definition
2.3.2 Countries and Regions Covered
2.3.3 Research Objective
2.3.4 Units, Currency, and Conversions
2.3.5 Industry Value Chain
2.4. Key Market Segments
2.5. Key Companies
2.6. Study Period
Chapter 3. Strategic Analysis Review
3.1. Encapsulated Salt Pricing Analysis and Forecast
3.2. Porter’s Five Forces
3.3. Market Ecosystem
3.4. SWOT Analysis
3.5. Regulatory Scenario
3.3. Effects of Inflation, Russia-Ukraine War, moderating economic growth, and other macroeconomic factors
Chapter 4. Competitive Landscape
4.1. Market Share Analysis
4.1.1. Global Encapsulated Salt Market Share by Company, 2023
4.1.2. Product Offerings of Leading Encapsulated Salt Companies
4.2. Market Entropy
4.2.1. New Product Launches in the Industry
4.2.2. Mergers, Acquisitions, Joint ventures, and Partnerships
4.3. Key Strategies and Best Practices
Chapter 5. Global Market Projections: Best, Reference, and Low Case Scenarios
5.1. Growth Analysis- Case Scenario Definitions
5.2. Low Growth Case Scenario Forecasts
5.3. Reference Growth Case Scenario Forecasts
5.4. High Growth Case Scenario Forecasts
Chapter 6. Market Dynamics
6.1. Encapsulated Salt Market Drivers
6.2. Encapsulated Salt Market Challenges
6.6. Encapsulated Salt Market Opportunities
6.4. Encapsulated Salt Market Trends
Chapter 7. Global Encapsulated Salt Market Outlook Trends
7.1. Global Encapsulated Salt Revenue (USD Million) and CAGR (%) by Type (2021-2032)
7.2. Global Encapsulated Salt Revenue (USD Million) and CAGR (%) by Application (2021-2032)
7.3. Global Encapsulated Salt Revenue (USD Million) and CAGR (%) by Product (2021-2032)
By Type
Solar Salt
Rock Salt
Vacuum Salt
By End-User
Food
Baked Goods
Confectionery
Frozen Food
Chapter 8. Global Encapsulated Salt Regional Analysis and Outlook
8.1. Global Encapsulated Salt Revenue (USD Million) By Regions (2021- 2032)
8.2. North America Encapsulated Salt Revenue (USD Million) by Country (2021-2032)
8.2.1. United States Encapsulated Salt Regional Analysis and Outlook
8.2.2. Canada Encapsulated Salt Regional Analysis and Outlook
8.2.3. Mexico Encapsulated Salt Regional Analysis and Outlook
8.3. Europe Encapsulated Salt Revenue (USD Million), by Country (2021-2032)
8.3.1. Germany Encapsulated Salt Regional Analysis and Outlook
8.3.2. France Encapsulated Salt Regional Analysis and Outlook
8.3.3. United Kingdom Encapsulated Salt Regional Analysis and Outlook
8.3.4. Spain Encapsulated Salt Regional Analysis and Outlook
8.3.5. Italy Encapsulated Salt Regional Analysis and Outlook
8.3.6. Russia Encapsulated Salt Regional Analysis and Outlook
8.3.7. Rest of Europe Encapsulated Salt Regional Analysis and Outlook
8.4. Asia Pacific Encapsulated Salt Revenue (USD Million) by Country (2021-2032)
8.4.1. China Encapsulated Salt Regional Analysis and Outlook
8.4.2. Japan Encapsulated Salt Regional Analysis and Outlook
8.4.3. India Encapsulated Salt Regional Analysis and Outlook
8.4.4. South Korea Encapsulated Salt Regional Analysis and Outlook
8.4.5. Australia Encapsulated Salt Regional Analysis and Outlook
8.4.6. South East Asia Encapsulated Salt Regional Analysis and Outlook
8.4.7. Rest of Asia Pacific Encapsulated Salt Regional Analysis and Outlook
8.5. South America Encapsulated Salt Revenue (USD Million), by Country (2021-2032)
8.5.1. Brazil Encapsulated Salt Regional Analysis and Outlook
8.5.2. Argentina Encapsulated Salt Regional Analysis and Outlook
8.5.3. Rest of South America Encapsulated Salt Regional Analysis and Outlook
8.6. Middle East and Africa Encapsulated Salt Revenue (USD Million) by Country (2021-2032)
8.6.1. Middle East Encapsulated Salt Regional Analysis and Outlook
8.6.2. Africa Encapsulated Salt Regional Analysis and Outlook
Chapter 9. North America Encapsulated Salt Analysis and Outlook
9.1. North America Encapsulated Salt Revenue (USD Million) by Segments (2021-2032)
9.1.1. North America Encapsulated Salt Revenue (USD Million) by Type (2021-2032)
9.1.2. North America Encapsulated Salt Revenue (USD Million) by Application (2021-2032)
9.1.3. North America Encapsulated Salt Revenue (USD Million) by Product (2021-2032)
By Type
Solar Salt
Rock Salt
Vacuum Salt
By End-User
Food
Baked Goods
Confectionery
Frozen Food
Chapter 10. Europe Encapsulated Salt Analysis and Outlook
10.1. Europe Encapsulated Salt Revenue (USD Million), by Segments (USD Million) (2021-2032)
10.1.1. Europe Encapsulated Salt Revenue (USD Million) by Type (2021-2032)
10.1.2. Europe Encapsulated Salt Revenue (USD Million) by Application (2021-2032)
10.1.3. Europe Encapsulated Salt Revenue (USD Million) by Product (2021-2032)
By Type
Solar Salt
Rock Salt
Vacuum Salt
By End-User
Food
Baked Goods
Confectionery
Frozen Food
Chapter 11. Asia Pacific Encapsulated Salt Analysis and Outlook
11.1. Asia Pacific Encapsulated Salt Revenue (USD Million), and Revenue (USD Million) by Segments (2021-2032)
11.1.1. Asia Pacific Encapsulated Salt Revenue (USD Million) by Type (2021-2032)
11.1.2. Asia Pacific Encapsulated Salt Revenue (USD Million) by Application (2021-2032)
11.1.3. Asia Pacific Encapsulated Salt Revenue (USD Million) by Product (2021-2032)
By Type
Solar Salt
Rock Salt
Vacuum Salt
By End-User
Food
Baked Goods
Confectionery
Frozen Food
Chapter 12. South America Encapsulated Salt Analysis and Outlook
12.1. South America Encapsulated Salt Revenue (USD Million), by Segments (2021-2032)
12.1.1. South America Encapsulated Salt Revenue (USD Million) by Type (2021-2032)
12.1.2. South America Encapsulated Salt Revenue (USD Million) by Application (2021-2032)
12.1.3. South America Encapsulated Salt Revenue (USD Million) by Product (2021-2032)
By Type
Solar Salt
Rock Salt
Vacuum Salt
By End-User
Food
Baked Goods
Confectionery
Frozen Food
Chapter 13. Middle East and Africa Encapsulated Salt Analysis and Outlook
13.1. Middle East and Africa Encapsulated Salt Revenue (USD Million), by Segments (2021-2032)
13.1.1. Middle East and Africa Encapsulated Salt Revenue (USD Million) by Type (2021-2032)
13.1.2. Middle East and Africa Encapsulated Salt Revenue (USD Million) by Application (2021-2032)
13.1.3. Middle East and Africa Encapsulated Salt Revenue (USD Million) by Product (2021-2032)
By Type
Solar Salt
Rock Salt
Vacuum Salt
By End-User
Food
Baked Goods
Confectionery
Frozen Food
Chapter 14. Encapsulated Salt Company Profiles
14.1 Business Overview
14.2 Product Profiles
14.3 SWOT Profiles
14.5 Recent Developments
14.6 Financial Profile
List of Companies
Accurate ingredients
AkzoNobel
American Codak
BASF SE
Cargill Inc
Cheetham Salt
Compass Minerals International
Südwestdeutsche Salzwerke
Swiss Salt Works
Vision processing technologies Inc
15. Methodology and Data Sources
15.1 Customization Offerings
15.2 Subscription Services
15.3 Related Reports
15.4 Publisher Expertise
LIST OF TABLES
Table 1 Market Segmentation Analysis
Table 2 Global Encapsulated Salt Market Share of Leading Companies, 2023
Table 3 Product Offerings of Leading Companies
Table 4 Low Growth Scenario Forecasts
Table 5 Reference Case Growth Scenario
Table 6 High Growth Case Scenario
Table 7 Global Encapsulated Salt Revenue (USD Million) And CAGR (%) By Type (2021-2032)
Table 8 Global Encapsulated Salt Revenue (USD Million) And CAGR (%) By Application (2021-2032)
Table 9 Global Encapsulated Salt Revenue (USD Million) And CAGR (%) By Product (2021-2032)
Table 10 Global Encapsulated Salt Market Revenue (USD Million) By Regions (2021-2032)
Table 11 Global Encapsulated Salt Market Share (%) By Regions (2021-2032)
Table 12 North America Encapsulated Salt Revenue (USD Million) By Country (2021-2032)
Table 13 Europe Encapsulated Salt Revenue (USD Million) By Country (2021-2032)
Table 14 Asia Pacific Encapsulated Salt Revenue (USD Million) By Country (2021-2032)
Table 15 South America Encapsulated Salt Revenue (USD Million) By Country (2021-2032)
Table 16 Middle East and Africa Encapsulated Salt Revenue (USD Million) By Region (2021-2032)
Table 17 North America Encapsulated Salt Revenue (USD Million) By Type (2021-2032)
Table 18 North America Encapsulated Salt Revenue (USD Million) By Application (2021-2032)
Table 19 North America Encapsulated Salt Revenue (USD Million) By Product (2021-2032)
Table 20 Europe Encapsulated Salt Revenue (USD Million) By Type (2021-2032)
Table 21 Europe Encapsulated Salt Revenue (USD Million) By Application (2021-2032)
Table 22 Europe Encapsulated Salt Revenue (USD Million) By Product (2021-2032)
Table 23 Asia Pacific Encapsulated Salt Revenue (USD Million) By Type (2021-2032)
Table 24 Asia Pacific Encapsulated Salt Revenue (USD Million) By Application (2021-2032)
Table 25 Asia Pacific Encapsulated Salt Revenue (USD Million) By Product (2021-2032)
Table 26 South America Encapsulated Salt Revenue (USD Million) By Type (2021-2032)
Table 27 South America Encapsulated Salt Revenue (USD Million) By Application (2021-2032)
Table 28 South America Encapsulated Salt Revenue (USD Million) By Product (2021-2032)
Table 29 Middle East and Africa Encapsulated Salt Revenue (USD Million) By Type (2021-2032)
Table 30 Middle East and Africa Encapsulated Salt Revenue (USD Million) By Application (2021-2032)
Table 31 Middle East and Africa Encapsulated Salt Revenue (USD Million) By Product (2021-2032)
LIST OF FIGURES
Figure 1. Market Scope
Figure 2. Pricing Forecasts Per Unit, 2023- 2032
Figure 3. Porter’s Five Forces
Figure 4. Global Encapsulated Salt Market Revenue (USD Million) By Regions (2021-2032)
Figure 5. Global Encapsulated Salt Market Share (%) By Regions (2023)
Figure 6. North America Encapsulated Salt Revenue (USD Million) By Country (2021-2032)
Figure 7. United States Encapsulated Salt Revenue (USD Million) By Country (2021-2032)
Figure 8. Canada Encapsulated Salt Revenue (USD Million) By Country (2021-2032)
Figure 9. Mexico Encapsulated Salt Revenue (USD Million) By Country (2021-2032)
Figure 10. Europe Encapsulated Salt Revenue (USD Million) By Country (2021-2032)
Figure 11. Germany Encapsulated Salt Revenue (USD Million) By Country (2021-2032)
Figure 12. France Encapsulated Salt Revenue (USD Million) By Country (2021-2032)
Figure 13. United Kingdom Encapsulated Salt Revenue (USD Million) By Country (2021-2032)
Figure 14. Spain Encapsulated Salt Revenue (USD Million) By Country (2021-2032)
Figure 15. Italy Encapsulated Salt Revenue (USD Million) By Country (2021-2032)
Figure 16. Russia Encapsulated Salt Revenue (USD Million) By Country (2021-2032)
Figure 17. Rest of Europe Encapsulated Salt Revenue (USD Million) By Country (2021-2032)
Figure 11. Asia Pacific Encapsulated Salt Revenue (USD Million) By Country (2021-2032)
Figure 12. China Encapsulated Salt Revenue (USD Million) By Country (2021-2032)
Figure 13. Japan Encapsulated Salt Revenue (USD Million) By Country (2021-2032)
Figure 14. India Encapsulated Salt Revenue (USD Million) By Country (2021-2032)
Figure 15. South Korea Encapsulated Salt Revenue (USD Million) By Country (2021-2032)
Figure 16. Australia Encapsulated Salt Revenue (USD Million) By Country (2021-2032)
Figure 17. South East Asia Encapsulated Salt Revenue (USD Million) By Country (2021-2032)
Figure 18. South America Encapsulated Salt Revenue (USD Million) By Country (2021-2032)
Figure 19. Brazil Encapsulated Salt Revenue (USD Million) By Country (2021-2032)
Figure 20. Argentina Encapsulated Salt Revenue (USD Million) By Country (2021-2032)
Figure 21. Rest of Asia Pacific Encapsulated Salt Revenue (USD Million) By Country (2021-2032)
Figure 22. Middle East and Africa Encapsulated Salt Revenue (USD Million) By Region (2021-2032)
Figure 23. Saudi Arabia Encapsulated Salt Revenue (USD Million) By Region (2021-2032)
Figure 24. The UAE Encapsulated Salt Revenue (USD Million) By Region (2021-2032)
Figure 25. Rest of Middle East Encapsulated Salt Revenue (USD Million) By Region (2021-2032)
Figure 26. South Africa Encapsulated Salt Revenue (USD Million) By Region (2021-2032)
Figure 27. Africa Encapsulated Salt Revenue (USD Million) By Region (2021-2032)
Figure 28. North America Encapsulated Salt Revenue (USD Million) By Type (2021-2032)
Figure 29. North America Encapsulated Salt Revenue (USD Million) By Application (2021-2032)
Figure 30. North America Encapsulated Salt Revenue (USD Million) By Product (2021-2032)
Figure 31. Europe Encapsulated Salt Revenue (USD Million) By Type (2021-2032)
Figure 32. Europe Encapsulated Salt Revenue (USD Million) By Application (2021-2032)
Figure 33. Europe Encapsulated Salt Revenue (USD Million) By Product (2021-2032)
Figure 34. Asia Pacific Encapsulated Salt Revenue (USD Million) By Type (2021-2032)
Figure 35. Asia Pacific Encapsulated Salt Revenue (USD Million) By Application (2021-2032)
Figure 36. Asia Pacific Encapsulated Salt Revenue (USD Million) By Product (2021-2032)
Figure 37. South America Encapsulated Salt Revenue (USD Million) By Type (2021-2032)
Figure 38. South America Encapsulated Salt Revenue (USD Million) By Application (2021-2032)
Figure 39. South America Encapsulated Salt Revenue (USD Million) By Product (2021-2032)
Figure 40. Middle East and Africa Encapsulated Salt Revenue (USD Million) By Type (2021-2032)
Figure 41. Middle East and Africa Encapsulated Salt Revenue (USD Million) By Application (2021-2032)
Figure 42. Middle East and Africa Encapsulated Salt Revenue (USD Million) By Product (2021-2032)
By Type
Solar Salt
Rock Salt
Vacuum Salt
By End-User
Food
Baked Goods
Confectionery
Frozen Food
Countries Analyzed
North America (US, Canada, Mexico)
Europe (Germany, UK, France, Spain, Italy, Russia, Rest of Europe)
Asia Pacific (China, India, Japan, South Korea, Australia, South East Asia, Rest of Asia)
South America (Brazil, Argentina, Rest of South America)
Middle East and Africa (Saudi Arabia, UAE, Rest of Middle East, South Africa, Egypt, Rest of Africa)
